DEVELOPMENT AND VALIDATION OF ANALYTICAL METHOD FOR THE ESTIMATION OF A
COMBINATION OF PRAVASTATIN SODIUM AND VALSARTAN BY REVERSED PHASE-HIGH
PERFORMANCE LIQUID CHROMATOGRAPHY
SUNNY JALHAN*, MANISHA KOTACH, UPENDRA K JAIN
Department of Pharmaceutical Chemistry, Chandigarh College of Pharmacy, Landran, Mohali, Punjab, India. Email: [email protected]
Received: 28 April 2016, Revised and Accepted: 13 May 2016 ABSTRACT
Objective: The main aim of this study was to develop and validate analytical methods for an estimation of a combination of two different drugs by high performance liquid chromatography (HPLC). The objective of this study was to demonstrate that the method is suitable for its intended purpose as it is stated in ICH guidelines. The method was validated for linearity, precision, accuracy, specificity, and limit of detection, limit of quantification, and robustness.
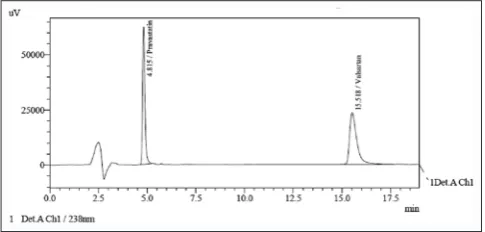
Methods: Various parameters were analyzed for a drug combination according to standard procedures. The aim of this study was to develop a simple, accurate, and precise HPLC method for the analysis of the combination of pravastatin sodium (PVS) and valsartan using mobile phase and commonly employed Nucleodur C18 column with ultraviolet detector at 238 nm. The typical chromatogram of PVS and valsartan was shown in Fig. 5. The optimal
retention time was found to be 4.815 minutes for PVS and 15.518 minutes for valsartan.
Result: The result of linearity for both PVS and valsartan was given in Tables 1 and 2, respectively. The results are shown in Tables 3 and 4. The repeatability refers to the use of the analytical procedure within a laboratory over a short period of time using the same analyst with the same equipment and is expressed as the % relative standard deviation (RSD). The results of method precision are shown in Table 4. The % RSD for method precision was found to be 0.79 for PVS and 0.32 for valsartan. The results are shown in Tables 5 and 6. The ruggedness of analytical method is the degree of reproducibility of the test results obtained by the same samples under a variety of conditions such as different laboratories, different analysts, different instruments, different lots of reagents, and different days. The assay result indicated that the method was capable with a high precision. The results of % RSD prove the ruggedness of developed method as shown in Tables 7 and 8.
Conclusion: The proposed reversed phase-HPLC method enables the determination of PVS and valsartan because of a good separation of chromatographic peaks (Fig. 5). The method can be used successfully for the analysis of PVS and valsartan in combination.
Keywords: Pravastatin sodium, Valsartan, High performance liquid chromatography, Validation.
INTRODUCTION
Pravastatin sodium (PVS) is a member of the 3-hydroxy-3-methylglutaryl-coenzyme A (HMG-CoA) reductase inhibitors class of lipid-lowering drugs. PVS is a selective, competitive inhibitor of HMG-CoA reductase, the rate-limiting enzyme that converts 3-hydroxy-3 methyl glutaryl-coenzyme A to mevalonate, a precursor of the sterols including cholesterol. It is mainly used for the treatment of hypercholesterolemia and prevention of cardiovascular disease. PVS is chemically, Sodium(3R,5R)-3,5-dihydroxy-7-[(1S,2S,6S,8S,8aR)-6-hydroxy-2-methyl-8-[[(2S)-2-methylbutanoyl]oxy]-1, 2, 6, 7, 8, 8 ahexahydronaphthalen-1-yl] heptanoate [1,2].
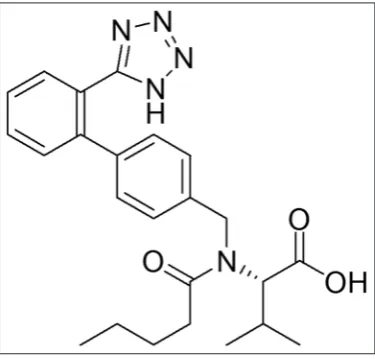
Valsartan is chemically 3-methyl-2- [pentanoyl-[[4-[2-(2H-tetrazol-5-yl) phenyl] phenyl] methyl]amino] -butanoic acid (Fig. 2), angiotensin II receptor antagonist, acting on the AT1 subtype and used for the treatment of high blood pressure, congestive heart failure, and post-myocardial infarction. By blocking the action of angiotensin, valsartan dilates blood vessels and reduces blood pressure [3,4].
A survey of literature has revealed that there are a very few high performance liquid chromatography (HPLC) methods available for the determination of a combination of PVS and valsartan. However, HPLC studies have been performed individually on both the drugs. The main objective was to develop and validate HPLC method for the combination of PVS and valsartan, as few research studies indicate that statins and angiotensin II Type 1 receptor blocker therapy improves endothelial
dysfunction using distinct mechanisms. Evaluations were made on simultaneous vascular and metabolic responses to PVS and valsartan therapy, alone or in combination, in hypercholesterolemic patients. There was simultaneous improvement in metabolic phenotypes, with all three treatments causing increased plasma adiponectin levels, reduced fasting insulin levels, and increased insulin sensitivity relative to baseline measurements. The studies show that in a statin combination trial, pravastatin combined with valsartan therapy increased plasma adiponectin, lowered fasting insulin levels, and improved insulin sensitivity in an additive manner when compared with monotherapy alone [5].
METHODS Instrumentation
The HPLC (Shimadzu, Kyoto, Japan) instrument was equipped with two LC-10 ATVP pumps, SPD-10AVP ultraviolet (UV)-visible detector, and Rheodyne injector with 50 µl loop. The results were acquired and processed using Shimadzu LC-solution version 6.42 software for data acquisition and processing.
Column: Nucleodur C18 (250 mm × 4.6 mm I.D., 5 µm).
Chemicals and reagents
HPLC grade methanol, glacial acetic acid, acetonitrile, and triethylamine were procured from Thermo Fischer scientific India Pvt. Ltd., and potassium dihydrogen phosphate was purchased from Merck
specialties Pvt. Ltd., Mumbai. The active pharmaceutical ingredients PVS and valsartan were obtained from Oniosome Research Centre.
Chromatographic condition
The mobile phase was composed of acetonitrile:water:glacial acetic acid in the ratio of 450:550:0.1, on a reversed phase (RP) C18 column.
The flow rate was 1.0 ml/minutes and the detection wavelength was 238 nm. The injected volume was 20 µL.
Preparation of the mobile phase and diluent
The mobile phase was composed of buffer (0.025 of glacial acetic acid in 250 ml of water) and acetonitrile. The solution was filtered through 0.45 µm filter under vacuum and degassed in an ultrasonic water bath for 10 minutes. A mixture of methanol:water (50:50) was used as diluent.
Standard preparation
A stock solution of PVS and valsartan was prepared by accurately weighing 10 mg drug, transferring to 1 ml appendroff, dissolving in 1 ml of a diluent methanol:water (50:50) and was sonicated to dissolve. Then, further dilutions were made to obtain the final standard solution of 100 µg/ml.
Preparation of sample solution
From the 1 µg/ml dilutions each of PVS and valsartan, 0.1 ml was taken into an appendroff and volume was made up to 1 ml with diluent. The sample solution was filtered through 0.25 µm filter.
Method validation
The objective of the method validation is to demonstrate that the method is suitable for its intended purpose as it is stated in ICH guidelines. The method was validated for linearity, precision, accuracy, specificity, and limit of detection (LOD), limit of quantification (LOQ), and robustness.
Linearity
To evaluate the linearity of PVS, serial dilution of analyte was prepared from the stock solution by taking suitable volume and diluted up to 1 ml to get the desired concentrations (0.125, 0.250, 0.5, 1, 2, 3, 4, 5, 6, 7, 8, 9, and 10 µg/ml) for linearity in the range of 0.125-10 µg/ml. Likewise, the dilutions for valsartan were made to get the desired concentrations (1.25, 2.5, 5, 10, 20, 30, 40, 50, 60, 70, 80, 90, and 100 µg/ml) for linearity in the range of 1.25-100 µg/ml. The prepared solutions were filtered through 0.45 µm membrane filter and each of the dilutions was injected three times into the column. Absorbance at 238 nm was measured, and a calibration curve for PVS and valsartan was constructed by plotting the mean peak area (Y-axis) against the concentration (X-axis).
Precision
The precision of the method was investigated with respect to repeatability and ruggedness.
Interday and intraday
Intraday precision was calculated from six replicate injections of freshly prepared PVS and valsartan test solution in the same equipment at a concentration value of 5 and 50 µg/ml, respectively, on the same day after regular interval. The interday experiment was repeated by assaying freshly prepared solution at the same concentration, in addition, on 2 consecutive days to determine interday intermediate precision.
Method precision (repeatability)
The method precision for assay was established by determining the assay of six sample preparations under the same conditions. Six replicates of PVS (5 µg/ml) and valsartan (50 µg/ml) sample solution were prepared at sample concentration by one analyst and analyzed on the same day.
Intermediate precision (ruggedness)
Different analyst, using a different system, repeated the procedure followed for method precision on a different day using same lot of sample.
Accuracy
The accuracy was determined over the range 80-120% of the sample concentration. Calculated amount of PVS and valsartan from standard stock solution was added in placebo to attain 80%, 100% and 120% of the sample concentration. Each sample was prepared in triplicate at each level. Blank and standard preparations were injected, and the chromatograms were recorded.
Specificity
Specificity is a procedure to detect quantitatively the analyte in the presence of component that may be expected to be present in the sample matrix. Commonly used excipients in tablet preparation of PVS and Valsartan were spiked in a pre-weighed the quantity of drugs, and then, the absorbance was measured and calculations done to determine the quantity of the drugs.
Robustness
The method was found to be robust, as small but deliberate changes in the method parameters have no detrimental effect on the method performance. Change in flow rate of mobile phase to 1.19 ml/minutes and 1.21 ml/minutes (±10%) or column oven temperature (±5°C absolute) to 35°C and 45°C or organic phase ratio of mobile phase by (±2% absolute) as acetonitrile:water and glacial acetic acid buffer (43:57), acetonitrile:water and glacial acetic acid buffer (47:53) or change in wavelength (±5 nm) to 233 nm and 243 nm and to observe their effect on system suitability.
Detection and quantification limit
LOD and LOQ were calculated by the proposed method which was based on the standard deviation (s) of the response and the slope (S) of the calibration curve at levels approximating the LOD and LOQ,
Fig. 1: Chemical structure of pravastatin sodium
LOD = 3.3 (σ/S) and LOQ = 10 (σ/S).
RESULT AND DISCUSSION Method development
The aim of this study was to develop a simple, accurate, and precise HPLC method for the analysis of the combination of PVS and valsartan using mobile phase and commonly employed Nucleodur C18 column
with UV detector at 238 nm. The typical chromatogram of PVS and valsartan was shown in Fig. 5. The optimal retention time was found to be 4.815 minutes for PVS and 15.518 minutes for valsartan.
Method validation
The described method has been validated for the assay of drugs combination as an active pharmaceutical ingredient. The method was validated for the parameters such as specificity, linearity, LOD, LOQ, accuracy, precision, ruggedness, and robustness [6,7].
Linearity
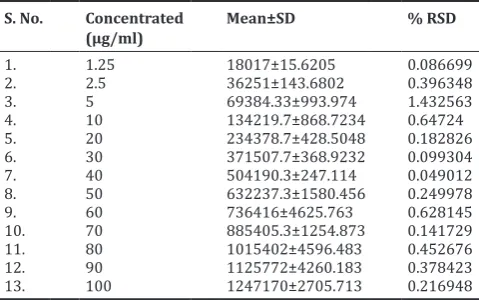
The range of an analytical method is the interval between the upper and lower analytical concentration of a sample where the method has shown to demonstrate acceptable accuracy, precision, and linearity [8]. The linearity was studied by preparing standard solutions at different concentration levels. The linearity of an analytical method is its ability to elicit test results that are directly proportional to the concentration of an analyte in samples within a given range. The linearity of the method was observed in the expected concentration range that demonstrated its suitability for analysis. The calibration curve was carried out and found to be linear in the concentration range of 0.125-10 µg/ml for PVS (Fig. 3) and 1.25-100 µg/ml for valsartan (Fig. 4). The result of linearity for both PVS and valsartan was given in Tables 1 and 2, respectively.
Precision
Precision is a measure of the ability of the method to generate reproducible results. The precision of the method was evaluated using interday, intraday, repeatability, and ruggedness. The % relative standard deviation (RSD) in the case of PVS for interday was found to be 1.405 and intraday was 0.97, whereas for valsartan interday % RSD was
Fig. 3: Linear calibration curve for pravastatin sodium
Fig. 4: Linear calibration curve for valsartan
Table 1: Data derived from linearity experiment of PVS S. No. Concentrated
PVS: Pravastatin sodium, SD: Standard deviation, RSD: Relative standard deviation
Table 2: Data derived from linearity experiment of valsartan S. No. Concentrated
SD: Standard deviation, RSD: Relative standard deviation
Table 3: Data derived from precision experiment for PVS S. No. Concentrated (µg/ml) Peak area
(interday) (intraday) 9. % RSD 1.405363 0.975984
PVS: Pravastatin sodium, SD: Standard deviation, RSD: Relative standard deviation
Accuracy
The accuracy of an analytical method is the closeness in the agreement between the accepted true value or a reference value and the actual result obtained. Accuracy studies are usually evaluated by determining the recovery of a spiked sample of the analyte into the matrix of the sample to be analyzed [9]. The results of accuracy studies are shown in Tables 9 and 10. Results of recoveries and coefficient of variation (% RSD) indicate that the method is accurate within the desired range.
Specificity
Specificity is the ability of a method to discriminate between the analyte of interest and other components that are present in the sample [9,10]. The method demonstrated good separation between the peaks and
Table 4: Data derived from precision experiment for valsartan S. No. Concentrated (µg/ml) Peak area
(interday) (intraday) 9. % RSD 0.433311 0.503474
SD: Standard deviation, RSD: Relative standard deviation
Table 5: Data derived from repeatability experiment for PVS S. No. Concentrated (µg/ml) Area X Assay
1. 5 163,357 4.991767 100.1649 2. 5 162,165 4.955228 100.9035 3. 5 162,048 4.951641 100.9766 4. 5 164,402 5.023799 99.52627 5. 5 161,088 4.922214 101.5803 6. 5 164,048 5.012948 99.74171 7. SD 1289.808
8. Mean 162851.3 9. % RSD 0.792015
PVS: Pravastatin sodium, SD: Standard deviation, RSD: Relative standard deviation
Table 6: Data derived from repeatability experiment for valsartan
S. No. Concentrated (µg/ml) Area X Assay
1. 50 635,362 50.63269 98.75043 2. 50 638,559 50.88778 98.25542 3. 50 632,995 50.44383 99.12015 4. 50 638,195 50.85873 98.31153 5. 50 637,522 50.80503 98.41544 6. 50 636,375 50.71352 98.59305 7. SD 2085.794
8. Mean 636501.3 9. % RSD 0.327697
SD: Standard deviation, RSD: Relative standard deviation
Table 7: Data derived from intermediate precision for PVS
S. No. Concentrated (µg/ml) Area
Analyst 1
PVS: Pravastatin sodium, SD: Standard deviation, RSD: Relative standard deviation
Table 8: Data derived from intermediate precision for valsartan
S. No. Concentrated (µg/ml) Area
Analyst 1
SD: Standard deviation, RSD: Relative standard deviation
Table 9: Data derived from accuracy experiment for PVS
S. No. 80%
PVS: Pravastatin sodium, SD: Standard deviation, RSD: Relative standard deviation
was found to be free of interference. For demonstrating the specificity of the method for drug formulation, the drug was spiked, wherein the excipients used in different formulation products did not interfere with the drug peak and thus the method was specific for the combination of PVS and valsartan. The results are shown in Tables 11 and 12.
Robustness
This was done by small deliberate changes in the chromatographic conditions. The results of robustness study are summarized in Tables 13 and 14, indicating that the method was robust enough that the selected factors remained unaffected by small variations of these parameters.
Detection and quantification limit
The detection limit or LOD is the lowest amount of analyte in a sample that can be detected, but not necessarily quantitated. LOD was expressed as a concentration that gives a signal to noise ratio of 2:1 or 3:1. Quantitation limit or LOQ, on the other hand is the lowest amount of analyte in a sample that can be determined with acceptable precision and accuracy under the stated experimental conditions. LOQ is measured in terms of signal to noise ratio of 10:1. LOD and LOQ
Table 10: Data derived from accuracy experiment for valsartan
S. No. 80%
SD: Standard deviation, RSD: Relative standard deviation
Table 11: Data derived from specificity experiment for PVS
S. No. Concentrated (µg/ml) Area
1. 5 168,727
PVS: Pravastatin sodium, SD: Standard deviation, RSD: Relative standard deviation
Table 12: Data derived from specificity experiment for valsartan
S. No. Concentrated (µg/ml) Area
1. 50 1,889,617
SD: Standard deviation, RSD: Relative standard deviation
Table 13A: Data derived from robustness experiment for PVS: Change in column temperature
S. No. Concentrated
(µg/ml) Temperature35°C 40°C 45°C
1. 5 134,143 160,973 134,454 2. 5 130,635 163,688 130,920 3. 5 133,640 162,239 134,554 4. SD 1896.888 1358.528 2069.827 5. Mean 132806 162300 133309.3 6. % RSD 1.428315 0.837047 1.55265
PVS: Pravastatin sodium, SD: Standard deviation, RSD: Relative standard
Table 13B: Data derived from robustness experiment for PVS: Change in wavelength
S. No. Concentrated (µg/ml) 233 nm 238 nm 243 nm
1. 5 152,983 160,973 143,349 2. 5 151,616 163,688 145,504 3. 5 151,341 162,239 143,715 4. SD 879.439 1358.528 1153.148 5. Mean 151,980 162,300 144189.3 6. % RSD 0.578654 0.837047 0.799746
PVS: Pravastatin sodium, SD: Standard deviation, RSD: Relative standard deviation
Table 13C: Data derived from robustness experiment for PVS: Change in flow rate
S. No. Concentrated
(µg/ml) ml/minutes1.19 1.2 1.21
1. 5 135,139 160,973 135,279 2. 5 138,433 163,688 135,146 3. 5 135,734 162,239 133,418 4. SD 1755.423 1358.528 1038.187 5. Mean 136,435.3 162,300 134,614.3 6. % RSD 1.286634 0.837047 0.771231
PVS: Pravastatin sodium, SD: Standard deviation, RSD: Relative standard deviation
Table 14A: Data derived from robustness experiment for valsartan: Change in column temperature S. No. Concentrated
(µg/ml) Temperature35°C 40°C 45°C
1. 50 641,075 633,691 648,139 2. 50 644,463 630,555 643,485 3. 50 642,519 639,466 640,407 4. SD 1700.138 4520.159 3892.677 5. Mean 642,685.7 634,570.7 644,010.3 6. % RSD 0.264536 0.712318 0.604443
Table 13D: Data derived from robustness experiment for PVS: Change in mobile phase
S. No. Concentrated (µg/ml) 43:57 45:55 47:53
1. 5 113,637 160,973 112,883 2. 5 113,229 163,688 110,866 3. 5 111,800 162,239 111,045 4. SD 964.6307 1358.528 1116.436 5. Mean 112888.7 162300 111598 6. % RSD 0.854497 0.837047 1.000408
were calculated by the equation given in ICH guidelines. This may be
expressed as LOD = 3.3 σ/S and LOQ = 10 σ/S, where σ is the standard
deviation of the response, S is the slope of the calibration curve which may be estimated from the calibration curve of the analyte [9,10]. The LOD and LOQ of the proposed method at 238 nm, for PVS were found
to be 0.04 and 0.14 μg/ml, respectively, shown in Table 15, whereas
0.08 and 0.24 for valsartan. The proposed high performance liquid chromatographic method has been evaluated as per ICH guidelines, parameters such as linearity, precision, accuracy, LOD, LOQ, specificity, and robustness are proved to be convenient for the quality control of PVS and valsartan in combination form [11]. The proposed RP-HPLC method enables the determination of PVS and valsartan because of good separation of chromatographic peaks (Fig. 5). The method can be used successfully for the analysis of PVS and valsartan in combination.
REFERENCES
1. Rang HP, Dale MM, Ritter JN, Flower RJ. Rang and Dale’s Pharmacology. 6th ed. Edinburgh: Churchill Livingstone, Elsevier
Science Ltd.; 2003.
2. Mahley RW, Bersot TP. Drug therapy for hyper-cholesterolemia and dyslipidemia. In: Hardman JG, Limberd LE, editors. Goodman and Gilman’s The Pharmacological Basis of Therapeutics. New York: The
Table 14B: Data derived from robustness experiment for valsartan: Change in wavelength
S. No. Concentrated
(µg/ml) 233 nm 238 nm 243 nm
1. 50 766,465 633,691 534,527
2. 50 764,730 630,555 537,601
3. 50 768,453 639,466 536,359
4. SD 1862.932 4520.159 1546.408
5. Mean 766549.3 634570.7 536162.3
6. % RSD 0.243028 0.712318 0.288422
SD: Standard deviation, RSD: Relative standard deviation
Table 14C: Data derived from robustness experiment for valsartan: Change in flow rate
S. No. Concentrated
(µg/ml) ml/minutes1.19 1.2 1.21
1. 50 649,466 633,691 647,499
2. 50 644,615 630,555 643,960
3. 50 644,755 639,466 642,253
4. SD 2761.199 4520.159 2675.783
5. Mean 646278.7 634570.7 644570.7
6. % RSD 0.427246 0.712318 0.415126
SD: Standard deviation, RSD: Relative standard deviation
Table 14D: Data derived from robustness experiment for valsartan: Change in mobile phase
S. No. Concentrated (µg/ml) 43:57 45:55 47:53
1. 50 642,527 633,691 648,822
2. 50 641,453 630,555 646,365
3. 50 647,809 639,466 646,909
4. SD 3402.248 4520.159 1290.501
5. Mean 643,929.7 634,570.7 647,365.3
6. % RSD 0.528357 0.712318 0.199347
SD: Standard deviation, RSD: Relative standard deviation
Table 15: Characteristics of the analytical method derived from the standard calibration curve S. No. Compound Linearity
(µg/ml) Correlation co‑efficient (R2) Residual standard regression (σ) Slope of regression (S) LOD (µg/ml) LOQ (µg/ml)
1. PVS 0.125-10 0.999 462.0768 32481 0.046946 0.142261 2 Valsartan 1.25-100 0.999 308.7572 12505 0.081479 0.246907
PVS: Pravastatin sodium, SD: Standard deviation, RSD: Relative standard deviation, LOD: Limit of detection, LOQ: Limit of quantification
McGraw Hill, Medical Publishing Division; 2007. p. 984-9.
3. O’ Neil MJ, Smith A, Heckelman PE, Kinneary JF. The Merck Index: An Encyclopedia of Chemicals, Drugs and Biologicals. 14th ed.
New York: Wiley; 2006. p. 1767.
4. Sweetman SC. Matrindale: The Complete Drug Reference. 34th ed.
London, Chicago: Pharmaceutical Press; 2002. p. 1018.
5. Koh KK, Lim S, Choi H, Lee Y, Han SH, Lee K, et al. Combination pravastatin and valsartan treatment has additive beneficial effects to simultaneously improve both metabolic and cardiovascular phenotypes beyond that of monotherapy with either drug in patients with primary hypercholesterolemia. Diabetes 2013;62(10):3547-52.
6. ICH. Q2B. Validation of Analytical Procedures Methodology. In: Proceedings of the International Conference on Harmonization. Geneva; 1993.
7. Sethi PD. HPLC Quantitative Analysis of Pharmaceutical Formulations. 1st ed. New Delhi: CBS Publishers and Distributors; 2001. p. 11-160.
8. Krull I, Swartz M. Validation viewpoint, introduction: National and International Guidelines. LC-GC 1997;15(6):534-39.
9. United States Pharmacopoeia. Validation of Compendial Methods. Rockville, MD: United States Pharmacopoeia Convention; 2007.
11. Plackett RL, Burman JP. Biometrika. 33rd ed; 1943. p. 305- 2511.
.