Development of a fast, objective, quantitative methodology
to monitor angiogenesis in the chicken chorioallantoic
membrane during development
EVA VERHOELST*
,1,2, BART DE KETELAERE
1, VEERLE BRUGGEMAN
2, EDUARDO VILLAMOR
3,
EDDY DECUYPERE
2and JOSSE DE BAERDEMAEKER
11Faculty of Bioscience Engineering, Department of Biosystems, Division of MeBioS, K.U.Leuven, Belgium, 2Faculty of Bioscience Engineering, Department of Biosystems, Division of Livestock-Nutrition-Quality,
K.U.Leuven, Belgium and 3Department of Pediatrics, Maastricht University Medical Center (MUMC+), GROW School for Oncology and Developmental Biology, Maastricht, The Netherlands
ABSTRACT Recent research investigates the role of different gas concentrations during incuba-tion, on chicken growth, quality and health post hatch. One of the parameters of chicken development which changes under different gas concentrations is angiogenesis in the chorioal-lantoic membrane (CAM). To be able to perform large incubation experiments under different conditions, angiogenesis in the whole CAM must be quantified objectively and easily. In this paper, a fast, objective, quantitative methodology to assess changes in the overall vascular development in the CAM of chicken embryos is presented. Samples were taken with minimal disturbance by emptying the egg, so that the CAM stayed attached to the shell, which was then cut in pieces. We employed a commercial digital camera and a macro lens set at 5x magnification to take pictures with sufficient contrast and resolution (2.64 m/pixel). These were processed with computer algorithms to calculate the vascular fraction (VF) and the fractal dimension (FD) automatically on binary images. The ratio of the repeatability and reproducibility variation compared to the parts variation was 0.32 for VF and 0.21 for FD. In a validation experiment (n=284), one group was incubated under hypoxic conditions and the other under normoxic conditions. It was shown that early hypoxia stimulated angiogenesis, while chronic hypoxia impeded growth with significant differences between both groups, which is in accordance with literature data. Thus, we report here a method to asses overall angiogenesis in the CAM under different incubation conditions.
KEY WORDS:
angiogenesis, chicken embryo, CAM, hypoxia, image analysis
Introduction
Current research in the poultry sector is aimed at monitoring the development of the chicken embryo as to optimize the incubation conditions. The fetal origin of adult disease paradigm describes the importance of the conditions during development on health in adult life (Barker, 1995; Gluckman and Hanson, 2004; Ruijtenbeek et al., 2003). Moreover, due to selection for rapid growth and the associated reduction in slaughter age, the embry-onic period becomes a relative greater proportion of the chicken life. The selection in broilers provides a high potential for good quality chickens. However, this is only achieved with good man-agement, not only post hatch but also during the incubation (Collin
BIOLOGY
www.intjdevbiol.com*Address correspondence to: Eva Verhoelst. Division MeBioS, Kasteelpark Arenberg 30 – bus 2456, 3001 Heverlee, Belgium. Fax: +32 (0)1632-8590. e-mail: [email protected]
Accepted: 23 June 2010. Final author corrected PDF published online: 21 January 2011
ISSN: Online 1696-3547, Print 0214-6282
© 2011 UBC Press Printed in Spain
Abbreviations used in this paper: CAM, chorioallantoic membrane; ED, embryonic day; FD, fractal dimension; VF, vascular fraction.
et al., 2007; De Oliveira et al., 2008; Decuypere et al., 2000; Hulet, 2007; Yahav, 2000).
changes under different gas concentrations is the angiogenesis in the chorioallantoic membrane (CAM). This is the organ for gas exchange during most of the embryonic development. It is dem-onstrated that under early hypoxia, the angiogenesis in the CAM increases (Dusseau and Hutchins, 1989). Hypercapnia stimu-lates angiogenesis in different tissues (Irie et al., 2005), however the effect on the angiogenesis in the CAM is still unknown. As the CAM is the organ for gas exchange, differences in angiogenesis may have a major impact on the metabolism of the embryo and subsequently on the growth and health of the embryo.
The CAM is formed when the chorion and allantois fuse around 100 hours of incubation. At day 6 it comes in contact with the inner shell membrane. By day 12, the CAM extends to line the entire surface of the inner shell membrane. The expansion of the CAM capillary network is accompanied by an augmentation in chorio-allantoic artery blood flow, which increases about tenfold during the period from day 9 to day 16 (VanGolde et al., 1997). Finally, the CAM degenerates when lung ventilation is initiated during internal pipping (Ackerman and Rahn, 1981; Tazawa and Whittow, 2000).
Due to the high rates of vascular proliferation that accompa-nies its development, the CAM is probably the most widely used
in vivo assay for studying angiogenesis (Staton et al., 2004). Different methods have already been developed to quantify angiogenesis in the CAM. In the studies for (anti-)angiogenic factors using the CAM, test substances (stimulators or inhibitors)
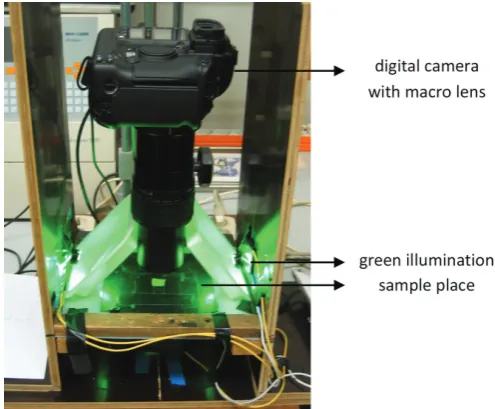
Fig. 2. Measuring configuration. The measuring configuration to take pictures of the CAM is constructed with a high resolution commercial digital camera, an extension tube, a macro lens set at magnification 5x, and green illumination from both sides of the sample at 45 degrees.
Fig. 1. Sample preparation. The emptied eggshell with attached and fixated CAM (A). Division of the eggshell with attached CAM in three bands: A, B and C with C the closest one to the air cell, to allow analysis of local differences in angiogenesis across the egg (B). Division of every band in 8 pieces of 1.5 to 1.5 cm which can be photographed, using a diamond blade mounted on a dremel drill (C,D).
are added to a support, such as a graft or sponge, and placed on the CAM, either in ovo, by the use of a window in the eggshell, or ex ovo (Ribatti et al., 1996; Richardson and Singh, 2003). The first quantifications were based on visual examination of the CAM through the microscope and manual counting of the vessel density, which is subjective and time-consuming (Dusseau and Hutchins, 1989). To overcome these problems, digital cameras mounted on microscopes are used and the vessel density is calculated with the help of computer programs (Kirchner et al., 1996; Parsons-Wingerter et al., 1998). These methods however, are not suitable for application in this research for different reasons. First, all of them make use of a microscope that enlarges the place on the CAM where (anti-)angiogenic agents are applied. However, for the analysis of CAM development under different environmental conditions, spot measurements are not sufficient because they will not be representative for the whole CAM as there may be local differences. Second, the egg should not be disturbed before the actual measurement because every distur-bance, for example making an opening in the eggshell, can affect the normal angiogenesis in the CAM (Romanoff, 1960). Third, the differences due to various environmental stress factors are pos-sibly smaller than in the case of application of (anti-) angiogenic agents, and therefore require a highly sensitive method. Besides a high resolution, it is also a requisite to be able to analyze many samples. Only by analyzing large amounts of samples, the small differences between the groups can be detected over the random variability always present in a group of eggs. For that reason, the sample preparation must be easy and fast.
In this paper, an objective, quantitative methodology to assess endogenous overall vascular development in the CAM of chicken embryos under different incubation conditions is presented. The methodology is evaluated for its reproducibility, repeatability, and validated in one experiment where eggs are incubated under hypoxic conditions from which it is known that it stimulates angiogenesis when induced from incubation day 7 until incuba-tion day 14 (Dusseau and Hutchins, 1989).
B
D
Experimental Protocols
Sample preparation
To keep the sample preparation fast, simple and with mini-mal disturbance of the CAM, sampling is started at embryonic day 11, when the CAM is completely attached to the eggshell (Romanoff, 1960). The eggs are opened at the sharp end so that yolk, albumen and embryo can be removed carefully (Gu et al., 2001). Subsequently the egg is filled with formalin for retention of the erythrocytes in the vessels. After a fixation of 24 hours, the eggs are emptied and divided in 3 bands (A, B, C) which are then each divided in 8 pieces with a diamond blade mounted on a dremel drill (Dremel Multipro, Dremel Europe, Breda, The Netherlands), so that pictures can be taken from every piece of shell with attached CAM (Fig. 1).
Measuring Configuration
Camera
A CANON EOS-1Ds Mark II commercial digital camera with extension tube EF12 II and macro lens MP-E 65mm f/2.8 1-5x (Canon Inc., Tokyo, Japan), set at magnification 5x, is used to take pictures of the vascular network of the pieces shell with attached CAM (Fig. 2). The used resolution of this combination is 2.64 m per pixel, so vessels of 10 m are represented by almost 4 pixels. The framed part of the sample is 4.4 mm to 6.6 mm. The aperture priority setting is chosen and the diaphragm is set at f/16, the smallest possible opening to have the highest possible depth of field. The camera determines automatically the shutter time, which is 8 seconds. Since the set-up is fixed, a relative high shutter time is no problem. The ISO value is set to 100 since higher ISO values result in more noise. A piece of eggshell with CAM, from which the blood has run out the vessels, is chosen as white reference. Correcting in that way the white balance increases the contrast between vessels and background.
Light source
To determine which wavelength results in the highest dis-criminating power between vessels and background, hyperspectral measurements are performed on the samples. The hyperspectral imaging system has four components, namely a transportation plate, two 150 W halogen lamps, an ImSpec V10 spectrograph (Spectral Imaging Ltd, Oulu, Finland) coupled with a standard C-mount zoom lens (Cosmicar H6Z810), and a Hitachi KP-F120 monochrome camera (Hitachi Kokusai Elec-tric Inc., Tokyo, Japan). With this system, spatial as well as spectral information is obtained from the sample. The images of several samples at different wavelengths are compared con-cerning the discriminant power between vessels and back-ground. The intensities at each wavelength measured with the hyperspectral set-up of twenty pixels of blood vessels and twenty pixels of background are tested for significant differ-ences with a t-test allowing for unequal variances. Based on these results, a light source is chosen to enhance the contrast. The samples are illuminated with two Farnell Luxeon Star W/ Optic LED’s of 530 nm (Farnell, Grace-Hollogne, Belgium) which are placed at 45 degrees at each side of the sample. Moreover, this light is made diffuse, which results in a uniform distribution of the light (Fig. 2).
Image processing
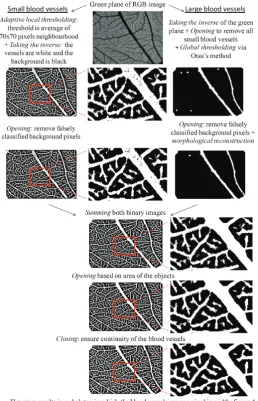
The images are registered as RGB, white balance corrected. To be able to calculate structural parameters of the network automatically, the images are processed by implementing algo-rithms in Matlab software (The Mathworks Inc., Natick, USA). The different tasks aimed at separating the vascular network from the background, are schematized in Fig. 3. As proposed by Blacher S. (2007) a distinction is made between the small and the large vessels, and binary images of both are obtained in a different way, and then combined (Figs. 3 and 4).
Per image, two structural parameters are obtained, namely the
vascular fraction (VF) as a measure of the amount of vessels, using the grid-intersection method, and the fractal dimension (FD) as a measure of the branching degree of the vascular network, using the box-counting method (Kirchner et al., 1996; Parsons-Wingerter et al., 1998; Russ, 2001; Sandau and Kurz, 1997). With the grid-intersection method, the ratio is calculated between the amount of intersections of the vessels with the grid (16x16 pixels box size) placed over the image, and the total amount of possible intersections since these are in fact intersections with the whole membrane and therefore a measure of the total area of the CAM in the image. Moreover this makes the density parameter inde-pendent of the box size. When the grid is chosen too coarse, the estimate of the vascular fraction is not accurate. For box sizes smaller than or equal to 16x16 pixels, the VF remains stable. In the box-counting method a series of grids of decreasing box size overlays the image (p2 = 1282, 642, 322 with p the box size). For each grid, the number of boxes intersected by the structure is counted (N(p)). An estimate of FD is obtained by taking the negative of the least squares regression slope of the plot of log(N(p)) versus log(p) (Kirchner et al., 1996; Parsons-Wingerter
et al., 1998; Sandau and Kurz, 1997). Results are dependent on
the choice of the minimum and maximum box size. Fractals are structures which demonstrate self-similarity to infinity. In nature some structures are ‘fractal-like’, however there are scale bound-aries in which the structure is ‘similar-like’. Since the self-similarity of a natural structure does not repeat until infinity, the smallest scale at which the structure is fractal is determined by the smallest repeating element in the structure. In this case the smallest detectable blood vessels are around 10 m, so 4 pixels in width. The smallest distances between two vessels are around 30 to 100 pixels. When looking at a scale smaller than 30 pixels, there will not be any self-similarity in the structure. On very high scales the fractality will also be lost due to the very few, large blood vessels in the network. The blood vessel network of the CAM is a fractal structure from the scale of 32x32 pixels box size (=84 m) up to the scale of 128x128 pixels box size (=338 m). The R2 of the regression slope of the log-log plot, in this scale range, is higher than 0.98 and consequently confirms the fractality (Kirchner
et al., 1996; Sandau and Kurz, 1997).
Experimental data
Repeatability and reproducibility
The automatic determination of the structural parameters is inherently deterministic, however, the results, as part of a mea-suring system, are subject to measurement error. The different factors which can be a source of undesired, but not excludable, variation are the operator, noise of the camera sensor, manual focus variations, and position of the sample under the camera. System capability studies express the precision of the system as a variance or standard deviation of the measurement error, which is modeled as the sum of the repeatability and the reproducibility (R&R) (Borror et al., 1997). To calculate the reproducibility and repeatability of the new methodology, three persons measure 14 randomly chosen samples, each 4 times, to measure the possible variations under the same conditions.
Validation
Besides defining the precision of a new measurement system, the accuracy of the system should be evaluated. Since there does not exist a golden standard to quantify the angiogenesis, the accuracy can not be determined. Whereas only the differences between groups have to be investigated, it is not necessary to know the absolute, true values. However, it is still necessary to ensure the validity of the methodology, with or without a system-atic bias. Therefore, a group of 120 White Leghorn eggs, from the same flock, are incubated in two incubators with the same conditions of temperature and relative humidity (T=37.8C and RH=45%) but different oxygen concentrations. Control embryos are incubated under normoxic conditions (21%O2, 0.03% CO2). Experimental embryos are incubatedunder normoxic conditions until embryonic day (ED) 5 when eggsare transferred to a second incubator where hypoxic conditions (15.0 0.3% atmosphericO2, 0.03% CO2) are maintained by providing a constant flow of N2 and compressed air with a flow meter, as previously described (Zoer
et al., 2009). The O2 and CO2 concentrations in the incubator are monitored with a DrDAQ O2 sensor (Pico Technology, United Kingdom) and an infrared CO2 analyzer (Beckman Instruments, Inc., Fullerton, U.S.A.). Per group 20 eggs, randomly selected from all eggs, are analyzed on ED11, 14 and 16. These results will be compared with data from literature.
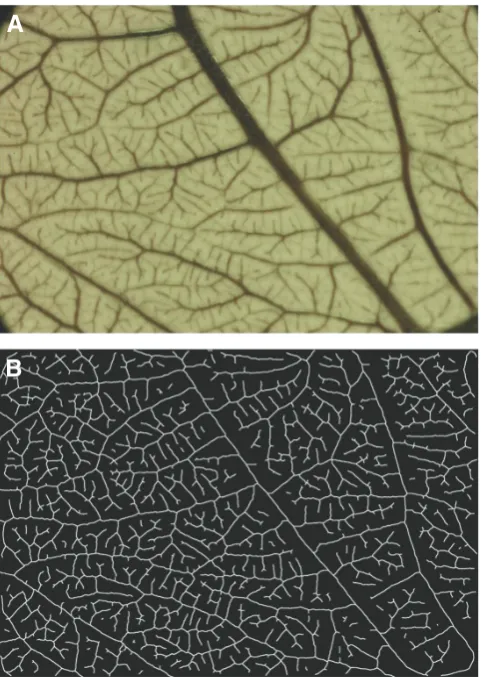
Fig. 4. Original picture and final binary skeleton image used for structural analysis. An original picture of a sample of embryonic day (ED) 15 (A)and the according binary image of the skeleton of the vascular network (B) obtained after the different image processing steps ex-plained in Fig. 3. On this skeleton the two structural parameters can be calculated.
Results
Light source test
The wavelengths from 450 nm to 590 nm, the blue and green region of the spectrum, give the highest significant differences between a group of pixels belonging to the background and a group of pixels belonging to the blood vessels (Fig. 5). Consider-ing these results, the fact that commercial cameras with a Bayer color filter are most sensitive to green light and the availability of Farnell Luxeon Star W/Optic LED’s (Farnell In One), with high intensities, a LED with dominant wavelength at 530 nm is chosen.
Evaluation of the new methodology: reproducibility and repeatability
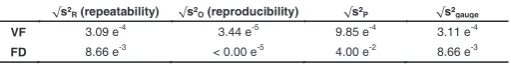
The reproducibility and repeatability analysis as described above (n=168) results in a model where the interaction between parts and operator is not significant. The variance components are represented in table 1. Since there is no interaction, the variance component estimate for reproducibility is the same as the variance component due to the operator. The ratio of the R&R variation compared to the parts variation is 0.32 for VF and 0.21 for FD, and to the total variation 0.30 for VF and 0.21 for FD. Statistics
Repeatability and reproducibility
For the reproducibility and repeatability calculation, the classi-cal gauge R&R is determined via a mixed model, built for the measurements Xijk, so that the effects can be defined as random factors (Borror et al., 1997):
Xijk = + Pi + Oj + (OP)ij + Rk(ij)
With i = 1,2,…,p, j = 1,2,.,o, k = 1,2, …,n, P, the effect of Parts (the samples), O, the effect of the Operator, OP, the effect of the interaction between Operator and Part, R, the Replication of measurements, and , the overall mean. The reproducibility is defined as the sum of the estimates of the variation due to the operators and due to the interaction of operator and part:
s2
reproducibility = (s2O + s2OP) with s, the estimate of .
The repeatability is estimated by the variation due to error, in other words, the residual variance in the model:
s2
repeatability = s2R
The total gauge variation estimate is given by the sum of the repeatability and reproducibility:
s2
gauge =(s2repeatability + s2reproducibility)
The total variation estimate is given by the sum of the gauge R&R and the part variation:
s2
total = (s2gauge + s2P)
For all analyses, SAS 9.2 is used (SAS Institute Inc., Cary, North Carolina, USA).
Validation
In the validation experiment, the structural parameters are calculated for each band (A, B and C) by taking the average of the 8 pieces of each band. To compare the structural parameters between the groups (hypoxia and control), and bands (A, B and C), an ANOVA model is built per parameter, treating group, band, embryonic day (ED) and their interactions as possible categorical independent variables. A hierarchical variable selection is per-formed to eliminate non-significant higher order interactions terms. The following possible differences are tested: differences be-tween groups globally, bebe-tween bands globally, bebe-tween groups per day, between bands per day and between the embryonic days. All statistical analysis is performed with SAS9.2 (SAS Institute Inc., Cary, North Carolina, USA).
Fig. 5. Illumination optimization. To optimize the processing of the images of the CAM, different wavelengths are examined concerning their discriminant power between background and blood vessels. In the figure, the p-values in function of the wavelength are presented which result from a t-test between the intensities at different wavelengths of a group of pixels belonging to the background and a group of pixels belonging to blood vessels.
Fig. 6. Hypoxia versus normoxia. Mean vascular fraction (A) and fractal dimension (B) of the vascular network of the CAM in function of the embryonic day, for embryos incubated under hypoxic (hypoxia) and normal conditions (control) with standard deviation bars (n=284). Differ-ent letters indicate significant differences (=0.01).
A
Validation of the new methodology: hypoxia vs. control In the model for the VF (n=284) as well as for the FD (n=284), built as described in the materials and methods section, group, ED, their interaction and band are important as independent variables. With these models the difference between the groups and bands is tested globally over all the ED’s and per ED (Fig. 6). Both parameters increase from ED 11 to ED 16. Globally there is no significant difference between the groups. However, on ED 14 VF and FD are significantly higher (p = 0.0003 and 0.0011 respectively) for the eggs incubated under hypoxic conditions (Fig. 6). On ED 16 the control group shows significantly higher VF and FD than the hypoxia group (p <.0001 for both parameters). There is no interaction between band and ED. Overall, both parameters of band C, the closest one to the air cell, are signifi-cantly higher than those of band A, the farthest one to the air cell (p = 0.0015 for the VF and p = 0.0002 for the FD). The FD also differs globally between band C and B (p = 0.009). In the control group both parameters are significantly higher at ED 16 as compared to ED 14 (p <.0001), and at ED 16 as compared to ED 11 (p <.0001) (Fig. 6). The FD is also significantly higher at ED 14 as compared to ED 11 (p = 0.007). For the hypoxia group on the other hand, both parameters are significantly higher at ED 14 as compared to ED 11 (p <.0001), and at ED 16 as compared to ED 11 (p = 0.0036 for VF and p = 0.001 for FD). In this group, there is no significant difference between ED 16 and ED 14. The values (mean standard deviation) for VF and FD range, respectively from 0.0137 0.0003 and 1.6161 0.0109 on ED 11 to 0.0168 0.0003 and 1.7325 0.0095 on ED 16 for the control group, and from 0.0137 0.0003 and 1.6171 0.0119 on ED 11 to 0.0149 0.0002 and 1.6654 0.0081 on ED 16 for the hypoxia group.
Discussion
Advantages of the methodology presented
The results described above show that it is possible to quantify endogenous overall vascular development in the CAM and detect differences due to different environmental conditions. The meth-odology developed fulfils specific requirements for this kind of research concerning sample preparation, measuring configura-tion and image processing. The eggs are only handled on the moment of sampling and the latter is also done with minimal disturbance of the CAM. As one spot will not be representative for the whole CAM, different samples of one CAM are taken by dividing the eggshell with attached CAM in three bands, each consisting of 8 pieces which are all measured. To visualize the micro vessels of the CAM a sufficiently high actual resolution should be achieved, which is a combination of the resolution of the camera and the used magnification. The cameras mounted on microscopes have relatively low resolution (e.g. 1200 x 1600
pixels) compared to commercial cameras (e.g. 4992 x 3328 pixels). By the enlargement of the microscope it is still possible to see small vessels, but at the cost of the area pictured, which becomes very small. The high actual resolution (2.64 mm/pixel), combined with the large area pictured (4.4 mm x 6.6 mm) described in this paper, is achieved by the use of a commercial high resolution digital camera, a macro lens which magnifies 5 times, and an extension tube. Both macro lens and extension tube decrease the minimal focus distance (i.e. the distance between the object and the sensor) so that a small object can be photo-graphed from a small distance to obtain a frame filling image of the object. Subsequently, with the set-up as described, fewer images have to be taken from one sample to obtain the same information as with a camera mounted on a microscope, and still a very high resolution is achieved. The digital pictures are processed to become binary images in which the vessels and the background are well separated. By illuminating with wavelengths for which the discriminating power between object and background is large, the thresholding ameliorates. At last, since every part of the devel-oped measuring system, namely the sample preparation, the photographing of the samples and the analysis, is fast and less-labor intensive than the existing techniques, it is possible to analyze the large amount of data necessary for this kind of research. From the egg to the final pictures of the 24 different pieces, it takes 18 minutes of labor (the overnight fixation time excluded). Another 12 minutes are necessary to process the images but this is performed completely automatically.
Capability and validity of the methodology presented By making most of the methodology automatic, the variation is reduced to a minimum. The results obtained in the validation experiment agree with those from literature. Both parameters, VF and FD, increase with the embryonic day in the control group until somewhere between ED 14 and 16 since no measurements are performed in between those days. These results can be explained by the normal development of the embryo and associated angio-genesis in the CAM to ensure the gas exchange of the embryo with the environment (Romanoff, 1960). Tazawa and Whittow (2000) describe an increase in oxygen diffusing capacity of the CAM until day 16-18. Strick et al. (1991) demonstrate an increase in vessel endpoint density until day 16-18.
Hypoxia has a stimulating effect on angiogenesis in the CAM when applied from day 7 to 14 (Dusseau and Hutchins, 1989). In the performed experiment values for VF and FD are significantly higher on ED 14 for the group incubated under hypoxic conditions compared to normoxic conditions.
The differences between the bands are the same between both groups and can be explained by the normal development of the CAM. The allantois is formed as an appendage of the hind gut. Around ED 4 the allantois fuses with the chorion. It first grows over the embryo and later on to the sharp end of the egg. The differences between the bands, as described in the results, seem to reflect this way of growth. At the blunt end of the egg, the vascular network in the CAM is significantly higher developed than at the sharp end, which is the latest to develop (Romanoff, 1960).
Complexities on the influence of hypoxia
In contrast with the results at ED 14, on ED 16, the eggs √s²R (repeatability) √s²O (reproducibility) √s²P √s²gauge
R, square root of the residual variation (repeatability), s2O , square root of the operator
variation (reproducibility), s2
incubated under normoxic conditions show a significantly higher developed vascular network than those under hypoxic conditions. The CAM arrested its growth after ED 14 for the hypoxia group, which is in accordance with Ruijtenbeek et al. (2003) who found that chronic hypoxia has a negative impact on growth and birth weight.
Most likely there is a compensating growth of the blood vessels in the CAM in response to early hypoxia. Hypoxia is a well-known stimulator for angiogenesis, as described in tumor research. It affects angiogenesis through different molecular factors. The most important one is the hypoxia-inducible factor-1 (HIF-1), which upregulates, amongst others, the formation of vascular endothelial growth factor (VEGF), the most studied angiogenesis stimulator (Bradbury, 2001). By increasing the angiogenesis, and so improving the oxygen uptake, the embryo adapts to the hypoxic conditions. However, when the hypoxic conditions are maintained longer, the embryo seems not to be able to cope. The ambient oxygen amount becomes insufficient, affecting the metabolism of the embryo, and eventually its growth, and in accordance the development of the CAM.
Future perspectives
All results are in line with literature data, and therefore support the validity of the measurement system. Hence, it can now be used to analyze the effects of different incubation conditions on the angiogenesis in the CAM, which can be correlated with post hatch performance in further research. Ideally, non-destructive measurement systems must be developed to monitor these changes throughout embryonic development and post hatch growth. This methodology may serve as a reference when devel-oping such a non-destructive technique. In general, it may help to improve the understanding of the biology of incubation and avian embryonic development.
From studies on developmental origins of health and disease, it is shown that lower birth weight is a predisposition to cardiovas-cular and metabolic diseases in adult life (Barker, 1995). Chronic hypoxia during prenatal development is one of the possible factors which will lead to intrauterine growth retardation and influence the susceptibility to cardiovascular diseases (Ruijtenbeek
et al., 2003). Even without long-term hypoxic incubation condi-tions, the chicken embryo may suffer from a period of critical hypoxia in the second half of the incubation. Rahn et al. (1979) demonstrate that, although the embryo grows, the oxygen uptake reaches a plateau from around ED 15 onwards until internal pipping. This may lead to hypoxic conditions and therefore a higher susceptibility to ascites by triggering structural changes in the heart (Decuypere et al., 2000; Villamor et al., 2004). Ascites is a syndrome related to cardiovascular and pulmonary ailments, and the main cause of non-infectious mortality in the broiler sector, leading to economic losses and animal welfare problems. On the other hand, hypoxia during early embryonic development stimulates angiogenesis (see above), and hence the oxygen diffusive capacity of the CAM (Tazawa and Whittow, 2000). Consequently the limited oxygen uptake during the described plateau phase may be increased. This leads to the hypothesis that the changes early antenatal under influence of temporal hypoxia, possibly make the critical hypoxia later in the incubation less severe, and so lower the ascites sensitivity. This hypothesis can be considered in future research.
Besides in the poultry research itself, this methodology might be useful in more general physiology studies. The chicken em-bryo is often used as a model to investigate the different mecha-nisms in the developmental origins of health and disease in humans, since early development of mammalian and bird em-bryos is very similar. The advantage of working with chicken embryos is the feasibility of development independent of the mother, in incubators in which the environmental parameters can be controlled (Ruijtenbeek et al., 2003). This methodology might be useful in for example studies investigating the mechanisms of placental hyperoxia which causes intrauterine growth retardation (Ancar and Chardonnens, 2003).
At last, it can be used, aside from the existing CAM assays, in the angiogenesis research domain. With this technique, it is not possible to place grafts or sponges on the CAM. However, the developed method is appropriate to investigate angiogenesis under different conditions, such as hypoxia, hypercapnia, hyperoxia, and malnutrition.
Acknowledgements
The authors would like to acknowledge the Institute for the Promotion of Innovation through Science and Technology in Flanders (IWT-Vlaanderen) for their financial support. B. De Ketelaere is supported by the Industrial Research Fund (Industrieel Onderzoeksfonds, IOF) of the K.U.Leuven. Special thanks also go to V. Vandenheede, B. Kamers, and L. De Smit for their technical assistance.
References
ACKERMAN, R.A. and RAHN, H. (1981). In vivo O-2 and water-vapor permeability of the hens eggshell during early development Respir Physiol 45: 1-8. BARKER, D.J.P. (1995). Intrauterine Programming of Adult Disease. Mol Med
Today 1: 418-423.
BLACHER, S. (2007). Image Processing and Measurements in the Material Sciences and Biology. Workshop on Multivariate Imaging Analysis, Gembloux, Belgium.
BORROR, C.M., MONTGOMERY, D.C. and RUNGER, G.C. (1997). Confidence intervals for variance components from gauge capability studies. Qual Reliab Eng Int 13: 361-369.
BRADBURY, J. (2001). Breathing hard to keep up with HIF-1. Lancet 358: 1704-1704.
COLLIN, A., BERRI, C., TESSERAUD, S., RODON, F.E.R., SKIBA-CASSY, S., CROCHET, S., DUCLOS, M.J., RIDEAU, N., TONA, K., BUYSE, J. et al. (2007). Effects of thermal manipulation during early and late embryogenesis on thermotolerance and breast muscle characteristics in broiler chickens. Poult Sci
86: 795-800.
DE OLIVEIRA, J.E., UNI, Z. and FERKET, P.R. (2008). Important metabolic pathways in poultry embryos prior to hatch. Worlds Poult Sci J 64: 488-499. DE SMIT, L., BRUGGEMAN, V., TONA, J.K., DEBONNE, M., ONAGBESAN, O.,
ARCKENS, L., DE BAERDEMAEKER, J. and DECUYPERE, E. (2006). Embry-onic developmental plasticity of the chick: Increased CO2 during early stages of incubation changes the developmental trajectories during prenatal and postnatal growth. Comp Biochem Physiol A Mol Integr Physiol 145: 166-175. DECUYPERE, E., BUYSE, J. and BUYS, N. (2000). Ascites in broiler chickens: exogenous and endogenous structural and functional causal factors. Worlds Poult Sci J 56: 367-377.
DUSSEAU, J.W. and HUTCHINS, P.M. (1989). Microvascular Responses to Chronic Hypoxia by the Chick Chorioallantoic Membrane - a Morphometric Analysis. Microvasc Res 37: 138-147.
GLUCKMAN, P.D. and HANSON, M.A. (2004). Living with the past: Evolution, development, and patterns of disease. Science 305: 1733-1736.
factor and stimulate angiogenesis. Am J Physiol Regul Integr Comp Phsyiol
281: R365-R372.
HULET, R.M. (2007). Managing incubation: Where are we and why? Poult Sci 86: 1017-1019.
IRIE, H., TATSUMI, T., TAKAMIYA, M., ZEN, K., TAKAHASHI, T., AZUMA, A., TATEISHI, K., NOMURA, T., HAYASHI, H., NAKAJIMA, N. et al. (2005). Carbon dioxide-rich water bathing enhances collateral blood flow in ischemic hindlimb via mobilization of endothelial progenitor cells and activation of NO-cGMP system. Circulation 111: 1523-1529.
KIRCHNER, L.M., SCHMIDT, S.P. and GRUBER, B.S. (1996). Quantitation of angiogenesis in the chick chorioallantoic membrane model using fractal analy-sis. Microvasc Res 51: 2-14.
PARSONS-WINGERTER, P., LWAI, B., YANG, M.C., ELLIOTT, K.E., MILANINIA, A., REDLITZ, A., CLARK, J.I. and SAGE, E.H. (1998). A novel assay of angiogenesis in the quail chorioallantoic membrane: Stimulation by bFGF and inhibition by angiostatin according to fractal dimension and grid intersection.
Microvasc Res 55: 201-214.
RAHN, H., AR, A. and PAGANELLI, C.V. (1979). How Bird Eggs Breathe. Sci Am
240: 46-55.
RIBATTI, D., VACCA, A., RONCALI, L. and DAMMACCO, F. (1996). The chick embryo chorioallantoic membrane as a model for in vivo research on angiogen-esis. Int J Dev Biol 40: 1189-1197.
RICHARDSON, M. and SINGH, G. (2003). Observations on the Use of the Avian Chorioallantoic Membrane (CAM) Model in Investigations into Angiogenesis. -Curr Drug Targets Cardiovasc Haematol Disord 3: 155-185.
ROMANOFF, A.L. (1960). The Avian Embryo. The Macmillan Company, New York. RUIJTENBEEK, K., KESSELS, L., DE MEY, J.G.R. and BLANCO, C.E. (2003). Chronic moderate hypoxia and protein malnutrition both induce growth retarda-tion, but have distinct effects on arterial endothelium-dependent reactivity in the
chicken embryo. Pediatr Res 53: 573-579.
RUSS, J.C., DEHOFF, R.T. (2001). Practical Stereology. Plenum Press., New York. SANDAU, K. and KURZ, H. (1997). Measuring fractal dimension and complexity
-An alternative approach with an application. Journal of Microscopy-Oxford 186: 164-176.
STATON, C.A., STRIBBLING, S.M., TAZZYMAN, S., HUGHES, R., BROWN, N.J. and LEWIS, C.E. (2004). Current methods for assaying angiogenesis in vitro
and in vivo. Int J Exp Pathol 85: 233-248.
STRICK, D.M., WAYCASTER, R.L., MONTANI, J.P., GAY, W.J. and ADAIR, T.H. (1991). Morphometric measurements of chorioallantoic membrane vascularity - effects of hypoxia and hyperoxia Am J Physiol 260: H1385-H1389. TAZAWA, H. and WHITTOW, G.C.(2000). Incubation Physiology. In Sturkie’s
Avian Physiology. Academic Press, San Diego, pp.617-634.
VANGOLDE, J., MULDER, T. and BLANCO, C.E. (1997). Changes in mean chorioallantoic artery blood flow and heart rate produced by hypoxia in the developing chick embryo. Pediatr Res 42: 293-298.
VILLAMOR, E., KESSELS, C.G.A., RUIJTENBEEK, K., VAN SUYLEN, R.J., BELIK, J., DE MEY, J.G.R. and BLANCO, C.E. (2004). Chronic in ovo hypoxia decreases pulmonary arterial contractile reactivity and induces biventricular cardiac enlargement in the chicken embryo. Am J Physiol Regul Integr Comp Phsyiol 287: R642-R651.
WALSBERG, G.E. (1980). The Gaseous Microclimate of the Avian Nest during Incubation. Am Zool 20: 363-372.
YAHAV, S. (2000). Domestic fowl - Strategies to confront environmental conditions.
Avian Poul Biol Rev 11: 81-95.
Further Related Reading, published previously in the Int. J. Dev. Biol.
See our recent Special Issue Placenta edited by Joan S. Hunt and Kent L. Thornburg at: http://www.ijdb.ehu.es/web/contents.php?vol=54&issue=2-3
Insulin-like growth factor-2 regulates early neural and cardiovascular system development in zebrafish embryos
Lori Hartnett, Catherine Glynn, Catherine M. Nolan, Maura Grealy and Lucy Byrnes Int. J. Dev. Biol. (2010) 54: 573-583
The seminal work of Werner Risau in the study of the development of the vascular system
Domenico Ribatti
Int. J. Dev. Biol. (2010) 54: 567-572
Estrogen regulation of placental angiogenesis and fetal ovarian development during primate pregnancy
Eugene D. Albrecht and Gerald J. Pepe Int. J. Dev. Biol. (2010) 54: 397-407
Uteroplacental vascular development and placental function: an update
Lawrence P. Reynolds, Pawel P. Borowicz, Joel S. Caton, Kimberly A. Vonnahme, Justin S. Luther, David S. Buchanan, Shireen A. Hafez, Anna T. Grazul-Bilska and Dale A. Redmer Int. J. Dev. Biol. (2010) 54: 355-365
Gene expression in the placenta: maternal stress and epigenetic responses
Ciprian P. Gheorghe, Ravi Goyal, Ashwani Mittal and Lawrence D. Longo Int. J. Dev. Biol. (2010) 54: 507-523
Placental metabolic reprogramming: do changes in the mix of energy-generating substrates modulate fetal growth?
Nicholas P. Illsley, Isabella Caniggia and Stacy Zamudio Int. J. Dev. Biol. (2010) 54: 409-419