Coseismic deformation due to the 2007 Chuetsu-oki earthquake (
M
w=
6.8)
Yosuke Aoki1, Masato Furuya2, and Teruyuki Kato1
1Earthquake Research Institute, University of Tokyo, Tokyo 113-0032, Japan
2Department of Natural History Sciences, Hokkaido University, Kita-ku, N10W8, Sapporo 060-0810, Japan
(Received December 19, 2007; Revised June 7, 2008; Accepted June 9, 2008; Online published November 18, 2008)
Global Positioning System (GPS) and Synthetic Aperture Radar Interferometry (InSAR) detected substantial ground deformation due to the 2007 Chuetsu-oki earthquake (Mw=6.8); GPS observation detected a horizontal
deformation of up to about 170 mm and subsidence of up to 30 mm, and InSAR detected up to 290 mm of line-of-sight changes. A fault model is proposed to fit the ground deformation field as well as the aftershock distribution. Our model shows that a northwest-dipping fault to the north and a southeast-dipping fault to the south, consistent with the aftershock distribution, fits well with the observed data. However, our model also suggests that the modeled faults are likely to extend to shallower depths, where aftershocks are terminated. Combining our model with the subsurface structure suggests that the earthquake rupture initiated at depth and propagated into shallower depths that are not capable of nucleating an earthquake because of the presence of unconsolidated sediments. Key words:Coseismic deformation, Global Positioning System, Synthetic Aperture Radar, Interferometry.
1.
Introduction
Geodetic data have been widely used to detect and ex-plore details of ground deformation associated with large earthquakes and their afterslips. In particular, the emer-gence of the continuous Global Positioning System (GPS) network allows us to delineate the deformation field due to earthquakes with high spatial as well as temporal resolution (e.g., Segall and Davis, 1997). Furthermore, synthetic aper-ture radar interferometry (InSAR) gives us further enhanced spatial resolution of ground deformation (e.g., B¨urgmann et al., 2000). In particular, the launch of the ALOS satel-lite yields L-band synthetic aperture radar (SAR) images from PALSAR (Phased Array type L-band Synthetic Aper-ture Radar), allowing much better coherence than those im-aged from C-band satellites even in heavily vegetated re-gions, such as Japanese islands, where C-band satellites do not work well (Rosenqvistet al., 2007). Geodetic data pro-vide an independent estimate of fault slip distribution from that inferred from analyses of seismic waves. A compari-son of these two data sets enables the detection of slipped areas during an earthquake without radiating seismic waves, thereby gaining more insights into regional seismic hazard assessment. Here, we propose a fault model for the coseis-mic deformation field associated with the 2007 Chuetsu-oki earthquake (Mw=6.8), using continuous GPS and L-band
InSAR data. While our model is derived with a reference to the detailed aftershock data published by Katoet al.(2008), the geodetic data show that the fault slip area extends to shallower depths where no aftershocks were detected.
The Chuetsu-oki earthquake occurred on July 16, 2007 near a diffuse plate boundary between the Eurasian and
Copyright cThe Society of Geomagnetism and Earth, Planetary and Space Sci-ences (SGEPSS); The Seismological Society of Japan; The Volcanological Society of Japan; The Geodetic Society of Japan; The Japanese Society for Planetary Sci-ences; TERRAPUB.
North American (or Okhotsk) plates (Fig. 1) with a relative convergence rate of approximately 10 mm/yr (e.g., Hekiet al., 1999). The continuous GPS network shows that the region is characterized by diffuse east-west compression (Sagiyaet al., 2000), although vertical deformation is in-significant (Aoki and Scholz, 2003). The region has experi-enced several large earthquakes including the 1964 Niigata earthquake (M =7.5; e.g., Ruff and Kanamori, 1983) and the 2004 Mid Niigata Prefecture earthquake (M =6.8; Hi-rata, 2005), both of which have thrust focal mechanisms, consistent with the regional tectonic setting there.
The subsurface structure in the focal area of the Chuetsu-oki earthquake is known to be complicated from previous studies. It is characterized by active folding and a thick sedimentary layer. High-resolution seismic tomography re-veals that seismic velocities at depths shallower than 8 km are anomalously slow in the focal area of the 2004 Mid Ni-igata Prefecture earthquake, 40 km southeast of that of the Chuetsu-oki earthquake (Katoet al., 2006). Also, Sato and Kato (2005) found an active folding structure in the focal area of the 2004 Chuetsu earthquake. This type of subsur-face structure may complicate the regional stress field, re-sulting in a complex signature of seismic activity. Indeed, Katoet al.(2007, 2008) showed that the aftershock distri-bution associated with both the Mid Niigata Prefecture and Chuetsu-oki earthquakes does not represent a single plane, implying that multiple fault planes are responsible for gen-erating both of these earthquakes. Katoet al.(2008) pre-cisely relocated aftershocks of the Chuetsu-oki earthquake, suggesting that two conjugate fault planes are responsible; they also suggest that a northwest-dipping fault is respon-sible in the northern part, near the hypocenter and that a southeast-dipping fault is responsible to the south. We will model the observed deformation field with reference to the aftershock distribution derived from dense temporally
0 50 km
EUR NAM (OKH)
10 mm/yr
1964 Niigata
2004 mid Niigata Pref.
2007 Chuetsu-oki
Fig. 1. Tectonic setting of the focal area of the 2007 Chuetsu-oki earth-quake and its vicinity. Notable earthearth-quakes in the area for the last 50 years are appended with their focal mechanisms. EUR, NAM, and OKH represent the Eurasian, North American, and Okhotsk plates, respec-tively.
mic observations (Katoet al., 2008).
2.
Data
We used GPS and InSAR data in the analysis. This section provides some details of these data.
2.1 GPS
The Geographical Survey Institute of Japan operates a continuous GPS network in the Japanese islands (Sagiya, 2004). Each GPS site samples data every 30 s and calculates the coordinate once a day. We took a 5-day average of the coordinate of each site before (July 11–15, 2007) and after (July 17–21, 2007) the earthquake, and the difference of these two is used as coseismic deformation. There are 45 GPS sites in the area, but two sites near the epicenter were removed from the analysis because GSI announced that the data from these sites are perturbed by local deformation due to the earthquake shaking. We therefore used 43 GPS sites in the present analysis.
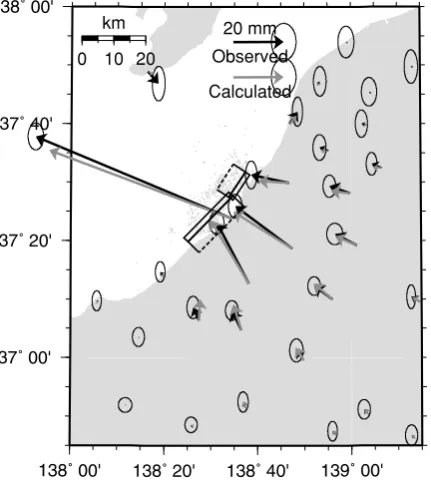
Figure 2 shows the horizontal coseismic deformation field. Most of the GPS sites move northwestward, consis-tent with the thrust faulting mechanism inferred from seis-mic wave analysis (e.g., Hikima and Koketsu, 2007). The observed displacement is larger near the epicenter, up to 170 mm. The vertical deformation was also observed with a maximum subsidence of about 30 mm near the coast, which is also consistent with a deformation field produced by a thrust earthquake.
Uncertainties of each component of each site are esti-mated by the repeatability of daily solutions between July 1 and 15, 2007. We did not assume a correlation between components nor sites. Typical values of uncertainties are 2, 4, and 10 mm for the east, north, and vertical components, respectively.
0 10 20
km 20 mm
Observed
Calculated
Fig. 2. Comparison of observed (black) and calculated (gray) horizontal displacements of continuous GPS sites. Error ellipses denote 95% confidence bounds of the horizontal deformation. Modeled faults are denoted by thick and dashed lines, where dashed lines represent the bottom of the faults. Epicenters of aftershocks (Katoet al., 2008) are also shown by gray dots.
2.2 InSAR
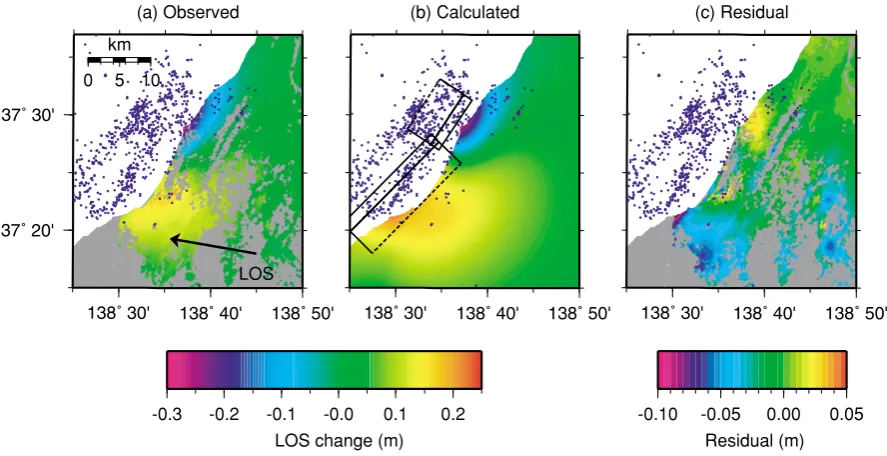
Two PALSAR images taken on January 16 and July 19, 2007, respectively, both with the FBS (fine beam single) mode, were used to generate a coseismic InSAR image, whose perpendicular baseline was 297 m around the mid-dle of the image. These images are taken from the descend-ing orbit, thus the line-of-sight (LOS) is from N100.11◦E, as shown in Fig. 3(a). The incidence angle is 38.78◦ from vertical. Thus, the LOS change d L is given by d L =
−0.6167ue+0.1099un−0.7795uv, whereue,un, anduv
represent the east, north, and vertical component of the dis-placement, respectively. The orbit of the satellite was re-fined using the unwrapped interferogram and the Digital El-evation Map to increase the reliability of our result in longer wavelengths. Although there are several images taken from the ascending orbit which could better constrain the defor-mation field when combined with the images from the de-scending orbit, we did not use them in the present analy-sis in order to reject a possible contribution from postseis-mic deformation. Because the deformation field taken from a different orbit could well constrain the fault model, the images taken from the ascending orbit should be used in a future study after separating postseismic deformation from the observed deformation field.
re-0 5 10 km
LOS
-0.3 -0.2 -0.1 -0.0 0.1 0.2 LOS change (m)
(a) Observed (b) Calculated
-0.10 -0.05 0.00 0.05 Residual (m) (c) Residual
Fig. 3. (a) Observed line-of-sight (LOS) changes with epicenters of aftershocks (Katoet al., 2008) shown by blue dots. The direction of LOS is shown by a black vector. (b) Calculated LOS changes with aftershock distribution (Katoet al., 2008) and modeled faults with black solid and dashed lines, where dashed lines represent the bottom of the faults. (c) Difference between observed and calculated LOS changes with aftershock distribution (Katoet al., 2008). Note that the color scale is different from the other two panels.
duction of coherence is generally due to a change in sur-face properties, the low coherence inland is due to snow-fall in the master image (January 16). The areas of low coherence near the focal region, where snow falls less fre-quently (Shoji and Kitaura, 2006), is likely due to liquefac-tion by the strong moliquefac-tion, consistent with on-site observa-tions (e.g., Cyranoski, 2007; Normile, 2007).
As the interferogram of the two images mentioned above has 9 million points, resulting in computational difficulty when all the data are employed in the analysis, we need to reduce the number of data points without losing signif-icant information. We employed the quadtree decompo-sition method (e.g., Samet and Webber, 1988), which has also been used in the InSAR data analysis (J´onssonet al., 2002). The quadtree decomposition divides the scene into four quadrants, and the mean and standard deviation of each quadrant are then calculated. If the standard deviation ex-ceeds the specified threshold (20 mm in this case), the quad-rant is further divided into four quadquad-rants, and the process is iterated until the standard deviation is within the thresh-old. This process resulted in 262 data points representing the interferogram. The main objective of this process is that the data points are denser in areas of the high spatial LOS gradient. Note that the minimum spacing of the data points is about 100 m.
Uncertainties of LOS displacements inferred from the in-terferogram are hard to assess. The error and its spatial cor-relation in InSAR data are controlled by various factors, in-cluding the baseline length of the orbit pair and atmospheric disturbance, but how they contribute to the error is enig-matic. Here we take the error to be 20 mm, and no spatial correlation is assumed, although the error in InSAR data is obviously spatially correlated (e.g., Lohman and Simons, 2005). We neglect the spatial correlation in this study to simplify the calculation and because the deformation
sig-nal is so large that spatially correlated error does not play a significant role in the data analysis.
3.
Modeling
Here we attempt to model the observed deformation field assuming rectangular faults with uniform slip in each fault in an elastic, homogeneous, and isotropic halfspace. We es-timate length, width, depth at the top, dip angle, strike, hor-izontal position (two parameters), and amount of slip (strike and dip components) for each fault to best fit the observed deformation. Given these parameters, the deformation field is calculated by Green’s function of Okada (1985). Because of the nonlinear relationship between the fault parameters and deformation field, we need to solve a nonlinear opti-mization problem. Here we employed the Simulated An-nealing inversion (Basu and Frazer, 1990), which has been applied to geodetic inversions (e.g., Cervelliet al., 2001) to find the optimum model parameters that minimize the weighted root mean square residual
χ2= 1
N−p
N
i=1
dobs
i −dical
σi 2
(1)
wherediobsanddicalare observed and calculated data,σi is
standard deviation of the data,Nis the number of data, and p is the number of model parameters, respectively. The subscripti denotesith data. The Simulated Annealing al-gorithm searches the optimum model parameters randomly within the specified bounds which are narrowed according residuals as the search goes. It thus has the advantage of being independent on initial values, unlike psuedo-linear in-versions, as well as computationaly inexpensive, unlike the grid search algorithm.
northwest-dipping plane to the north and a southeast-dipping plane to the south (Katoet al., 2008). It also indi-cates that the aftershocks are limited at depths deeper than approximately 8 km (Kato et al., 2008). With this point of view, we attempted to model the deformation field with five models; these are (1) a northwest-dipping fault with a top depth of 8 km to be consistent with the aftershock dis-tribution, (2) same as (1) except that the fault is southeast-dipping, (3) a northwest and southeast-dipping faults, both with their top depths of 8 km, (4) same as (3), except that the northwest-dipping fault has a subfault extending to shlow depths with the same location at the bottom and al-lowing the dip change, and (5) same as (4) except that the southeast-dipping fault also has a subfault.
4.
Results
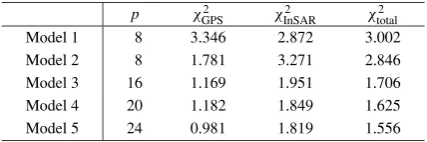
Table 1 compares the fit to the data of different models byχ2(Eq. (1)), indicating thatχ2roughly decreases as the
number of model parameters increase. To determine if the increase in the number of model parameters gives the sig-nificant improvement of the fit to the data, we applied theF -test to all model pairs. This -test shows that the best model is Model 5 with two southeast-dipping and northwest-dipping faults each. Because the top depths of the deeper faults are set to be 8 km, the shallower limit of the aftershock distri-bution (Katoet al., 2008), our results demonstrate that the coseismic rupture has reached depths where no aftershocks occurred.
Table 2 shows the optimum parameters derived from the inversion, indicating that the southern (southeast-dipping) faults released a seismic moment twofold larger than that released from northern (northwest-dipping) faults. This is consistent with slip distribution inferred from strong motion analysis that more seismic moment has been re-leased to the south during the earthquake (e.g., Hikima and Koketsu, 2007). Table 2 also indicates that the total mo-ment derived from our geodetic modeling is comparable with that inferred from seismic wave analysis (e.g., Hikima and Koketsu, 2007), implying that aseismic slip is insignif-icant up to 5 days after the mainshock.
Figures 2 and 3 compare the observed and calculated de-formation field for GPS and InSAR, respectively. Figure 2 shows that the horizontal displacements of almost all GPS sites are within the 95% confidence interval shown in Fig. 2 except for the closest GPS site. Figure 3 indicates that the
Table 1. Residuals of models with a single northwest dipping fault (Model 1), southeast-dipping fault (Model 2), a northwest- and south-east-dipping fault (Model 3), two northwest-dipping and a southeast dipping fault (Model 4), and two northwest and southeast dipping faults (Model 5). See text for details of the model.χ2is computed by Eq. (1). prepresents the number of model parameters for each model. Sub-scripts represent the data used in the calculation ofχ2.
p χGPS2 χInSAR2 χtotal2
Model 1 8 3.346 2.872 3.002
Model 2 8 1.781 3.271 2.846
Model 3 16 1.169 1.951 1.706
Model 4 20 1.182 1.849 1.625
Model 5 24 0.981 1.819 1.556
Table 2. Fault parameters of the optimum model with two south-east-dipping and two northwest-dipping faults. Depth, Dip, Strike, Lat., and Lon. represent the depth at the top of each fault, dip angle from hor-izontal, strike clockwise from north, and latitude and longitude at the center of the top of each fault, respectively.Mw is calculated assuming the rigidity of 30 GPa.
SE dipping NW dipping
Deep Shallow Deep Shallow
Length (km) 20.31 9.60
Width (km) 5.33 6.24 6.25 2.22
Depth (km) 8.00 2.02 8.00 6.41
(fixed) (fixed)
Dip (deg.) 21.32 73.40 46.60 45.78
Strike (deg.) 44.60 33.41
Lat. (deg.) 37.396 37.408 37.494 37.486
Lon. (deg.) 138.498 138.484 138.593 138.608
Strike slip (m) 0.01 0.10 0.19 0.86
Dip slip (m) 1.61 1.67 1.29 2.81
Mw 6.38 6.47 6.18 6.12
TotalMw 6.75
observed LOS changes (Fig. 3(a)) agree well with the calcu-lated LOS changes (Fig. 3(b)). The difference between the calculated and observed LOS changes (Fig. 3(c)) indicates that the residual is large to the south by up to 100 mm. This may be due to the simplification of the fault geometry and the slip distribution on the fault in our model. Nonetheless, we firmly believe that a simple model like ours still fits well the observed deformation.
5.
Discussion
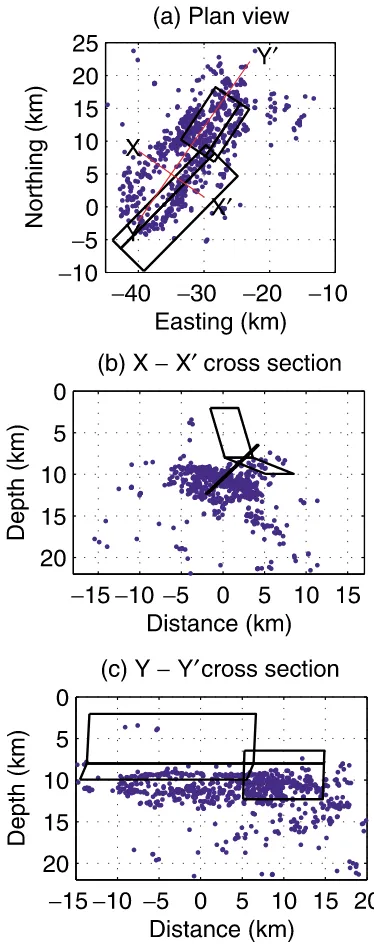
Figure 4 compares the location of aftershock distribution (Katoet al., 2008) and our fault model, clearly indicating that the southeast-dipping fault is significantly shallower than the aftershocks despite our effort to set the modeled faults at depths similar to those of the aftershocks. A possi-ble reason for this discrepancy is an anomalously thick sed-imentary layer in this region (Katoet al., 2006). Although geodetic data are generally much less sensitive to the crustal structure than seismic data, incorporating a heterogeneous crustal structure could change the optimum source location by up to several kilometers (e.g., Duet al., 1997). Another possibility is that the heterogeneous slip distribution on a fault, ignored in this study, can correct the bias. Our statis-tical analysis revealed that increasing the number of model parameters significantly improves the model (Table 2), im-plying that the slip distribution is likely to be heterogeneous or, at least, cannot actually be approximated by uniform slip on a fault.
con-Fig. 4. Comparison between aftershock distribution (blue; Katoet al., 2008) and our preferred fault model (black). (a) Plan view. Red lines indicate the direction of cross sections in (b) and (c). (b) Cross section along X–X. (c) Cross section along Y–Y.
ditionally stable slip, inhibiting the nucleation of an earth-quake and leading to the absence of aftershocks there. How-ever, the mainshock nucleating at depth can extend to shal-lower depths with a velocity-strengthening property by dy-namic loading induced by the slip at depth (Scholz, 2002).
6.
Conclusion
We modeled the coseismic deformation associated with the 2007 Chuetsu-oki earthquake observed by continuous GPS and InSAR. We assumed northwest- and southeast-dipping faults by referring to a precisely relocated after-shock distribution. Our model shows that the coseismic rupture has likely propagated at shallow depths where af-tershocks are terminated. We interpreted the rupture
prop-agation to occur from deep, where unstable slips occur, to shallow, where slips are conditionally stable, thus an earth-quake cannot be nucleated. The location of our modeled fault is significantly shallower than the aftershocks. Pos-sible reasons for the discrepancy are an ignorance of the heterogeneous subsurface structure and heterogeneous slip distribution, both of which we did not take into account in this study.
Acknowledgments. We thank Aitaro Kato for providing us with the hypocenters of aftershocks, the Geographical Survey Institute for access to GPS data. Reviews by Eric Fielding and an anony-mous referee improved the manuscript. PALSAR level 1.0 data from the ALOS satellite are shared among PIXEL (Palsar Inter-ferometry Consortium to Study our Evolving Land surface) and are provided from Japan Aerospace Exploration Agency (JAXA) under a cooperative research contract with Earthquake Research Institute, University of Tokyo. The ownership of PALSAR data belongs to the Ministry of Economy, Trade, and Industry, and JAXA. This work was partially supported from the Grant-in-Aid for Scientific Research, Japan Society for Promotion of Science (19340123).
References
Aoki, Y. and C. H. Scholz, Vertical deformation of the Japanese islands, 1996–1999, J. Geophys. Res., 108(B5), 2257, doi:10. 1029/2002JB002129, 2003.
Basu, A. and L. N. Frazer, Rapid-determination of the critical-temperature in Simulated Annealing inversion,Nature,249, 1409–1412, 1990. B¨urgmann, R., P. A. Rosen, and E. J. Fielding, Synthetic aperture radar
in-terferometry to measure Earth’s surface topography and its deformation, Ann. Rev. Earth Planet. Sci.,28, 169–209, 2000.
Cervelli, P., M. H. Murray, P. Segall, Y. Aoki, and T. Kato, Estimating source parameters from deformation data, with an application to the March 1997 earthquake swarm off the Izu Peninsula, Japan,J. Geophys. Res.,106, 11,217–11,237, 2001.
Cyranoski, D., Quake shuts world’s largest nuclear plant,Nature,448, 392–393, 2007.
Du, Y., P. Segall, and H. Gao, Quasi-static dislocations in three dimen-sional inhomogeneous media, Geophys. Res. Lett., 24, 2347–2350, 1997.
Heki, K., S. Miyazaki, H. Takahashi, M. Kasahara, F. Kimata, S. Miura, N. F. Vasilenko, A. Ivashchenko, and K. D. An, The Amurian Plate motion and current plate kinematics in eastern Asia,J. Geophys. Res., 104, 24,147–24,155, 1999.
Hikima, K. and K. Koketsu, Source process of the 2007 Chuetsu-oki earth-quake inferred from far field waveforms and strong motions,Seismol. Soc. Jpn. Fall Meeting, Abstract P1-085, 2007 (in Japanese).
Hirata, N., Introduction to the special section for the 2004 Mid-Niigata Prefecture Earthquake,Earth Planets Space,57, i, 2005.
J´onsson, S., H. Zebker, P. Segall, and F. Amelung, Fault slip distribution of the 1999Mw 7.1 Hector Mine, California, earthquake, estimated from satellite radar and GPS measurements,Bull. Seismol. Soc. Am., 92, 1377–1389, 2002.
Kato, A., S. Sakai, N. Hirata, E. Kurashimo, T. Iidaka, T. Iwasaki, and T. Kanazawa, Imaging the seismic structure and stress field in the source region of the 2004 mid-Niigata Prefecture Earthquake: Structural zones of weakness, seismogenic stress concentration by ductile flow,J. Geo-phys. Res.,111, B08308, doi:10.1029/2005JB004016, 2006.
Kato, A. and The Research Team of aftershock observations for the 2004 mid-Niigata Prefecture Earthquake, High-resolution aftershock obser-vations in the source region of the 2004 mid-Niigata Prefecture Earth-quake,Earth Planets Space,59, 923–928, 2007.
doi:10.1029/2004GC000841, 2005.
Nomale, D., Quake underscores shaky understanding of ground forces, Science,317, 438–439, 2007.
Okada, Y., Surface deformation due to shear and tensile faults in a half-space,Bull. Seismol. Soc. Am.,75, 1135–1154, 1985.
Rosenqvist, A., M. Shimada, N. Ito, and M. Watanabe, ALOS PALSAR: A Pathfinder Mission for Global-Scale Monitoring of the Environment, IEEE Trans. Geosci. Remote Sensing,45, 3307–3316, 2007.
Ruff, L. and H. Kanamori, The rupture process and asperity distribution of 3 great earthquakes from long-period diffracted P-waves,Phys. Earth Planet. Inter.,31, 202–230, 1983.
Sagiya, T., A decade of GEONET: 1994–2003—The continuous GPS ob-servation in Japan and its impact on earthquake studies—,Earth Planets Space,56, xix–xli, 2004.
Sagiya, T., S. Miyazaki, and T. Tada, Continuous GPS array and present-day crustal deformation of Japan, Pure Appl. Geophys.,157, 2303–
2322, 2000.
Samet, H. and R. E. Webber, Hierarchical data structures and algorithms for computer graphics. I. Foundamentals,IEEE Comp. Graphics Appl., 8, 48–68, 1988.
Sato, H. and N. Kato, Relationship between geologic structure and the source fault of the 2004 Mid-Niigata Prefecture Earthquake, central Japan,Earth Planets Space,57, 453–457, 2005.
Scholz, C. H.,The mechanics of earthquakes and faulting, 2nd ed.,471 pp, Cambridge University Press, Cambridge, UK, 2002.
Segall, P. and J. L. Davis, GPS applications for geodynamics and earth-quake studies,Ann. Rev. Earth Planet. Sci.,25, 301–336, 1997. Shoji, T. and H. Kitaura, Statistical and geostatistical analysis of rainfall in
central Japan,Comp. Geosci.,32, 1007–1024, 2006.