Evolution of monitoring, accounting and alerting services
at INFN-CNAF Tier-1
Stefano Dal Pra1, Antonio Falabella1,∗, Enrico Fattibene1, Gianluca Cincinelli2, Matteo Magnani2,TizianoDe Cristofaro2, andMartinRuini2
1INFN-CNAF, Bologna Italy
2Università di Bologna, Sede di Cesena, Italy
Abstract.CNAF is the national center of INFN (Italian National Institute for Nuclear Physics) for IT technology services. The Tier-1 data center operated at CNAF offers computing and storage resources to scientific communities as
those working on the four experiments of LHC (Large Hadron Collider) at CERN and other 30 experiments in which INFN is involved. In past years, mon-itoring and alerting services for Tier-1 resources were performed with several software, such as LEMON (developed at CERN and customized on the char-acteristics of datacenters managing scientific data), Nagios (especially used for alerting purposes) and a system based on Graphite database and other ad-hoc developed services and web pages. By 2015, a task force has been organized with the purpose of defining and deploying a common infrastructure (based on Sensu, InfluxDB and Grafana) to be exploited by the different CNAF
depart-ments. Once the new infrastructure was deployed, a major task was then to adapt the whole monitoring and alerting services. We are going to present the steps that the Tier-1 group followed in order to accomplish a full migration, that is now completed with all the new services in production. In particular we will show the monitoring sensors and alerting checks redesign to adapt them to the infrastructure base on the Sensu software, the web dashboards creation for data presentation, the porting of historical data from LEMON/Graphite to InfluxDB.
1 Introduction
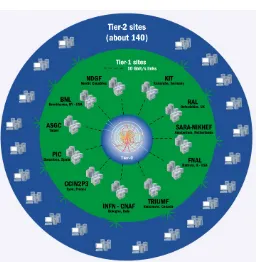
The INFN CNAF data center is part of the Worldwide LHC Computing Grid (WLCG), a collaboration of 170 data centers in 42 countries aiming at providing the computing power to store, distribute and analyse the data produced by the LHC at CERN. As shown in Fig. 1 the data centers are classified as tiers. The Tier-0 data center being the CERN one which is in charge of distributing the data to the Tier-1 data centers. The Tier-1s compute centers provide CPU power as well as disk and tape storage capacity and are connected to the Tier-0 via dedicated fibre links. The CNAF data center is a Tier-1 for WLCG, so it provides resources for the four main LHC experiments as well as 30 more other scientific communities in which INFN is involved.
The CNAF data center consists of∼30000 CPU cores,∼33PBof disk storage and∼70PB of tape capacity installed at the time of writing. The CPU resources are not deployed in the
Figure 1.WLCG Tier-1 and Tier-2 connections.
same geographical location, in fact since 2016∼50% of them are located at the CINECA data center nearby Bologna (Casalecchio di Reno). The two data centers are connected through a level 2 VPN via dedicated fibre links.
2 Monitoring infrastructure
In the past years the monitoring infrastructure [1] was based mainly on the LEMON [2] (LHC Era Monitoring) software and Nagios. LEMON has been developed at CERN and was used to collect, store and plot time series monitoring data, while Nagios [3] is an open source computer and network monitoring software application used to monitor the status of hosts and services, send notification and execute corrective actions. Moreover, accounting metrics were sent to a Graphite database and visualized through a custom designed web interface. Furthermore, this infrastructure was used only for the Tier-1 services, while the other CNAF divisions were using their own solutions. Starting from 2015 a new monitoring infrastruc-ture [4] has been designed in order cover all the divisions needs. Another technical issue was the discontinued support for LEMON, while Nagios has been considered not scalable for the CNAF needs as well as an old user interface not flexible enough to manage a dynamic infrastructure.
The choice of the new components has been done considering the following aspects: • Horizontal scalability;
• management via configuration management tools like Puppet; • reusability of Nagios probes;
Figure 1.WLCG Tier-1 and Tier-2 connections.
same geographical location, in fact since 2016∼50% of them are located at the CINECA data center nearby Bologna (Casalecchio di Reno). The two data centers are connected through a level 2 VPN via dedicated fibre links.
2 Monitoring infrastructure
In the past years the monitoring infrastructure [1] was based mainly on the LEMON [2] (LHC Era Monitoring) software and Nagios. LEMON has been developed at CERN and was used to collect, store and plot time series monitoring data, while Nagios [3] is an open source computer and network monitoring software application used to monitor the status of hosts and services, send notification and execute corrective actions. Moreover, accounting metrics were sent to a Graphite database and visualized through a custom designed web interface. Furthermore, this infrastructure was used only for the Tier-1 services, while the other CNAF divisions were using their own solutions. Starting from 2015 a new monitoring infrastruc-ture [4] has been designed in order cover all the divisions needs. Another technical issue was the discontinued support for LEMON, while Nagios has been considered not scalable for the CNAF needs as well as an old user interface not flexible enough to manage a dynamic infrastructure.
The choice of the new components has been done considering the following aspects:
• Horizontal scalability;
• management via configuration management tools like Puppet;
• reusability of Nagios probes;
• modern UI and dashboard composition;
• separation of the contexts between CNAF functional units.
As a data store for measurement persistence InfluxDB [5] has been chosen, and Sensu [6] to manage the metric collections and to implement an alerting system. Grafana [7] has been chosen for dashboard composition. It provides highly customizable dashboards and an easy integration with InfluxDB. A dashboard example is shown in Fig. 2.
Figure 2.Example of Grafana monitoring dashboard. It reports plots for CPU metrics provided by the Sensu build-in plugin, and single number widgets for instantaneous load and RAM usage.
3 Migration
The migration to the new infrastructure followed these steps:
• Probes migration;
• Old time series database schema adaptation;
• Historical measurements migration;
• Dashboards composition.
The probes can be divided into two categories: generic, such as CPU load, RAM and disk usage and probes specific for the services delivered by the CNAF computing center. Several metric probes has not been migrated thanks to the fact that Sensu provides several built-in packages including the OS metric probes, while the probes for the batch system services, data transfers services and the storage ones such as GPFS, Fibre Channel, InfiniBand, tape library, have been ported from Nagios to Sensu. This was mostly straightforward because Sensu is designed to accept any kind of script which output is compatible with the Nagios output format:
• Exit status 0 : OK
• Exit status 1 : WARNING
• Exit status 2 : CRITICAL
The old databases were based on Graphite for the accounting metrics and Oracle (LEMON) for monitoring metrics. The metrics has been ported in a one-to-one correspondence between the old and new infrastructures. The metric measurements have then been retrieved from the old database and inserted into the new one (InfluxDB). When the retention policies were not matching the data has been resampled. The dashboard composition has been done using Grafana, grouping the data presentation in four main categories: farming, storage, network and infrastructure.
4 Pledges
The evolution of the monitoring system gave us the opportunity to implement the pledges monitoring and visualization to complete the three figures characterizing the resources deliv-ery from the CNAF Tier-1:used,assignedandpledgedvalues.
The used value of a resource comes from the monitoring infrastructure described above, the assigned value of a resource (CPU and storage capacity) can be retrieved from the batch sys-tem configuration and file syssys-tems occupancy, while the pledged value of a resource come from the funding committees. Note that in principle the assigned amount of resources can be different from the pledges when a community requires a temporary overpledge.
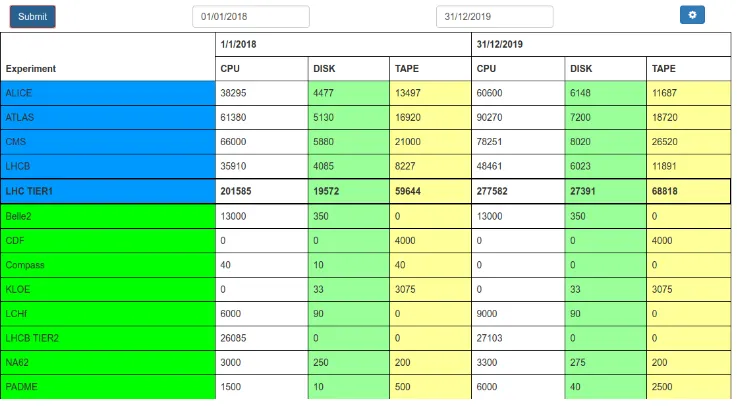
The capability to monitor and graph the amount of pledged resources was not available with the previous monitoring system. To overcome this limit we developed a web app based on Flask [8] back end to insert, modify and retrieve the pledge values from a PostgreSQL database. A screenshot of the web app page can be seen in Fig. 3. The left column reports the experiment supported at CNAF, the other columns report the CPU, disk and tape pledges in two consecutive years (to give an immediate view of the trends). The web app allows to insert overpledges with a specific expiration date or modify the values of single entries. These values can be visualized in Grafana, since it allows to use PostgreSQL database as data
Figure 3. Pledges management web app. The main page report the values for CPU, disk and tape pledges for the current year and the next year.
The old databases were based on Graphite for the accounting metrics and Oracle (LEMON) for monitoring metrics. The metrics has been ported in a one-to-one correspondence between the old and new infrastructures. The metric measurements have then been retrieved from the old database and inserted into the new one (InfluxDB). When the retention policies were not matching the data has been resampled. The dashboard composition has been done using Grafana, grouping the data presentation in four main categories: farming, storage, network and infrastructure.
4 Pledges
The evolution of the monitoring system gave us the opportunity to implement the pledges monitoring and visualization to complete the three figures characterizing the resources deliv-ery from the CNAF Tier-1:used,assignedandpledgedvalues.
The used value of a resource comes from the monitoring infrastructure described above, the assigned value of a resource (CPU and storage capacity) can be retrieved from the batch sys-tem configuration and file syssys-tems occupancy, while the pledged value of a resource come from the funding committees. Note that in principle the assigned amount of resources can be different from the pledges when a community requires a temporary overpledge.
The capability to monitor and graph the amount of pledged resources was not available with the previous monitoring system. To overcome this limit we developed a web app based on Flask [8] back end to insert, modify and retrieve the pledge values from a PostgreSQL database. A screenshot of the web app page can be seen in Fig. 3. The left column reports the experiment supported at CNAF, the other columns report the CPU, disk and tape pledges in two consecutive years (to give an immediate view of the trends). The web app allows to insert overpledges with a specific expiration date or modify the values of single entries. These values can be visualized in Grafana, since it allows to use PostgreSQL database as data
Figure 3. Pledges management web app. The main page report the values for CPU, disk and tape pledges for the current year and the next year.
source. This allows to plot the superposition of the used, assigned and pledged values over
time of a certain metric. An example can be seen in Fig. 4.
Figure 4. CPU plots for the four main LHC experiments. The plots report the CPU usage, share and pledges (measured in HS06) for the period between June and December 2018.
5 Conclusions
The work described summarize the activities related to the monitoring infrastructure evolu-tion at INFN-CNAF Tier-1 in the last years. This gave us the opportunity to track several modern monitoring technologies and to exploit an unique monitoring infrastructure serving all the CNAF departments. A complex work has been carried on in order to migrate sensors and data from the old infrastructure, based on different tools, to the new one. A long standing issue was the monitoring and visualization of the pledges which has been integrated with the new infrastructure.
References
[1] S. Antonelli et al,INFN-CNAF Monitor and Control System, J. Phys. Conf. Ser.3312011 042032
[2] M. Babik et al,LEMON - LHC Era Monitoring for Large-Scale Infrastructures, J. Phys. Conf. Ser.3312011 052025
[3] Nagios, https://www.nagios.org/
[4] S. Bovina et al,The evolution of monitoring system: the INFN-CNAF case study, J. Phys. Conf. Ser.8982017 092029