Parallel Voronoi Diagram Construction Method with
MapReduce
Ying XiaP 1
P
, Xiaobing WuP 1
P
, Xu ZhangP 1
P
and Hae Young BaeP 1
P
1
P
Research Center of Spatial Information System, Chongqing University of Posts and Telecommunications, Chongqing, China
Abstract
Voronoi diagram has been widely used as a spatial index in spatial queries which can be frequently seen in the applications such as decision support systems, profile-based marketing and GIS. Focused on the problem of Voronoi diagram construction for cloud computing environment, a parallel construction method with MapReduce is proposed. This method uses the incremental insertion algorithm to construct the Delaunay triangulation mesh rapidly, and then transforms it to the Voronoi diagram with Quad-Edge structure. In addition, the MapReduce framework and SpatialHadoop for processing the big spatial data are also used to construct the Voronoi diagram in parallel. Experimental results show that the proposed parallel construction method can improve the Voronoi diagram construction effectively, it can meet the requirement of indexing large-scale spatial data.
Keywords: 38TSpatial Index, Delaunay Triangulation, Voronoi Diagram, MapReduce, SpatialHadoop
1. Introduction
With the rapid development of cloud computing, big data and mobile Internet, a large amount of spatial data are gathered in many fields such as traffic, environment, social networking and so on. The large-scale spatial data puts forward higher requirements for the diversity and efficiency of spatial information services. Spatial query such as nearest neighbor query serves as the basis of spatial information services, and its processing efficiency is the key factor of system performance. Moreover, it's a computationally complex problem which is time consuming to solve, especially with large-scale spatial data. Therefore, how to provide an efficient spatial index of massive spatial data for spatial queries is one of the research hotspots for spatial information processing [1].
Constructing an efficient spatial index is useful to improve the efficiency of spatial query. When faced with massive and complex spatial data, traditional tree index structures, such as R-Tree, KD-Tree and Quard-Tree, are restricted by the top-down search mechanism, the nodes near the tree root are overload and fail to improve the performance by parallelization. However, the index method based on Voronoi diagram [2] only needs to compute the Voronoi
polygon to solve the spatial neighbor and other queries. What’s more, the Voronoi diagram construction is intrinsically parallelizable and it’s easy to be realized for cloud computing environment. Voronoi diagram can be obtained by transforming the Delaunay triangulation mesh [3] with its dual operation. The main methods of constructing a Delaunay triangulation mesh are the divide and conquer algorithm, the incremental insertion algorithm and the triangulation algorithm, etc, but all of these algorithms fail to provide good efficiencies for large-scale spatial data. This paper considers to use the incremental insertion algorithm to construct the Delaunay triangulation mesh and then transforming it to its dual Voronoi diagram. In addition, all of the operations are implemented with the MapReduce [4] framework and SpatialHadoop [5] for processing big spatial data to improve the construction efficiency of Voronoi diagram.
2. Related Work
Before presenting the parallel Voronoi diagram construction method, the related works such as the Voronoi Diagram, the Delaunay triangulation mesh, the MapReduce framework and the big spatial data processing platform called SpatialHadoop are introduced to prepare for the rest of the discussion.
2.1 Voronoi Diagram
Voronoi diagram is a geometric structure based on discrete points as its generators in the plane. It can split a plane into several adjacent and non-overlapping space regions. These regions are called Voronoi polygons. A Voronoi diagram can be constructed by merging Voronoi polygons which are generated by the discrete points. All of these points can be associated together by the Voronoi diagram, and this diagram structure also implies the adjacent relationship of points. When the Voronoi polygons of two points have the same edge, it indicates that these two points are spatial neighbors. By judging whether the Voronoi polygons of
points have the public edge is a good way to confirm spatial neighbor relationship [6].
Here is a definition of Voronoi polygon. Given a set
of
points
𝑃𝑃= {𝑝𝑝1,𝑝𝑝2, … ,𝑝𝑝𝑛𝑛} , where 2 < n <∞ , i≠ j , 𝑝𝑝𝑖𝑖≠ 𝑝𝑝𝑗𝑗and i j, ∈In ={1, 2, ..., n}. Then the Voronoipolygon of pRiR called 𝑉𝑉𝑃𝑃(𝑝𝑝𝑝𝑝) and
𝑉𝑉𝑃𝑃(𝑝𝑝𝑝𝑝) = {𝑝𝑝�𝑑𝑑(𝑝𝑝,𝑝𝑝𝑝𝑝)≤𝑑𝑑(𝑝𝑝,𝑝𝑝𝑗𝑗)}where𝑑𝑑(𝑝𝑝,𝑝𝑝𝑝𝑝)
s
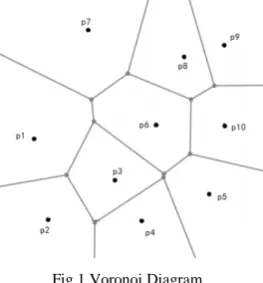
pecifies the minimum distance between p and pRiR in Euclidean space. And then the Voronoi diagram with the given set P called 𝑉𝑉𝑉𝑉(𝑃𝑃) can be constructed by merging Voronoi polygons where 𝑉𝑉𝑉𝑉(𝑃𝑃) = { 𝑉𝑉𝑃𝑃(𝑝𝑝1) ,𝑉𝑉𝑃𝑃(𝑝𝑝2) , … ,𝑉𝑉𝑃𝑃(𝑝𝑝𝑛𝑛) }.Fig.1 Voronoi Diagram.
As shown in figure 1, it is a Voronoi diagram constructed by some discrete points as its generators. Voronoi diagram has hour main properties [2] which are enlisted as below:
Property 1: The Voronoi diagram for given set of points is unique.
Property 2: Let nRvR and nReR be the number of points and Voronoi edges, respectively, then𝑛𝑛𝑒𝑒≤3𝑛𝑛𝑣𝑣−6.
Property 3: Each Voronoi edge is shared by two Voronoi polygons and the average number of Voronoi edges per Voronoi polygon is at most 6. This means that on average, each point has 6 adjacent points.
Property 4: The nearest point of pRiR is among the points whose Voronoi polygon shares the Voronoi edge with 𝑉𝑉𝑃𝑃(𝑝𝑝𝑝𝑝).
With the above four properties, it’s easy to solve spatial neighbor and other queries by Voronoi diagram. However, before constructing the Voronoi diagram, its dual diagram Delaunay Triangulation mesh should be firstly constructed.
2.2 Delaunay Triangulation Mesh
Triangle obtained by connecting the generating points of the Voronoi diagram called the Delaunay triangle. A Voronoi diagram corresponded to all the Delaunay triangles forms a continuous and non-overlapping spatial mesh structure, which is called the Delaunay triangulation mesh.
Constructing the Delaunay triangulation mesh is the basis of constructing Voronoi diagram. As shown in figure 2, it is the Delaunay triangulation mesh of the Voronoi diagram in figure 1. These two can be converted to each other through a certain rule. And the Delaunay triangulation mesh construction has a variety of methods for reference [7-9]. But when faced with the massive spatial data, the existing methods can’t provide a good efficiency. However, the Delaunay triangulation mesh is intrinsically parallelizable for cloud computing environment. So the proposed method in this paper tries to build the Delaunay triangulation mesh and then to convert it to its dual Voronoi diagram in parallel with SpatialHadoop.
Fig.2 Delaunay Triangulation Mesh.
2.3 MapReduce and SpatialHadoop
MapReduce proposed by Google in 2004 is a kind of parallel computing framework which is widely used on distributed platforms. MapReduce framework consists of a Master node and a number of Slave nodes, where the Master node is responsible for metadata organization and task scheduling and the Slave nodes are responsible for data storage and computing. Map (mapping) and Reduce (reducing) are its main idea. MapReduce is mainly by starting multiple tasks to process different data blocks and returning the processed results of the corresponding tasks. Then, the results are processed by Reduce tasks to get the final result.
With the help of the Apache open source project named Hadoop which is based on MapReduce and HDFS (Hadoop Distributed File System), MapReduce plays an important role in the academic and industrial circles [10]. In 2013, a scholar named Eldawy of University of Minnesota, achieved a big spatial data processing platform called SpatialHadoop which is based on Hadoop. As shown in figure 3, SpatialHadoop pursues its spatial index at all structural levels of Hadoop, that is, the language level, the operations level, the MapReduce level and the storage
level. Compared with the traditional Hadoop platform which data is randomly divided into blocks, SpatialHadoop divides data into blocks with spatial association by its index structure, which can aware of big spatial data efficiently. Therefore, SpatialHadoop can be used to solve the problems of large-scale spatial data processing [5, 11].
Fig.3 SpatialHadoop Architecture. [5]
3. Parallel Voronoi Diagram Construction
Method
In this section, the parallel Voronoi diagram construction method is presented. For each operation, the specific approaches are introduced.
3.1 Delaunay Triangulation with the Incremental
Insertion Algorithm
The main idea of the incremental insertion algorithm is to create a minimum bounding rectangle that contains all the discrete points, and then generates an initial Delaunay triangle. After that, to insert the remaining points one by one, when each point is inserted then modifying the affected triangles to make sure that the results are obtained for the Delaunay triangulation mesh. However, the traditional incremental insertion algorithm always spends too much time in point locating which makes the time complexity of the algorithm is very high. Therefore, our proposed method is that to build a grid index (as shown in fig. 4) to locate the points, the benefits of doing so are as follows:
1) The grid index can divide the points in the same or adjacent grid into the same data block which is convenient for parallel processing.
2) When querying each point, the corresponding grid should be firstly found and then querying the points in the grid. This will save most of the time.
Fig 4. Grid Index.
Obviously, if the grid unit is too small, then the points in each grid will be little, and the cost of the program will be greatly increased in the location of the grid. Conversely, if the grid unit is too large, the number of the grids will be little which makes the cost of locating points in each grid high. So determining the appropriate size of the grid will be a key to improving the incremental insertion algorithm. In this paper, we use the following empirical formula proposed by Xu Daozhu and Liu Haiyan [8].
( )
x int xmax xmin
cellsize
−
= (1)
( )
y int ymax ymin 1
cellsize
−
= + +
(2)
(
)(
)
size xmax xmin ymax ymin n
− −
= (3)
The cellsize represents the grid interval size, while y and x represent the number of horizontal and vertical direction of the grids respectively.
The steps to build a Delaunay triangulation mesh using the incremental insertion algorithm are as follows:
Step 1: To traverse all of the points in the given data set, creating a minimum bounding rectangle that contains all of the points in the data set, and then constructing the initial Delaunay triangle according to the minimum bounding rectangle.
Step 2: To reorder all of the points. Basic idea is that building the grid index for the given points set and recording points in each grid. And then scan each grid, every point is inserted into the initial Delaunay triangle in order.
Step 3: When each point is inserted, determining the influence region of the point and then modifying the affected triangles.
Step 4: When all of the points of the given data set are inserted, removing the triangles associated with the initial
minimum bounding rectangle and the Delaunay triangulation mesh is constructed.
When constructing a Delaunay triangulation mesh, for the convenience of transforming to the Voronoi diagram, Quad-Edge structure is used to store all of the Delaunay triangles.
3.2 Dual Operation with Quad-Edge Structure
Quad-Edge structure is proposed by Guibas in [12] which preserves the dual relationship between Delaunay edge and Voronoi edge.
eOrg
Fig.5 Quad-Edge Structure.
As can be seen in figure 5, for each directed edge e in the Quad⁃Edge structure has three fundamental behaviors: eOrg: To return the starting point of the current edge. eRot: To return the directed edge which obtained by 90 degrees counter clock wise rotation of e.
eOnext: To return the next directed edge which obtained by counterclockwise rotation of eOrg.
When constructing a Delaunay triangulation mesh, all of the obtained Delaunay triangles save as Quad⁃Edge structure. For the Delaunay triangle with Quad-Edge structure always preserves its dual Voronoi polygon. As shown in figure 5, for the directed edge e of the current Delaunay triangle, we define its dual operation called Dual. By the dual operation, the dual edge of e is obtained directly:
.
e Dual=eRot (4) eRot is a directed edge of the Voronoi polygon which is dual with the current Delaunay triangle. This duality behavior is also performed in the point and face swaps between the dual diagrams. So that it is convenient to construct a Voronoi diagram by transforming the Delaunay triangulation mesh through dual operations. In addition, dual operations can be carried out in different data blocks, so it is easy to be realized in parallel.
3.3 Voronoi Diagram Construction with MapReduce
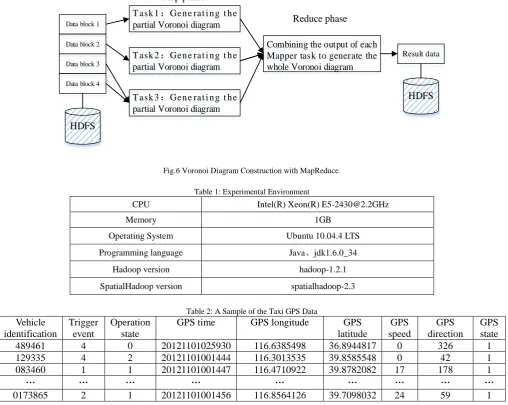
When constructing a Voronoi diagram on a distributed platform, the relationship between the individual data blocks should be considered. Therefore, the data set should firstly be constructed with a grid index which mentioned above, the built-in index function of SpatialHadoop can construct the grid index for the given data set. In the Map phase, the grid index can be used to partition the data blocks to different Mapper tasks, then the Mapper tasks use the incremental insertion algorithm to construct the partial Voronoi diagram of each data block. While in the Reduce phase, the main task is to combine the output of each Mapper task into a whole Voronoi diagram. However, due to the Mapper tasks in the Map phase only construct the partial Voronoi diagram of the specified data block, so the data points of the boundary in each grid are not considered in the Reduce phase. Therefore, when the Reduce phase has completed, grid index can be used to find the data points near the boundary. Then, these data points can be used to reconstruct the local Voronoi diagram near the boundary by the incremental insertion algorithm, so as to improve the accuracy of the whole Voronoi diagram.
The main steps of the Voronoi diagram construction with MapReduce are as follows:
Step 1: To input the coordinate of each point in the given data set, then to compute a minimum bounding rectangle for the data set. Based on the minimum bounding rectangle, the built-in index function of SpatialHadoop can be used to construct a grid index for the data set.
Step 2: To start multiple Mapper tasks and using the built-in partition function of SpatialHadoop to divide data set into individual blocks with the grid index. Then assigning data blocks to each Mapper task to be processed. For each block, using the incremental insertion algorithm to construct the Delaunay triangulation mesh and the Quad-Edge structure to store the intermediate data. And then transforming the Delaunay triangulation mesh to its dual Voronoi diagram with Quad⁃Edge structure by dual operations. In this way, each Mapper task constructed the partial Voronoi diagram in each data blocks.
Step 3: To perform the Reduce operation on the return results for each Mapper task. When the Reduce operation is completed, the whole Voronoi diagram is constructed. Step 4: The points of the grid boundary are obtained based on the grid index, then using the incremental insertion algorithm to reconstruct the local Voronoi diagram near the grid boundary, so as to improve the accuracy of the whole Voronoi diagram.
The processing flow of the MapReduce is shown in figure 6.
T ask 1:Gen e rat i n g t h e partial Voronoi diagram
T ask 2:Gen e rat i n g t h e partial Voronoi diagram
T ask 3:Gen e rat i n g t h e partial Voronoi diagram
Combining the output of each Mapper task to generate the whole Voronoi diagram
HDFS
HDFS Result data Map phase
Reduce phase Data block 1
Data block 2
Data block 3
Data block 4
Fig.6 Voronoi Diagram Construction with MapReduce.
Table 1: Experimental Environment
CPU Intel(R) Xeon(R) [email protected]
Memory 1GB
Operating System Ubuntu 10.04.4 LTS
Programming language Java、jdk1.6.0_34
Hadoop version hadoop-1.2.1
SpatialHadoop version spatialhadoop-2.3
Table 2: A Sample of the Taxi GPS Data Vehicle
identification
Trigger event
Operation state
GPS time GPS longitude GPS
latitude
GPS speed
GPS direction
GPS state
489461 4 0 20121101025930 116.6385498 36.8944817 0 326 1
129335 4 2 20121101001444 116.3013535 39.8585548 0 42 1
083460 1 1 20121101001447 116.4710922 39.8782082 17 178 1
… … … …
0173865 2 1 20121101001456 116.8564126 39.7098032 24 59 1
4. Experiments
The experiments to the proposed parallel Voronoi diagram construction method are introduced in this section, including the specific experimental environment, date sets and the final experimental results.
4.1 Experimental Settings
All of the algorithms are implemented by Java language. MapReduce framework of the SpatialHadoop is used to parallelize the incremental insertion algorithm and the dual operation with Quad-Edge structure.
Experiments are performed on a SpatialHadoop cluster with 9 nodes, one as the Master node, the other eight as Slave nodes. The specific experimental environment is shown in the table1.
The data used in the experiments is a taxi GPS data [13] in Beijing urban traffic environment. As can be seen in table 2, each data point represents the dynamic information of a taxi in a continuous movement, containing 9 dimensions of information (such as vehicle identification, trigger event, operation state, GPS time, GPS longitude, GPS latitude, GPS speed, GPS direction and GPS state). Experiments in this paper only consider the location information in Euclidean space, so the latitude and longitude information of the data set are focused. The size of each original taxi trajectory data file is about 1137KB, in order to reduce the impact of the data set in the experiments. First of all, the original data set should be pre-processed to merge these
small files into large files which are suitable for MapReduce processing and stored on the HDFS. This paper selects the Voronoi diagram construction
method based on the classic divide and conquer algorithm as a comparative experiment. The average time complexity of this method is about 𝑂𝑂(𝑁𝑁𝑁𝑁𝑁𝑁𝑁𝑁𝑁𝑁) and the time efficiency is good. According to the Property 1 of the Voronoi diagram mentioned above, for the different methods which use the same distance definition, the constructed Voronoi diagram are the same. Therefore, the first experiment focuses on the construction response time of two methods. While, the second one focus on the construction response time of different numbers of the computing nodes in the clusters when constructing Voronoi diagram.
4.2 Performance Evaluation
Figure 7 compares the two construction response time of the Voronoi diagram construction methods based on the classic divide and conquer algorithm and MapReduce framework. The data sets of different sizes used in the experiment are 50 thousand to 1 million points extracted from the taxi GPS data. As shown in figure 7, the response time of two methods don’t appear too much when the data size is less than 100 thousand. Therefore, when the size of data set to be processed is less than 100 thousand, the construction method based on the classic divide and conquer algorithm should be firstly considered. However, when confronted with the size of data set is more than 100 thousand, the response time of the method based on the classic divide and conquer algorithm is significantly increased. But the response time of the parallel construction method with MapReduce is steady increased and the variation range changes little. As figure 7 shows, with the increasing of the scale of the data set, the constructing efficiency of the parallel construction method with MapReduce is much higher than the classic method. Therefore, when the data size is more than 100 thousand, the Voronoi diagram parallel construction method with MapReduce should be considered in order to get a better response time of construction. In addition, the results obtained by the method with MapReduce can also be saved on each node of the cluster, so that it is convenient to operate the spatial neighbor queries on the SpatialHadoop cluster in the later stage.
Fig.7 Effect of Data Size on the Construction of Voronoi Diagram.
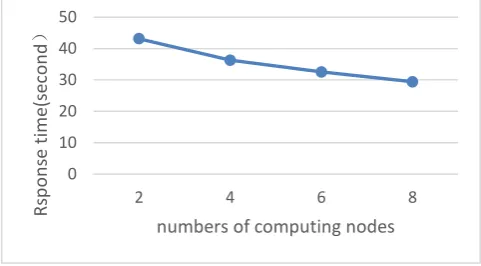
As shown in figure 8, the experiment tests the effect of different numbers of computing nodes when constructing the Voronoi diagram in parallel. The data set used in the experiment is a taxi GPS data of 1 million and the computing nodes in the SpatialHadoop cluster is from 2 to 8. It can be seen from the figure that with the increase of the number of nodes in the cluster, the response time of the method is gradually decreased, but it gradually becomes stable. Therefore, it can be concluded that when constructing a Voronoi diagram for larger-scale data, increasing the number of computing nodes can obtain a better response time of construction. However, when the response time curve tends to be stable, other ways need to be considered to get a better response time, such as optimizing the incremental insertion algorithm, using different data storage structure and so on.
Fig.8 Effect of the Number of Computing Nodes on the Construction of Voronoi Diagram.
5. Conclusion
This paper focus on the indexing technology of large-scale spatial data, and proposes a distributed index construction method for cloud computing environment, the Voronoi diagram parallel construction method. The method uses the incremental insertion algorithm to rapidly construct the
0 20 40 60 80
50 100 500 1000
Rs
po
ns
e t
ime(
sec
on
d)
size of points data (*1000) MapReduce divide and conquer
0 10 20 30 40 50
2 4 6 8
Rs
po
ns
e t
ime(
sec
on
d
)
numbers of computing nodes
Delaunay triangulation mesh, and the Quad-Edge structure to transform the Delaunay triangulation mesh to its dual Voronoi diagram. In addition, all of the operations are
performed with the MapReduce framework and
SpatialHadoop for processing big spatial data.
Experimental results show that the construction time of the method proposed in this paper is superior to the method based on the classic divide and conquer algorithm. In addition, increasing the computing nodes can improve the efficiency of Voronoi diagram construction in a certain extent. But with the increase of the number of computing nodes, the curve of the response time tends to be stable. For future work is to support the spatial queries such as k nearest neighbor, reverse nearest neighbor for the massive spatial data based on the Voronoi diagram index in parallel.
Acknowledgments
This work is funded by Chongqing Natural Science Foundation (cstc2014kjrc-qnrc40002), Scientific and Technological Research Program of Chongqing Municipal Education Commission (KJ1500431), and WenFeng Creative Foundation of CQUPT (WF2014-05).
References
[1] Shekhar, Shashi, et al. "Spatial big-data challenges intersecting mobility and cloud computing." Proceedings of the Eleventh ACM International Workshop on Data Engineering for Wireless and Mobile Access. ACM, 2012. [2] A.Okabe, B.Boots, and K.Sugihara, Editor, “Spatial
Tessellations: Concepts and Applications of Voronoi Diagrams”, New York, John Wiley & Sons Inc., 1992. [3] J.R. Shewchuk, “Delaunay refinement algorithms for
triangular mesh generation”, Computational Geometry: Theory and Applications, vol. 22, no. 1-3(2002), pp. 21-74. [4] J. Dean and S. Ghemawat, “MapReduce: simplified data
processing on large clusters”, Proceedings of the 6th conference on Symposium on Opearting Systems Design & Implementation, 2004.
[5] A. Eldawy and M. F. Mokbel, “A demonstration of SpatialHadoop: an efficient mapreduce framework for
spatial data”, Proceedings of the 39th International Conference on Very Large Data Bases, 2013
[6] L. Hu, K. Wei-Shinn, B. Spiridon and S. Cyrus, “Spatial Query Integrity with Voronoi Neighbors”, IEEE Transactions on Knowledge and Data Engineering, vol. 25, no. 4, 2003, pp. 863-876.
[7] W. Longhao and W. Jiexian, “Fast Delaunay triangulation generation algorithm based on incremental insertion method”, Geotechnical Investigation & Surveying, no.10, 2013, pp. 75-79.
[8] XU D, LIU H. An Improved Algorithm for Creation of Delaunay Triangulation. Geomatics & Spatial Information Technology, vol. 30, no.1, 2007, pp. 38-41.
[9] F. Jiansheng and Ma. Cunliang, “Parallel algorithm of Delaunay triangulation dividing for scattered point set based on Quad-Edge structure”, Modern Electronics Technique, vol. 38, no.6, 2015, pp. 28-30.
[10] W. Yanming, F. Guohe and X. Yun, “Summary of Hadoop Research in Recent Years in Foreign Countries”, Computer Systems & Applications, no.6, 2013, pp. 1-5.
[11] A. Eldawy and M. F. Mokbel, “CG_Hadoop: computational geometry in MapReduce”, Proceedings of the 21st ACM SIGSPATIAL International Conference on Advances in Geographic Information Systems, 2013.
[12] L. Guibas and J. Stolfi,“Primitives for the manipulation of general subdivisions and the computation of Voronoi diagrams”, ACM Transactions on Graphics (TOG), vol. 4, no. 2, 1985, pp. 74-123.
[13] http://www.datatang.com/data/45888/
Ying Xia is a professor of Chongqing University of Posts and Telecommunications. Her research area mainly includes database and data mining, spatial information processing, etc.
Xiaobing Wu is a graduate student at the College of Computer Science and Technology, Chongqing University of Posts and Telecommunications. His research area mainly includes database and spatial information processing.
Xu Zhang is an associate professor of Chongqing University of Posts and Telecommunications. His research area mainly includes cloud computing and big data processing.
Hae Young Bae is tenured full professor of Inha University of Korea and honorary professor of the Chongqing University of Posts and Telecommunications of China. His research area mainly includes database and spatial information processing.
![Fig.3 SpatialHadoop Architecture. [5]](https://thumb-us.123doks.com/thumbv2/123dok_us/7851516.1301971/3.612.66.278.153.312/fig-spatialhadoop-architecture.webp)