Analysis of Dynamic Plastic Deformation process on an
Electrolytic Tough - Pitch copper (Cu-ETP): From
material characterization to models improvement
Jérôme Mespoulet1,2,*, Bermane Beucia2, David Tingaud2, Pierre-Louis Hereil1, Hervé Couque3, Guy Dirras2 1THIOT INGENIERIE, Route Nationale, 46130 Puybrun, France
2LSPM, CNRS - UPR3407, 99 av. Jean Baptiste Clément – 93430 Villetaneuse 3NEXTER MUNITIONS, DT/MLA, 7 Route de Guerry, 18023 Bourges Cedex
Abstract. This paper presents a comprehensive study of a direct impact compression loading on an Electrolytic Tough-Pitch copper (Cu-ETP). The aim of the study is to provide reliable experimental data in this dynamic loading using high-speed video camera records and real time projectile deceleration profiles. Test set-up has been optimized to ensure an efficient recovery of the samples after the Dynamic Plastic Deformation (DPD) process in the 103 to 104 s-1 strain rate range regime. Structural investigations have been
made on post-mortem samples: microstructure investigations of recovered samples have shown more structural changes in terms of crystallographic texture and grain sizes. Post-mortem tensile tests have also been carried out to evaluate yield strength behavior of the Cu-ETP copper after the DPD process. Numerical simulations have been performed to evaluate the ability of empirical models to reproduce recorded signals. In-situ results (time evolution of strain, strain rate, temperature, etc.) given by the numerical analysis have contributed to enrich the post-mortem analysis.
1 Introduction
The quest of increasing mechanical properties of metals and alloys has since the old ages made many developments allowing fabricating stronger and stronger materials. Those techniques use either, or together, alloying and/or thermomechanical treatments to optimize material mechanical properties by adjusting grains and sub-grain sizes, phases nature and proportions, precipitates, textures, etc.
UltraFine Grains (UFG) processing is one of the developments that starts to be understood in the 50’s. It’s based on the fact that the finer the grain the stronger the material. This principle is known since the 50’s as the Hall-Petch relationship. This relation found from individual works of Hall [1] and Petch [2] makes yield stress evolution follow an inverse-root square expression of the grain size.
Numerous works and studies have been proposed and developed to attain the goal of refining the microstructure and have made UFG materials one of the most competitive options to access unachievable properties by unconventional means. Severe Plastic Deformation (SPD) is a group of methods that used some mechanical processes to reach the goal of refining the grains and/or inducing grain fragmentation and high dislocation density in the material.
A non-exhaustive list of the main SPD techniques has been done by Azushila et al. in [3]. All those techniques can be divided into two categories:
•single step technique: High Pressure Torsion (HPT), Spin Extrusion or Torsion Extrusion…
•multisteps techniques: Equal Channel Angular Press (ECAP), Extrusion (ECAE), Rolling (ECAR), Accumulative Roll-Bonding (ARB), Multi-Axial Forging (MAF), or Cyclic Closed Die Forging (CCDF), etc.
This paper presents an innovative technique that combine shock physics, physical metallurgy and mechanics of materials in a single step process. It uses Dynamic Plastic Deformation with a direct impact configuration that associated shock, plastic works and thermal effects to refine the grains, create sub-grains structure and increase dislocation density in the material.
2. Investigated material
2.1 Composition
The material investigated in this study is an Electrolytic Tough-Pitch copper alloy (Cu-ETP) with 99.98% purity. It has been supplied as a 25 mm diameter extruded 2.0 m long rod. The extruded process has given a half-hard state.
2.2 Analysis of Initial Microstructure
Figure 1 shows the Inverse Pole Figure (IPF) and the corresponding micro-texture intensity extracted from Electron BackScattered Diffraction (EBSD) investigations of 1800*1800 µm2 area (step size 1.5 m)
of the as-received material. It is seen that the grains are mainly oriented in the [001] (rod axis direction) and [111] directions, the latter with a remote intensity.
A grain boundary map is shown in Figure 2. A grain is defined by at least 3 neighboring pixels misoriented by less than 15°. The map shows a very high amount of Low Angle Grain Boundaries (LABGs, <15°) especially between 2-5°. It indicates that a high fraction of dislocations induced by the extrusion process remained. A small fraction of twins (less than 1%) is also identified in the starting Cu-ETP sample.
Fig. 1. Inverse Pole Figure (IPF) of the initial Cu-ETP material.
Fig. 2. Grain Boundary (GB) and Low Angle Grain Boundary (LABG) maps extracted from EBSD analysis in the as-received Cu-ETP half hard extruded copper.
2.3 As-received Mechanical Properties
Mechanical tests have been carried out on Ø9*15 mm cylindrical samples in compression configuration at different strain rates (Figure 3). The curves corresponding to the two slowest strain rates have been obtained using a conventional press in Quasi-Static regime (Q.S.) and a high-speed press. The two fastest ones resulted from a Direct Impact Hopkinson Pressure Bar tests following a procedure introduced in [4] and revisited in [5] that allows strain rates regime up to some 104 s-1. Curves on Figure 3 show a strain rate sensitivity
of the yield stress from 180 MPa at 6.0.10-4 s-1 to
340 MPa at 6.3-9.8.103 s-1.
0 10 20 30 40
0 100 200 300 400 500
Compression tests results of as-received material
Tr
ue S
tr
ess (
M
Pa)
True Plastic Strain (%)
έ = 6.0.10-4s-1
έ = 2.59 s-1
έ = 1.8-2.5.103s-1
έ = 6.3-9.8.103s-1
Fig. 3. Initial mechanical properties of Cu-ETP determination in a wide strain rate regime.
3 Dynamic SPD experimental works
3.1 Description of the Direct Impact Configuration
3.1.1 Test bench and configuration
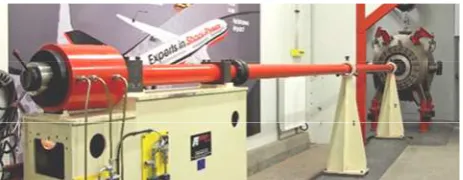
The objective of the experimental configuration is to submit the sample cylinder to a high strain rate compression using a direct impact technique. The impactors are made of high-strength steel and have been launched using a single stage Light Las Gun (LGG) that is presented in Figure 4. The versatile design of this gun makes it configured with different barrel diameters from Ø60 mm to Ø350 mm to fulfill test requirements with numerous types of projectiles or targets.
A schematic description and a picture of the experimental set-up are proposed in Figure 5 and Figure 6. The cylindrical specimen is placed on an anvil rigidly attached to a momentum trap steel barrel. A steel stopping ring with a 4 mm thickness is placed around the specimen to limit the deformation. Specimen positioning was done using a laser alignment through the launch tube on the anvil system (Figure 6-left).
Fig. 4. TITAN Ø60.0 mm Single Stage Light gas gun.
PDV probe Impactor
Sample
camera Sabot
Fig. 6. Picture of the anvil and rear momentum trap barrel (left) and detail view of the initial Ø18.0 * 16.0 mm specimen set-up on the anvil (right).
3.1.2 Diagnostic Tools
A high-speed camera rated at 120,000 frames/s is used to analyze the behavior of the specimen all along the compression process until projectile rebound. The velocity evolution of the impactor was measured using a Photon Doppler Velocimetry (PDV) probe (Figure 5).
3.1.3 Tests Conditions
Several tests have been performed but only two (TI1250 & TI1251) have been selected and detailed in this paper (Table 1). The four columns give, from left to right, the shot number, the initial dimensions of the copper specimen, the total weight of the projectile and the impact velocity. Those last parameters have been selected such as to get different strain and strain rate regimes during the DPD.
Table 1. Test conditions of the Ø18*16mm Cu-ETP specimen.
Shot # dimensions Initial (mm)
Projectile weight
(kg)
Impact velocity (m/s) TI1250 Ø17.99*15.93 2.698 52.4 TI1251 Ø17.97*16.01 4.846 32.2
3.2 Experimental results
3.2.1 Recovered samples
All the specimens have been safely recovered and no rebound has been induced during all tests. Shape comparisons between the initial Ø18*16 mm cylinder and recovered samples are proposed on Figure 7. Pictures are presented such that the impact side is on the top, side view in the middle and anvil side on the bottom. Both specimens reveal a homogenous deformation up to 129% for TI1251 and 139% for TI1250 with respectively 34.1±1.0 and 35.6±1.0 mm final diameters.
Fig. 7. Pictures of initial (left), TI1251 (middle) and TI1250 (right) DPD specimens: Top: impact side, middle: side view; bottom: anvil side.
3.2.2 High-speed camera records
High-speed camera records on both tests have shown that plastic deformation was roughly uniform on both sides all along the process (Figure 8). The radial deformation is faster on the anvil side but recovered samples have homogeneous final shapes with approximately the same diameter on both sides.
Fig. 8. High-speed camera records: Top: TI1251 test (100 µs steps); Bottom: TI1250 test (50 µs steps).
4 Microstructure analysis after DPD
4.1 Material texture
tests but evaluation of this value is detailed in the following paragraphs using simulations investigations.
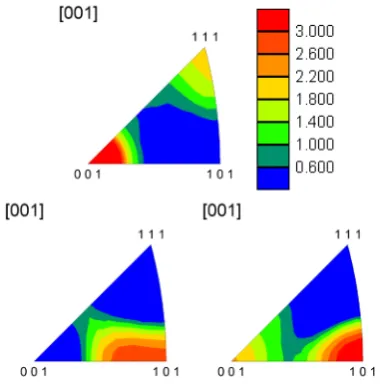
Fig. 9. IPF distribution comparison between as-received copper (top), after 2.5-3.2.103s-1 DPD (bottom-left) and after
3.0-6.5.103s-1 DPD (bottom-right).
4.2 Misorientations
Image Quality (IQ) + boundary maps are extracted from EBSD investigations and shown on Figure 10. These maps provide useful visualizations of microstructure. In particular, DPD deformed materials show a large increase of the fraction of LAGBs inside grains, corresponding to efficient dislocation storage. The test (TI1251) with the lowest dynamic strain rate leads higher LABG’s fraction than the other DPD specimen (TI1250), which is in line with the occurrence of DRX.
The corresponding comparison of the distribution of misorientations across the boundaries is displayed on Figure 11.
5 Simulation works
5.1 Finite Element set-up and models
Simulations have been done with LSDYNA software. The complete experimental set-up has been reproduced from the projectile up to anvil support in 2D-axisymetric configuration
Figure 12 gives some views of the meshing used. This mesh is a full quadrangular element and a mesh size between 0.01 (impact area) and 2.0 mm (outside of impact area).
Cowper-Symonds (C.S.) [6], Johnson-Cook (J.C.) [7] and Zerilli-Armstong (Z.A.) [8] strength models have been selected to reproduce specimen behavior in DPD tests.
The C.S. includes strain hardening and strain rate effects, the J.C. adds thermal softening with an uncoupling relation and Z.A. includes all those aspects with strain rates and thermal softening coupled.
Fig. 10. Grain Boundary (GB) and Low Angle Grain Boundary (LABG) for DPD proceed specimens (bottom-left: TI1251 at 2.55-3.2.103 s-1; bottom-right: TI1250 at 3.0-6.5.103 s-1).
Fig. 11. Comparison of the distributions of misorientation angles across boundaries between initial and the two DPD specimens.
Fig. 12. Meshing view of the initial set-up: Left: Specimen between impactor and anvil; right: detail of specimen fine mesh.
5.2 Impactor deceleration comparisons
Impactor velocity diagrams measured with the PDV probe during the tests are compared with simulations on Figure 13.
The two pictures show that the three models manage to reproduce the deceleration of the projectile during all the DPD process but J.C. model is considered to be the most accurate.
5.3 Simulations of DPD Process
Snapshots every 100 µs of effective plastic strain in the specimen during TI1251 simulations with J.C. model are shown on Figure 14. The scales are adjusted on each picture to highlight the quasi-uniformity of the plastic strain during the DPD process. Nevertheless, a discrepancy of 5% effective plastic strain is obtained at the end of the TI1251 test in the whole specimen.
0 100 200 300 400 500 600 700
0 10 20 30 40
Impactor velocity (m/s) versus time (µs): comparison between TI1251 test and simulations with the 3 strength models
Ve lo cit y ( m /s ) Time (µs) TI1251-Test
LSDyna - C.S. LSDyna - J.C. LSDyna - Z.A.
0 50 100 150 200 250 300 350
0 10 20 30 40 50 60
Impactor velocity (m/s) versus time (µs): comparison between TI1250 test and simulations with the 3 strength models
Vel oc ity ( m /s) Time (µs) TI1250-Test LSDyna - C.S. LSDyna - J.C. LSDyna - Z.A.
Fig. 13. Comparison of impactor deceleration between tests and simulations for TI1251 (top) and TI1250 (bottom) tests.
5.4 Flow Stress Comparisons
Comparison of average flow stress inside the specimens between the three strength models is proposed on Figure 15. The three models show a monotone increase of the stress versus strain approximately up to the end. The last 20 % effective plastic strain for all the tests show a higher thermal annealing with the Z.A. model compared to the C.S. and the J.C. models.
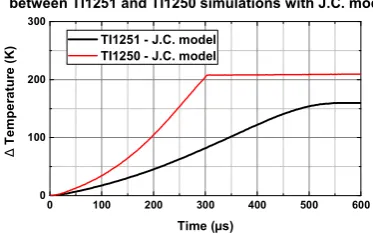
5.5 In-situ Temperature Evaluation
Temperature evolution inside specimens given by simulations for TI1251 and TI1250 with J.C. model is given in Figure 16. The gage point is located at half thickness and at a quarter radius of the specimen (R/4). The final increase of temperature of the fastest test is higher (209 K) than the slowest (165 K). Those values are in accordance with the IPFs shown on Figure 10 on which only the fastest test with a final temperature evaluated at 229 °C shows signs of DRX.
Fig. 14. TI1251 simulation with JC model: Effective Plastic strain map evolution in the specimen (100 µs interframe, scales adjusted on each picture).
0 40 80 120 160
0 100 200 300 400 500 600 700
Flow stress (MPa) versus effective plastic strain (%): comparison between the 3 strength models on the TI1251
Vo n M is es S tr es s ( M Pa)
Effective plastic strain (%) LSDyna - C.S. LSDyna - J.C. LSDyna - Z.A.
0 40 80 120 160 200
0 100 200 300 400 500 600 700 800
TI1250: Flow stress (MPa) versus effective plastic strain (%): comparison between the three strength models
Vo n M is es S tr es s ( M Pa)
Effective plastic strain (%) LSDyna - C.S. LSDyna - J.C. LSDyna - Z.A.
Fig. 15. Comparison of average flow stress given by the 3 models for TI1251 (top) and TI1250 (bottom) tests.
0 100 200 300 400 500 600
0 100 200 300
Temperature increase (K) versus time (µs): comparison between TI1251 and TI1250 simulations with J.C. model
∆ Tem per at ur e ( K ) Time (µs) TI1251 - J.C. model TI1250 - J.C. model
6 Post-mortem Tensile Properties
Quasi-static tensile tests at 4.10-3 s-1 have been
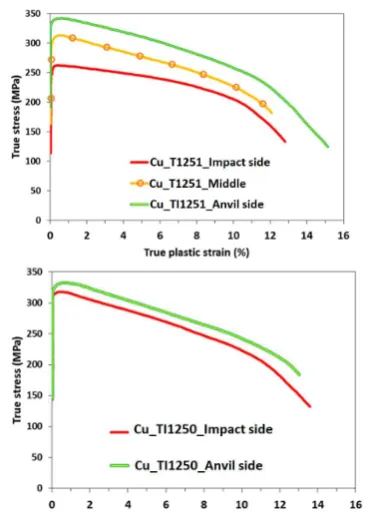
performed on recovered TI1251 and TI1250 specimens. Figure 17 gives an illustration of 18.0mm long samples and dummy part of the TI1251 specimens. The right picture shows that 0.5mm has been retrieved on each face before sample extraction to avoid any surface effect. Three samples have been machined in TI1251 specimen (Impact side, Middle, Anvil side and only two in the TI1250 (Impact side, Anvil side).
Tensile curves given on Figure 18 indicate a higher yield stress for both samples (240-330MPa for TI1251 and 315-325MPa for TI1250) in comparison with initial compression yield stress of 180MPa in Q.S. condition (Figure 4). However, both curves show no ability for strain hardening, mainly as a consequence of strain path change. Still, all samples displayed a strain to failure between 13 and 15%.
Fig. 17. Illustration of tensile and detail picture of the dummy part of the post-mortem DPD specimen.
7 Conclusion
Direct impact compression loading on a Cu-ETP cylinders have been performed to investigate the opportunity of Dynamic Plastic Deformation [DPD] to modify the material microstructure, induce grain fragmentation and high dislocation density in the material so as to get higher strength.
Experimental set-up has allowed safe specimens retrieval in dynamic regime between 2.103 and
6.5.103 s-1. Implementation of specific diagnostic tools
(high-speed video camera and velocity probes) has enriched the analysis of post-mortem disks. Cross analysis between microstructure investigations and in-situ results from dynamic simulations of the complete experiment have been done to evaluate the potential of the DPD process. The microstructure analysis shows huge microstructure evolution with a complete texture modification from [111]/[100] towards [101] preferential orientation, a building of a sub-grains structure, a patterning made possible by the combination of adiabatic heating and a high dislocation density. Signs of DRX have been found in the fastest test that has been confirmed by a 239°C peak temperature evaluation with numerical works. Quasi-static tensile tests on recovered specimens in an orthogonal direction to the impact show no strength increase as expected. Also very low strain hardening capability was observed in that direction.
It is suggested that adjusting DPD parameters (less plastic works) will be the key to optimize the
microstructure and thus offer new opportunities for material strengthening using dynamic techniques.
Fig. 18. Tensile curves of recovered TI1251 (top) and TI1250 (bottom) specimens.
This research was done with the financial support of the French National Research Agency under project ANR-14-ASTR-0029.
References
1.
Hall, E.O., Proc. Phys. Soc. London.64p747–753, (1951)2. Petch, N.J., J. Iron Steel Inst. London. 173, p25–28 (1953)
3. Azushima A., Kopp R., Korhonon A., Yang D.Y., Micari F., Lahot G.D., Yanagimoto J., Tsuji N., Rosochowski A and Yanagida A., CIRP Annuals – Manuf. Tech., 57, 716-735 (2008)
4. Dharan C.K.H., Hauser F.E., Exp. Mech., 10 p370-376 (1970)
5. Klepasczko. J.R., Inst. of Fund. Tech. Research Polish Ac. Of Sci. (2001)
6. Cowper G. and Symonds P., Tech. Rep., Division of Applied Mathematics, Brown University, Providence, RI, USA, (1952)
7. Johnson G.R., Cook W.H., In: Proc. 7th International Symposium on Ballistics, p541–547 (1983)