Analysis of Software Estimation Method: Function point
and Use case point
Sangeetha K 1, Prof. Pankaj Dalal2
1
M Tech Scholar (Software Engineering), Department of Computer Engineering, Shrinathji Institute of Technology & Engineering, Nathdwara-313301, India
2
Professor, Department of Computer Engineering, Shrinathji Institute of Technology & Engineering, Nathdwara-313301, India
Abstract
Effort estimation has been used for planning and monitoring project resources. As software grew in size and complexity, it is very difficult to predict the development cost. There is no single technique, which is best for all situations. A careful comparison of the results of several approaches is necessary to produce realistic estimates. The use of workforce is measured as effort and defined as total time taken by development team members to perform a given task. It is usually expressed in units such as man-day, man-month, and man-year, which is a basis for estimating other values relevant for software projects, like cost or total time required to produce a software product. This paper shows comparison among the different estimation techniques, specifically on function point method and use case method.
Keywords: Effort estimation, FP (Function Point), UCP (Use case Point), LOC, PDR, Productivity
I.
Introduction
Effort estimation is a critical activity for planning and monitoring of software project development focusing on time and within budget.The major cost factor in software industry is cost of manpower in most cases. The estimating development effort is key factor to manage and control of a software project management. The recent survey shows that nearly one-third projects overrun their budget and late delivered and two-thirds overrun their original estimates. Accurately determining how much effort and time required for project is a critical and important issue for every stakeholder. Hence the stakeholders cannot make realistic hardware-software trade-off analyses during the system design phase. This may lead to optimistic over promising on software development and the inevitable overruns and performance compromises as a consequence.
II.
Related workDifferent studies have been published during the last 30 years comparing modelling techniques for software cost estimation.
Prior to 1970, effort estimation was done manually by using Thumb rules or some algorithms which were based on Trial and error [1]. During early 1970’s the first automated software estimation tool had been
built. This prototyping composite model is
COCOMO (Constructive Cost Model) developed by Barry Boehm [1].
Function Point Analysis for estimating the size and development effort had been developed in 1975. 1984, IBM had done a major revision of his function point metric which is basis of today’s function points [1]. 1985, Caper Jones extended the concept of Function Point to include the effect of computationally complex algorithms [7]. 1986, IFPUG (International Function Point Users Group) was founded in Toronto, Canada due to rapidly growing usage of Function Point Metrics. 1993, the new version of COCOMO was introduced called COCOMO 2.0 which emerged in 1994 [8].
Mukhopadyay et al. [4] used Kemmerer’s project data set and found that their analogy-based model Estor, using case-based reasoning (CBR), outperformed the COCOMO model. Srinivasan et al. [5] included regression trees, artificial neural networks, function points, the COCOMO model, and the SLIM model in their comparison. They used the COCOMO data set (63 projects from different applications) as a training set and tested the results on the Kemerer data (15 projects, mainly business applications). The regression trees outperformed the COCOMO and the SLIM model. They also found that artificial neural networks and function point based prediction models outperformed regression trees. Using a combination of the’ COCOMO and the Kemerer data sets, Briand et al. [6] compared the COCOMO model, stepwise regression, and Optimized Set Reduction (OSR), which is a non-parametric technique based on machine learning. OSR outperformed stepwise regression and the COCOMO model.
2007, different methods were introduced for estimating the effort. The average accuracy of expert
ISSN 2348 – 7968 judgment based effort estimates was higher than the
average accuracy of models [9]. 2008, Parvinder S. Sandhu et.al. focused on predicting the accuracy of models, as Neuro-Fuzzy system was able to approximate the non-linear function with more precision. So, neuro-fuzzy system was used as a soft computing approach to generate the model [10]. During 2009, some theoretical problems were identified that compared estimation models. It was invalid to select one or two datasets to prove validity of a new technique [11].2010, different estimation techniques were combined to reduce the error and keep control over the deviation of estimates away from actual [12, 13].
2011, many estimation techniques were proposed and used extensively by practitioners for use in Function Oriented Software development [14].
III.
Effort Estimation
Estimating is the process of forecasting or approximating the time and cost of completing project deliverables or the task of balancing the expectations of stakeholders and the need for control while the project is implemented.
A. Function point method
The function point method first assigns a weight to each unique input type, output type, logical file, external interface file, and external query handled by an application to reflect the "level of complexity." The total score for all function types, called the function count, and is then modified using the total ratings (TR) of 14 processing complexity characteristics to account for the different kinds of system requirements and development environments.
A simple linear regression can be used to estimate person-months as a function of function points [3]. The two dominant problems associated with this metric involve the effort required to collect function point data and the difficulty in obtaining consistent estimates from multiple individuals [2].
B. Use case point method
UCP was first proposed by Gustav Karner in 1993 that developed from Function Point Analysis for
object-oriented applications [15] [16]. UCP
calculation process requires the use case diagram and use case descriptions. It is a well-documented approach for estimating software development
activities. It is based on the same principles of
Function Point estimation and has the same advantages. It has turned out that Use Case Point
(UCP) estimation is as reliable as Function Point estimation. It provides the ability to estimate the man- hours a software project requires from its use cases. By using UCP estimation we are able to produce a reliable estimate very early in the development cycle
IV.
Data Set
In our work we have studied ten different systems along with their technical requirement as well as various environmental factors, the development teams’ experience and knowledge. We have determined the complexity of each input, output, inquiry, internal logical file, external files of all systems and study the use case model diagrams of all systems and calculated unadjusted function point count (UFC), unadjusted use case weight (UUCW) and unadjusted actor weight (UAW). The function point counts were calculated with the help of general system characteristics (GSC). The data collected from all of our case studies are shown in the table 1.
Sr. No
Proj ID
FP
ILF EIF EI EO EQ GSC Count
1 A 14 5 17 14 11 23 53.68
2 B 28 5 9 8 6 42 59.92
3 C 28 10 16 9 12 43 81.00
4 D 21 5 12 12 11 47 68.32
5 E 28 5 24 9 7 43 78.84
6 F 21 0 10 9 3 49 49.02
7 G 14 5 10 13 12 44 58.86
8 H 21 15 22 10 4 47 80.64
9 I 21 5 10 9 8 36 53.53
10 J 21 5 21 10 14 33 69.58
Table 1: Function point matrix
Similarly by using the unadjusted actor weight, unadjusted use case weight, different technical and environmental factors of the system the use case point count were calculated. These are shown in the table 2:
Sr. No
Proj ID
UCP
UUCW UAW TCF ECF Count
1 A 75 6 0.875 0.89 63.08
2 B 60 6 1.05 0.92 66.65
3 C 90 13 1.05 0.935 101.1
4 D 75 7 1.04 0.935 79.7
5 E 100 9 0.98 0.92 98.3
6 F 55 6 1.095 0.875 58.4
7 G 60 9 0.97 0.965 64.59
8 H 95 6 1.04 0.965 101.4
9 I 65 5 0.98 0.89 61.05
10 J 90 12 0.965 0.935 92.03
Table 2: Use Case point matrix
From this data we have calculated the development effort under two methods for different systems, which is shown in the table 3
Sr.
No System
FP UCP
System Size (Count)
Effort (Person-months)
System Size (Count)
Effort (Person- months)
1 A 53.68 6.31 63.08 7.01
2 B 59.92 7.27 66.65 7.41
3 C 81 10.73 101.1 11.23
4 D 68.32 8.61 79.7 8.86
5 E 78.84 10.36 98.30 10.92
6 F 49.02 5.61 57.90 6.43
7 G 58.86 7.11 64.59 7.18
8 H 80.64 10.67 101.10 11.23
9 I 53.53 6.29 61.05 6.78
10 J 69.58 8.82 92.03 10.23
Table 3: Development effort matrix in both methods
V.
Data Analysis
We have analysed the different attributes of various systems under function point method and use case point methods. The different attributes selected for analysis are Effort, Lines of Code, Product Delivery Rate (PDR), Productivity, and Time for development.
Effort: Effort is the software development effort calculated from function point as well as use case point which is expressed in Person Hours (PH).
Lines of Code: It is the number of lines in the source code of the particular software. We have taken the programming language as Java for developing software.
Product Delivery Rate: It is the delivery rate of the product, is hour of effort per size of the project.
Productivity: It is the rate of production of the particular project, is size of the project expressed in function point or use case point per hours of effort
Time: It is the time taken to develop the project which is expressed in months.
We have calculated the value of these matrixes in both the methods. The value of different matrix in function point method is shown in the table 4 and in use case point is shown in the table 5:
A. Effect of system characteristics on the estimation of size
We have analysed the effect of the different technical and environmental characteristics on the estimation of size in function point method as well as use case point method.
Sr N o
Pr oj ID
FP
Count Effort
(PH) LOC PDR Produc
tivity Time
1 A 58.58 1271.47 2695 21.7 0.046 5.78
2 B 59.92 1309.11 2756 21.85 0.046 5.83
3 C 81 1931.32 3726 23.84 0.042 6.57
4 D 68.32 1550.51 3143 22.69 0.044 6.14
5 E 78.84 1865.14 3627 23.66 0.042 6.5
6 F 49.02 1010.39 2255 20.61 0.049 5.38
7 G 58.86 1279.31 2708 21.73 0.046 5.79
8 H 80.64 1920.26 3709 23.81 0.042 6.56
9 I 53.53 1131.88 2462 21.14 0.047 5.57
10 J 69.58 1587.5 3201 22.82 0.044 6.19
Table 4: Matrix in function point method
Sr. No
Pr oj ID
Ucp
Count Effort (PH) LOC
PD R
Prod uctivi
ty
Time
1 A 69.21 1384.2 3184 20 0.05 6.17
2 B 66.65 1333.0 3066 20 0.05 6.08
3 C 101.1 2022.0 4651 20 0.05 7.18
4 D 79.7 1594.0 3666 20 0.05 6.53
5 E 98.30 1966.0 4522 20 0.05 7.10
6 F 57.90 1158.0 2663 20 0.05 5.75
7 G 64.59 1291.8 2971 20 0.05 6.01
8 H 101.10 2022.0 4651 20 0.05 7.18
9 I 61.05 1221.0 2808 20 0.05 5.87
10 J 92.03 1840.6 4233 20 0.05 6.92
Table 5: Matrix in use case point method
1) Function Point Analysis
In function point analysis 14 characteristics of the system is used for calculating the function point from unadjusted function point. General system characteristics can be formed from these values.
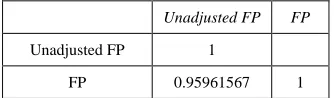
Then we have performed correlation analysis between unadjusted function point count (UFP) and function point count FP. The result of this analysis is shown in the table 6:
Unadjusted FP FP
Unadjusted FP 1
FP 0.95961567 1
Table 6: Correlation between UFP & FP
ISSN 2348 – 7968
2) Use Case Point Analysis
In use case point analysis, 13 technical factors and 8 environmental factors are considering for adjusting the unadjusted UCP to UCP.
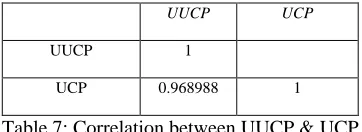
The result of the correlation analysis performed on unadjusted UCP and Adjusted UCP is given in the table 7:
UUCP UCP
UUCP 1
UCP 0.968988 1
Table 7: Correlation between UUCP & UCP
We can conclude from the table 6 that the characteristics of the system are having more effect on use case point than function point.
Similarly we have performed analysis between different attributes under function point method and use case point method and got the following results:
Estimation of effort in ucp is showing more value than fp
Estimation of LOC in ucp is showing more value than fp
Estimation of PDR ( Product Delivery Rate) in ucp is showing less value than fp
Estimation of Productivity in ucp is showing more value than fp
Estimation of Time of Development in ucp is showing more value than fp
Mostly the matrixes are showing more value in the use case point method because of more clarity in assigning the complexities.
Similarly we have checked the relationship between different matrix in function point and use case point method and the results are follows.
When comparing the size and effort, fp is giving more correlation than ucp
In case of size & LOC , fp is giving more correlation than ucp
In case of size and Time of development, fp is giving more correlation than ucp
In case effort and LOC, ucp is giving more correlation than fp
In case of LOC and Time of development, ucp is giving more correlation than fp
VI.
Conclusion
A number of different models and effort estimation methods have been developed in the past four decades. This clearly indicates the awareness among the researchers of the need to improve effort estimation in software engineering. Many factors have impact on the software development process. These factors are not only human, technical but also political and their impact can never be fully predicted. The even insufficiently accurate estimates are far better than none. We have illustrated result of two approaches for measuring the size in the estimation process in our work. If the estimation is done accurately, it decreases error. We have analysed the values of different matrix under function point as well as use case point method. The relationship among the matrix of these methods shows the practical results. Hence we conclude that the estimation process through use case point is better than the function point. The requirement & design is more clearly shown in use case point model than in function point model. The estimation using use case point shows practical reality of development. Hence the accuracy of estimation depends upon method used for estimation also.
References
[1]. Boehm, B. Software Engineering Economics. Englewood CI@, NJ Prentice-Hall (198 1).
[2]. Kemerer, C.F. An empirical validation of software cost estimation models. Communications of the ACM vol. 30, no. 5 (May 1987) 416-429.
[3]. Albrecht & Gafney. Software function, source lines of code, and development effort prediction: a software science validation, IEEE Transactions on Software Engineering 9, 6 (1983) 639-648.
[4]. Mukhopadyay, T., Vicinanza, S.S., Prietula, M.J. Examining the feasibility of a case-based reasoning model for software effort estimation. MIS Quarterly (June 1992) 155-171. [5]. Srinivasan, K., Fisher, D. Machine learning approaches to
estimating software development effort. IEEE Transactions on Software Engineering, VOI. 21, no. 2 (February 1995) 126-137.
[6]. Briand, L.C., Basili, V.R., Thomas, W.M. A pattern recognition approach for software engineering data analysis. IEEE Transactions on Software Engineering, vol. 18, no. II (1992) 931-942
[7]. Allan J. Albrecht May 1984. AD/M Productivity
Measurement and Estimation Validation, IBM Corporate Information Systems. IBM Corp.
[8]. Barry W. Boehm, Bradford dark, Ellis Horowitz, Chris Westland, Ray Madachy and Richard Selby. Cost Models for Future Software Lifecycle Processes: COCOMO 2.0 Annals of Software Engineering. Volume 1, pp., 57-94, 1995. [9]. Magne Jorgensen. May 2007 Forecasting of Software
Development Work Effort: Evidence on Expert Judgment and Formal Model.
[10].Parvinder S. Sandhu, Porush Bassi, and Amanpreet Singh Brar. 2008. Software Effort Estimation Using Soft Computing Techniques. World Academy of Science, Engineering and Technology 46 2008.
[11].Barbara Kitchenham, Emilia Mendes. 2009. Why Comparative Effort Prediction Studies may be Invalid © ACM 2009 ISBN: 978-1-60558-634-2.
[12].Vahid Khatibi, Dayang N. A. Jawawi. 2010. Software Cost Estimation Methods: A Review. Journal of Emerging Trends in Computing and Information Science.
[13].M. V. Deshpande, S. G. Bhirud. August 2010. Analysis of Combining Software Estimation Techniques. International Journal of Computer Applications (0975 – 8887)
[14].Samaresh Mishra1, Kabita Hazra2, and Rajib Mall3. October 2011. A Survey of Metrics for Software Development Effort Estimation. International Journal of Research and Reviews in Computer Science (IJRRCS)
[15].Karner, G. (1993). Resource Estimation for Objectory Projects. Objective Systems SF AB.
[16].Ibarra, G. I., & Vilain, P. (2010). Software Estimation Based on Use Case Size. Brazilian Symposium on Software Engineering, (pp. 178-187).