Yields of Dissolved Solids from Aspen=
Grassland and Spruce-Fir Watersheds in
Southwestern Alberta
TEJA SINGH
Highlight: Water quality samples representing variousjlow conditions were collected from the main creeks of Streeter and Marmot experimental watersheds in southwestern
Alberta. Total dissolved solids were determined gravimetrically after evaporating aliquots of filtered samples. An excellent correlation between stream discharge and yield of dissolved solids was found in the two watersheds. The regression models thus established were used to estimate the yields of total dissolved solids from the streamjlow data on a daily, monthly, and annual basis. The highest yield occurred in the month of June and the lowest during the low-flow months of winter. The yield of total dissolved solids transported annually amounted to 27 metric tons per square kilometerfor aspen-grassland vegetation, compared to 69 metric tons per square kilometer for spruce-fir forest.
Transportation of inorganic solutes (dissolved solids) by running waters is an important hydrologic process. It is an indicator of the chemical weathering of the earth’s outer crust and contains essential information on the quantities of constituents that are continuously being dislodged and removed from the source areas by stream waters.
Although many of the solute mate- rials are also being replenished gradual- ly the natural inputs may not be ade- quate to replace the losses, especially when such losses have been accelerated by the activities of man. Excessive exports of dissolved solids over pro- longed periods can result in marked deterioration in site quality through loss of nutrients. Although acutely conscious of erosion, land managers have seldom considered the harzards of nutrient loss (Cooper, 1969). Accelerated loss of nutrients from upstream areas can also
create problems in lower reaches
through enrichment of streams because dissolved solids are the basis of plant growth (Hynes, 1969).
At present there is little available information on the amounts of dis- solved solids transported annually to rivers and oceans from range and forest __-_
The author is research scientist, Northern Forest Research Centre, Canadian Forestry Service, Environ- ment Canada, Edmonton, Alberta, Canada, T6H 3S5. The paper was presented at the 28th Annual Meeting ofthe Society for Range Management, February l&14, 1975, Mexico City, Mexico.
Manuscript received July 31, 1975.
lands. Amounts of total dissolved sol- ids carried in the flow of the large rivers of the world have been estimated by
Living
stone ( 1963). These estimates, however, are for large drainage basins climatically much different from the cool. upland catchment areas reported in this study. Surprisingly, even when the concentration of solutes is minimal, the total yearly transported quantities of dissolved constituents from undis- turbed wildlands are large (Singh and Kalra, 1974).It is essential to know the yields of dissolved solids from source areas be- cause, apart from their importance mentioned above, the undisturbed for- ests set a base line for water quality. The present study was undertaken to provide such base lines for two impor- tant range and forest types of south-
western Alberta as represented by
Streeter and Marmot basins (Figs. 1 and 2). These basins are the experi- mental watersheds established under the International Hydrological Decade and the Alberta Watershed Research Program to study the hydrologic and related effects of land management. Streeter (area 5.96 km2) represents the montane aspen (Populus tremuloides
Michx.) forest and associated grass- lands of the foothills, while Marmot
(area 9.40 km2) is typical of the spruce- fir (Picea engelmannii Parry, P. glauca (Moench.) Voss, and Abies lusiocarpa (Hook.) Nutt.) forests found JOURNAL OF RANGE MANAGEMENT 29(5), September 1976
along the eastern slopes of the Rocky Mountains. Both basins contain range- lands: in Streeter the grasslands com- prise 44% of the total area and in Marmot alpine meadows occupy 32% of the area.
The objective of the study was to determine the amounts of total dis- solved solids being drained annually fmm the two watersheds. In addition, a comparison was also made of the yield patterns throughout the year.
Study Areas and Methods
Study AreasDetailed information on geology, soils, vegetation, and meteorology of the two watersheds has been provided by Steven- son (1967), Beke (1969), Kirby and Ogilvie (1969), and Storr (1970), respec-
tively. The hydrology of these watersheds has been described by Jeffrey ( 1965), Singh et al. ( 1969), and Singh and Kalra (1972).
The bedrock of Streeter Basin is the Porcupine Hills Formation of early Tertiary
age. The formation consists of fine- to coarse-grained, flaggy to massive, cross- bedded, argillaceous sandstone. The sur- ficial material is a light brownish-grey to brown, silty to sandy, calcareous, benton- itic till, containing a few scattered lime- stone and/or granite boulders. The surficial material thickens down valley to approxi- mately 30 m at the base of the basin. The bedrock is actively involved in the storage and conductance of groundwater to differ- ent degrees in various parts of the basin. Marmot watershed is formed of predomi- nantly fine-grained, well-cemented Meso- zoic sedimentary rocks of generally low permeability. The bedrock consists of silt- stone, shale, interbedded sandstone and shale, coal, cross-bedded sandstone, and conglomerate. The surficial materials in- clude glacial and post-glacial deposits. Glacial deposits cover the major part of the watershed and consist mainly of a mantle of stony till. The formations from the top of the watershed to the confluence area at the base are Blairmore, Kootenay, Fernie, Spray River, and Rocky Mountain.
The dominant species of the grasslands in Streeter Basin are Idaho fescue (Festuca iduhoensis Elmer), Parry danthonia (Dan- thoniapanyi Scribn.), and timothy (Phle- urn pratense L.); the main associated spe- cies are Columbia needlegrass (Sripa col- umbriana Macoun), awned wheatgrass (Ag- ropyronsubsecundum (Link) Hitch=.), wild bxgamot (Monardafisrulosa L.), northern txdstraw (Galium bore& L.), rough fes- cue (Fe-mm .scabrella Ton.), silvery Iu- pine (Lupinus argenteus Push), and yar- row (Achilles millefolium L.). The forest vegetation is mostly aspen (Populus frem- loides Michx.); small portions of the water- shed are dominated by black poplar (Popu- /us trichocarpa T. & G.), Douglasfir (Pseudorsuga menziesii (Mirb.) France), and willow-birch (Salix spp:Betula occi- dentalis Hook.). The understory vegetation consists mainly of marsh reedgrass (Cala- magrosti.x canadensis (Michx.) Beauv.), prickly rose (Rosa acicularis Lindl.), hairy wildrye (Elymus innovarus Beal), snow- berry (Sympkoricqos a/bus (L.) Blake), cream-colored vetchling (Larkyrus ockro-
leucus Hook.), American vetch (Vicia am- ericuna Muhl.), smooth wild strawberry (Frayaria gfauca (S. Wats.) Rydb.), fire- weed (Epilobium anyustifolium L.), and showy aster (Aster conspicuus Lindl.).
The forest vegetation of Marmot water- shed is generally overmature spruce-fir (Picea en,&mmni Parry, P. gfauca (Moench) Voss, and Abirs lasiocarpa (Hook.) Nutt.). Lodgepole pine (Pinus conforfa Dougl. var.
latifolia
Engelm.) is a frequent concomitant and occupies a large portion of the lower area in the eastern part of the watershed. Aspen occurs occasional- ly with the young lodgepole pine. Near timberline the forest is mostly alpine larch (Larix lyaNii Parl.) associated with the alpine fir. The ground vegetation includes grouseberry (Vaccinium scoparium Lei- tw& false azalea (Menziesia ferruginea Smith), clubmoss (Lycopodium annorinum L.), feather moss (Hylocomium splendens (Hedw.) B.S.G.), bunchbeny (Cornus canadensis L.), pinegrass (Calamayrosris rubescensBuckl.), bearberry(Arctosrapky- los uva-ursi (L.) Spreng), horsetail (Equi-~furn spp.), willow (Salti spp.), peat moss (Sphagnum spp.). Labrador tea (Ledum groenlandicum Oeder), and dwarf birch (Bet& @zndufosa Michx.). The alpine meadows are dominated by a large number of sedges, grasses, and forbs.
Methods
Samples for determining the concentra- tion of total dissolved solids were taken from the main Marmot Creek and the main Streeter Creek gauging stations. Discharge of the streams was also obtained at the time of sampling. Although sampling was spread over the entire year, the intensity of sampling during the high-flow months was greater than that during the low-flow months. Sampling from Marmot watershed continued over a longer period (May 1963 to December 1971) than for Streeter water- shed (luly 1966 to October 1969). Most of the flow conditions were adequately repre- sented in the sampling scheme for the two watersheds.
The total concentr?tion of dissolved sol- ids was determined by the residue-on- evaporation method (Hem, 1970) at the Water Survey of Canada Laboratory in Calgary, Alberta. The drying temperature used was 105°C. The mean and standard deviation of the monthly and annual streamflows were calculated for each water- shed.
Linear regression models of the form Y = aY + b, where X is streamflow (litreisec)
and Y s the yield of dissolved solids (kg/ day), were fitted to the data by the method of least squares. Goodness of fit and the standard error of coefficient a were also determined (Snedecor, 1956). The models thus established were used for estimating the amounts of dissolved solids being drained from the two watersheds on a mean daily basis in varous months and years. The mean and standard deviation of the esti- mated amounts were also determined.
ReSUltS
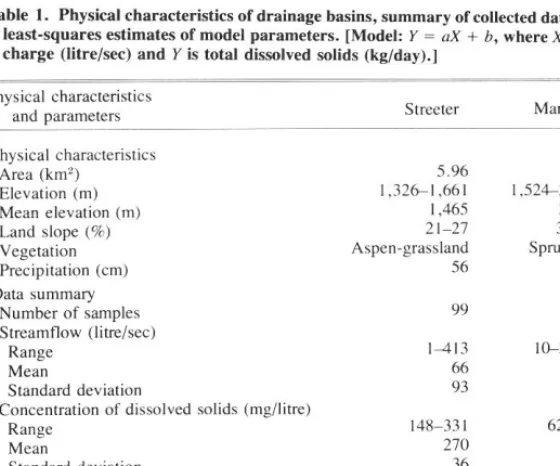
The physical characteristics of the two watersheds and the estimates of the model parameters based on 371 sam pies for Marmot and 99 samples for Streeter are given in Table 1. The mean Streamflow in Marmot for each month is shown in Table 2 and for Streeter in Table 3.
The mean daily exports of the dis- solved solids for the two watersheds as estimated from the models are pi-
sated inTables4and5. Themeandaily stt’eamflow and the export of total dis- solved solids on an annual basis are given in Table 6.
Fig. 2. Murmiii Buvn, in~ated in Ik Kurmn”\iir KI”Pr “die), ir ‘ypcu! 0, the mrurc/ir,“r~,irs and “,pm ,neod”irr “hX ,hr ens,ern .dope <g ,he Rocky Mou,,rains.
Table 1. Physical characteristics
of
drainage basins, summary ofeonected data, and spruce-fir watershed. The mean highestleast-squares estimates of mode, parameters. [Madel: Y = ax + b, where x is ,Jis.
charge (litrelsec) and Y is total dissolved solids (kg,day).] mean monthly yield occurred during
May in Streeter and during July in
Physical charactetistlcs Marmot. Yields were very low during
and paranleten sweeter M,Xlll”t the winter freeze-up, the lowest yield
_
for Streeter occurring in February and Physical charactenstlcs
Area (km’, 5.96 9.4” for Marmot in March.
Elevation (In) 1,32&1,66I / ,52&2,743
Mean elevation (In) 1,465 2,113 Discussion
Land slope (%I 21-27 39-52
Vegetation ASpe”-gra~Sl*“d Spruce-fir A number of meteorologic, geo-
Precipitation (cm) 56 90 logic, edaphic, and vegetative factors
Data summary determine the concentration and yield
Number of samples 99 371 of dissolved solids. Precipitation and
Streamnow (litreiaec) temperature are the main meteorologic
Range ,413 tCu.315
Mean 66 329 inputs which influence the solubility
Standard deviation 93 384 and rate of dissolution of rock minerals.
Concentration of dissolved solids Cmgilitre) Water held longer in soil and bedrock is
Range 148-331 62-244 likely to have a higher concentration of
Mean 270 17”
Standard deviation 36 40 minerals than water delivered quickly
Model parameters and SIB1ISUCS~ to streams. There are inherent vaia-
22.5277 1” X”“” tions in these and other factors between
E 1.8518 414.2726 the two watersheds.
.9902 ,981” The higher yields of dissolved solids
Table 2. Mean streamflow (litre/sec), Marmot watershed.
Month 1966 1967
Year
Standard
1968 1969 1970 1971 Mean deviation
January February March April
May June July August September October November December
28.3 18.4 16.1 21.8 13.6 14.2 18.7 5.6
22.1 16.1 14.2 17.8 13.6 13.0 16.1 3.4
22.4 14.2 13.9 16.1 11.6 11.9 15.0 4.0
33.4 15.3 16.7 56.6 11.9 25.8 26.6 16.7 291.7 169.9 147.2 354.0 138.7 294.5 232.7 91.8 569.2 804.2 532.3 594.6 617.3 821.2 656.5 1 24.4 300.1 311.5 271.8 472.9 195.4 226.5 296.4 97.0 102.8 88.9 133.1 90.6 62.3 73.6 91.9 24.6 56.6 39.4 104.8 48.1 39.6 39.6 54.7 25.5 48.7 31.7 84.9 36.8 31.1 31.1 44.1 21.1
32.0 24.1 39.6 27.7 22.4 23.2 28.2 6.6
24.4 17.8 28.3 18.7 17.6 15.3 20.4 4.9
Table 3. Mean streamflow (litre/sec), Streeter watershed.
Month 1966 1967
Year
Standard
1968 1969 1970 1971 Mean deviation
January February March April
May June July August September October November December
_* 0.6 2.8 5.7 0 0 1.8 2.5
- 1.7 0.8 4.0 0 0 1.3 1.7
- 6.8 2.0 4.5 0.3 0.6 2.8 2.8
- 8.5 3.4 73.6 6.2 5.9 19.5 30.3
- 113.0 4.5 76.5 18.4 6.8 43.8 48.5
- 161.1 9.9 93.4 39.6 19.0 64.6 62.9
25.5 27.5 9.9 135.9 20.7 9.6 38.2 48.5
9.6 6.5 7.1 14.4 4.8 2.3 7.5 4.2
4.0 2.0 8.5 5.1 2.8 1.7 4.0 2.5
3.4 1.7 28.0 4.0 1.7 1.4 6.7 10.5
2.8 1.7 20.4 2.8 0.8 - 5.7 8.3
1.4 1.1 10.8 0.8 0.3 - 2.9 4.4
*Incomplete data.
Table 4. Mean estimated yield (kg/day) of total dissolved solids, Marmot watershed.
Month 1966 1967
Year
1968 1969 1970 1971 Mean
Standard deviation
January 720 613 589 650 561 567 617 60
February 653 589 567 607 561 555 589 37
March 656 567 564 589 540 543 577 43
April 775 579 595 1,026 543 693 702 180
May 3,564 2,249 2,004 4,237 1,913 3,595 2,927 991
June 6,561 9,099 6,164 6,836 7,081 9,283 7,504 1,343
July 3,656 3,778 3,350 5,521 2,524 2,861 3,615 1,048
August 1,524 1,375 1,852 1,393 1,087 1,209 1,407 266
September 1,026 839 1,546 934 842 842 1,005 275
October 940 757 1,332 812 751 751 891 228
November 760 674 842 714 656 665 719 72
December 677 607 720 616 604 579 634 53
Table 5. Mean estimated yield (kg/day) of total dissolved solids, Streeter watershed.
Month 1966 1967
Year
1968 1969 1970 1971
Standard
Mean deviation
January _* 15 66 129 0 0 42 56
February - 40 21 91 0 0 30 38
March - 155 47 104 8 15 66 63
April - 193 78 1,660 142 136 442 682
May - 2,547 104 1,724 416 155 989 1,093
June - 3,631 225 2,107 895 429 1,457 1,418
July 576 621 225 3,064 468 219 862 1,092
August 219 149 161 327 110 53 170 95
September 91 47 193 117 66 40 92 57
October 78 40 633 91 40 34 153 236
November 66 40 461 66 21 - 131 186
December 34 27 244 21 8 - 67 100
*Incomplete data.
precipitation area typical of spruce-fir vegetation (Table 1) in comparison to the low precipitation area represented by the aspen-grassland vegetation in Streeter watershed. Because of more rain there is more frequent flushing and leaching of dissolved materials from Marmot.
The concentration of dissolved sol- ids in Streeter waters is higher (Table
1) although the total amount of materials exported is lower than in Marmot (Table 6). The higher temperatures in Streeter (which is located at a lower elevation than Marmot) account for greater solubility of weathered prod- ucts which remain in substrata longer due to less frequent and lower rainfall. The sampled concentration of solutes in Streeter averaged 270 mg/litre as com- pared to 170 mg/litre for Marmot. The total dissolved solids in the river waters representing approximately 90% of the total streamflow in the United States have a median value of 169 mg/litre
(Environmental Protection Agency,
1973).
Quantitative and qualitative differ- ences exist in the nutrient require-
mets, decomposer microorganisms,
and nutrient cycling of plants. Among trees, perhaps the most outstanding examples of such differences are bet- ween deciduous and conifer species (Voight, 1968). The difference in con- centration of solutes in the two water- sheds suggests that large amounts of mineral nutrients remain tied up in the thick litter layer usually found under the cool spruce-fir forests.
The concentration of dissolved sol- ids in each watershed is higher in winter than in the rest of the year. This is primarily due to the presence or ab- sence of dilution effects as reported previously by Singh and Kalra (1972): Similar dilution effects have been ob- served and studied by, among others, Keller (1970) and Hall (1970), 1971). The variations in the two watersheds in streamflow and concentration ac- count for the difference in their total yields of dissolved solids when com- pared on an equal area basis. These yields amount to 27 metric tons (t)/ km” for Streeter and 69 t/km2 for Mar- mot annually. The higher water yield for Marmot more than compensates for the lower concentration of dissolved solids.
The net annual dissolved solute yields for two forest and pasture catch- ments in Wales were reported by Oxley
Table 6. Mean streamflow and estimated watersheds during the study period.
yield of dissolved Streeter Marmot
Year 1966 1967 1968 1969 1970 1971 Mean Streeter
Yield of
Streamflow dissolved solids
(m”/da y ) (kg/day)
-* -
2,393 627
786 206
2,938 767
683 180
- -
1,700 445
Marmot
Yield of
Streamflow dissolved solids
(m3/day) (kg/day)
11,059 1,797
11,154 1,809
IO,03 I 1,668
12,718 2,004
8,562 1,485
11,500 1,852
10,837 1,769
Standard
deviation 1,138 297 1,411 176
*Incomplete data.
(1974) as 77 and 45 t/km2, respective- ly. The forest catchment (0.07 km2 ) had a dominant cover of Quercus spp. over 85% of the area; the other catch- ment, more gentle in slope, had 98% of its area under pasture. The rates of chemical degradation in each case were much higher than the suspended sedi- ment yields ( 11 and 13 t/km2, respec- tively). The suspended sediment yield for the high flow period (April to Sep- tember) in the Cabin sub-basin of Mar- mot watershed averaged 23 t/km2 dur- ing 1969-1973 (R. L. Rothwell, per-
sonal communication). The gross
chemical degradation rates in both wa- tersheds were considerably higher than the yields of suspended sediment.
The trend in the hydrologic function- ing of the two watersheds is provided by the coefficient a of the model in each case. For each unit (litre/sec) increase of streamflow, the aspen-grassland water- shed shows an increase of 22.53 kg/day
compared to 10.80 kg/day for the
spruce-fir watershed. As indicated by the standard errors of the coefficient, both trends are highly significant.
Preliminary analyses as to the nature of the dissolved solids show that the waters in both watersheds are generally of the calcium-magnesium type. Data analyses in the treatment phase would show the effects of forest clearing on the composition, concentration, and yield of dissolved constituents.
As geologic, topographic, and
edaphic features are more or less fixed characteristics of an area, the vegeta- tive factors operative in the two water- sheds are the main avenues for exerting any modifying influence. The abun- dance and type of vegetation influence the rate and type of weathering by determining the extent of rock outcrops and the amount of decaying organic matter from which carbon dioxide and
humic acid may be derived (Thom- bury, 1954). Water moving through soils dissolves some of this carbon dioxide, and the hydrogen, bicarbon- ate, and carbonate ions are potent fac- tors in attacking rock minerals (Hem, 1970). Vegetation also exercises its modifying influence on temperature, which affects the rate of chemical re- actions. Large clearcuts could result in increased temperatures and reduced transpiration and interception losses. The increased activity of soil microbes due to higher temperature would favor rapid disappearance of organic fraction and consequent release of nutrients (Fredriksen et al. , 1975). The increased leaching and higher streamflows due to large clearcuts can thus be expected to increase the export of nutrients and other dissolved constituents from the two watersheds.
Manipulation of vegetation cover in either watershed will affect the nature and yield of total dissolved solids. An increase in the dissolved solids would raise the base line of chemical constitu- ents and decrease the receiving and assimilative capacity of the stream wa- ters (Environmental Protection Agen- cy, 1973) and thus have repercussions on the downstream uses of such waters and on biological communities charac- teristic of particular habitats.
Literature Cited
Beke, G. J. 1969. Soils of three experimental watersheds in Alberta and their hydrologic sig- nificance. Unpub. PhD Thesis, Univ. of Al- berta, Edmonton. 456 p.
Cooper, C. F. 1969. Nutrient output from man- aged forests. In: Eutrophication: causes, con- sequences, correctives. U.S. Nat. Acad. Sci. p. 446-463.
Environmental Protection Agency. 1973. Wa- ter quality criteria, 1972. A report of the Com- mittee on Water Quality Criteria, Environ.
Studies Board, Nat. Acad. Sci.-Nat. Acad.
Eng., Washington, D.C. 594 p.
JOURNAL OF RANGE MANAGEMENT 29(5), September 1976 405
Fredriksen, R. L., D. G. Moore, and L. A. Norris. 1975. The impact of timber harvest,
fertilization, and herbicide treatment on
streamwater quality in western Oregon and
Washington. Proc. Fourth N. Amer. Forest
Soils Conf. Lava1 Univ., Quebec, August
1973. p. 283-313.
Hall, F. R. 1970. Dissolved solids-discharge re- lationships. 2. Applications to field data. Wa- ter Resour. Res. 7:591-601.
Hall, F. R. 1971. Dissolved solids-discharge re- lationships. 2. Applications to field data. Wa- ter Resour. Res. 7:591-601.
Hem, J. D. 1970. Study and interpretation of the chemical characteristics of natural water. U.S. Dep. Interior, Geol. Surv. Water Supply Pap. 1473. 363 p.
Hynes, H.B.N. 1969. The enrichment of streams. In: Eutrophication: causes, conse- quences, correctives. U.S. Nat. Acad. Sci. p.
188-196.
Jeffrey, W. W. 1965. Experimental watersheds in the Rocky Mountains, Alberta, Canada. Int. Ass. Sci. Hydrol. Pub. 66:502-521.
Keller, W. W. 1970. Factors affecting water quality in small catchments. J. Hydrol. (N.Z.) 9:133-141.
Kirby, C. L., and R. T. Ogilvie. 1969. The forests of Marmot Creek Watershed Research Basin. Environ. Can., Can. Forest Serv. Pub. 1259. 37 p.
Livingstone, D. A. 1963. Data of geochemistry. U.S. Geol. Surv. Prof. Pap. 440-G:Gl-64. Oxley, N. C. 1974. Suspended sediment deliv-
ery rates and the solute concentrations of stream discharge in two Welsh catchments. In:
Fluvial processes in instrumented watersheds (K. J. Gregory and D. E. Walling, Eds.). Instit. British Geogr., London. p. 141-154. Singh, T., and Y. P. Kalra. 1972. Water quality
of an experimental watershed during the cali- bration period. Paper presented to the 19th
Pacific Northwest Regional Meeting, Amer.
Geophys. Union. Vancouver, B.C., October.
Singh, T., and Y. P. Kalra. 1974. Estimating yield of dissolved constituents in the streams of a mountainous watershed. Pap. No. H65 pre- sented to the Water Quality Transport Session of the 55th Annu. Meeting, Amer. Geophys.
Union. Washington, D.C., April.
Singh, T., D. A. Davis, R. D. Stevenson, and D. Storr. 1969. Rangeland hydrology re-
search in South Saskatchewan River head-
waters. Paper presented to the 22nd Annu.
Meeting, Amer. Sot. Range Manage. Cal-
gary, Alberta, February.
Snedecor, G. W. 1956. Statistical methods ap- plied to experiments in agriculture and biolo- gy. Iowa State Univ. Press, Ames. 534 p. Stevenson, D. R. 1967. Geological and ground-
water investigations in the Marmot Creek Ex-
perimental Basin of southwestern Alberta,
Canada. MS Thesis, Univ. of Alberta, Edmon- ton. 106 p.
Storr, D. 1970. A survey of water balance prob- lems, projects and progress in Alberta. In:
Proceedings, World Water Symposium, Read-
ing, England. July 1970. 10 p.
Thornbury, W. D. 1954. Principles of geo- morphology. John Wiley and Sons, New York, N.Y. 618 p.