Nearest Clustering Algorithm for Satellite Image
Classification in Remote Sensing Applications
Anil K Goswami1, Swati Sharma2, Praveen Kumar3
1
DRDO, New Delhi, India 2
PDM College of Engineering for Women, MDU, Bahadurgarh, Haryana, India 3
Stesalit Pvt. Ltd, Kolkata, West Bengal, India
Abstract- Classification of satellite images plays a vital role in remote sensing applications. Numerous algorithms have been developed and tested to classify a satellite image. The main purpose of these algorithms is to lessen the human efforts and errors in minimum time. Classification is performed on satellite images for various purposes. This paper presents a framework to classify a satellite image based on Nearest Clustering algorithm. This paper discusses the Nearest Clustering Algorithm in detail. Nearest Clustering algorithm is a supervised image classification algorithm which works using training dataset. It is a good algorithm having non parametric in nature. The algorithm is applied on testing dataset to get confusion matrix and also applied on satellite images to generate thematic map as output. The accuracy assessment has been done using confusion matrix, kappa coefficient and domain expert interpretations of images.
Keywords—Nearest Clustering Algorithm, Image
Classification, Image Processing, Confusion Matrix, Satellite Image, Training Dataset
I. INTRODUCTION
Satellite Image Classification is well known and established process used in various remote sensing applications. A satellite image is a collection of pixels arranged in a matrix form i.e. in terms of rows and column. Each pixel in an image is represented as a vector consisting of values depending upon the number of color bands in satellite data. These satellite images are used for various remote sensing applications. One of such application is classification of images to extract some useful information, object or feature such as waterbody, habitation, dune type, snow etc. Image Classification is defined as the process of extracting information or data of interest from an image. The main role of image classification is to detect, recognize and classify the features of an object in an image depending on the type of class [1]. Remote sensing data has been use widely for land cover identification and classification of various features of the land surface from satellite or airborne sensor. Classification in remote sensing involves clustering the pixels of an image to a (relatively small) set of classes, such that pixels in the same class are having similar properties [2]. Images can be classified based on certain feature vectors. One of such feature vector consists of three R, G, B values of a pixel. There are many different approaches to classification. However, in common there are two broad categories: unsupervised and supervised classification technique. Some of the supervised classification algorithms are Nearest Clustering Algorithm, K Nearest Neighborhood (KNN), Maximum Likelihood
classification, Parallelepiped Classification, Minimum Distance Classification etc. This paper discusses about the Nearest Clustering Algorithm and its use in remote sensing applications. The accuracy of the algorithm has been assessed using Confusion Matrix and Kappa Coefficient. This paper is organized in various sections. Section 2 of the paper describes the work carried by various scholars. Section 3 explains the Nearest Clustering Algorithm. Section 4 describes the methodologies used and the details of the experiment performed. Results and discussions are provided in section 5. The last section gives the conclusion.
II. LITERATURE SURVEY
machine vision classification. It requires prior knowledge of image classes. Training samples and test samples are used for classification purpose. An ordered pair (x,y) is called training samples where x is an instance and y is the label. An instance x with unknown label is called a test example. The aim of the supervised learning is to evaluate labels for test examples. One of supervised image classification algorithm is Nearest Clustering.
III. NEAREST CLUSTERING ALGORITHM
Nearest Clustering is basically modification over K-Means Clustering and Minimum Distance Algorithm. It combined features of these two algorithms with some more modification to improve classification accuracy. Nearest Clustering Algorithm is a supervised classification non parametric algorithm which makes use of training data generated by domain experts. Training data contains the prior knowledge of the data classes. Along with training data, satellite image is given as input to the algorithm for its classification and assigning labels to each pixel of satellite image.
Fig. 1 Initial Phase of Nearest Clustering Algorithm
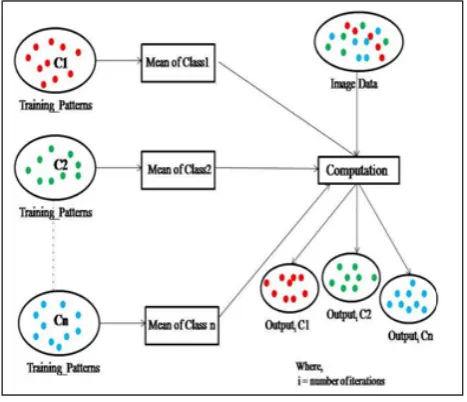
The algorithm starts with computing centroids corresponding to each of classes in training data by calculating mean of all patterns belonging to that class. It means, number of total centroids is equal to number of total classes of the classification problem. In next step, Euclidian distance of each pixel in satellite image is computed from each of centroids. Each pixel is then assigned with label of the class which is nearest to it based on the computed Euclidian distance. This algorithm takes into account the distance between the pixels and the centroids as the decision criteria.
After completion of above step, each pixel belongs to one of the classes in training data. Then, the new centroids are computed for each of classes by calculating mean of all pixels in satellite image and all patterns in training data belonging to that class.
=
These new centroids are then used in next step. So, in next step, euclidian distance of each pixel in satellite image is computed from each of new centroids. Each pixel is then assigned with label of the class which is nearest to it based on the computed euclidian distance. Again, new centroids are computed as mentioned above.
Fig. 2 Lateral Phase of Nearest Clustering Algorithm
This iterative process continues till an optimal solution is achieved. This optimal solution is that stage where new centroids and old centroids are same i.e. difference between these two is zero ideally. At the stage of an optimal solution, each pixel has been assigned class label to which it belongs. Then each output classes are color coded to give final output.
IV. METHODOLOGY
This section explains experimental framework and software design in detail.
A. Block Diagram
The block diagram of the algorithm has been shown in figure below. This block diagram shows various components of nearest clustering algorithm.
B. Flow Chart
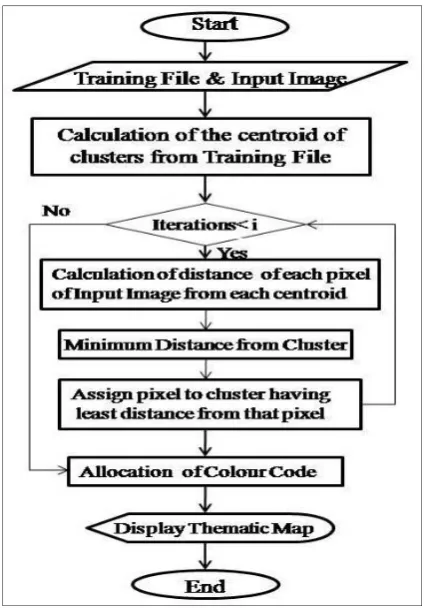
Flowchart of the nearest clustering algorithm has been shown in figure below.
Fig. 4 Flow Chart of Nearest Clustering Algorithm
C. Training and Testing Data Sets
The training dataset consists of prior knowledge of input patterns. Training and testing dataset have been generated from satellite images for five classes. Each pattern in training and testing dataset consists of three dimensional feature vector having Red, Green and Blue value corresponding to each pixel along with class label. The whole dataset generated by domain expert has been split into five sets of training and testing datasets where the ratio of number of patterns in training and testing dataset is 29:71 respectively. In each set, training dataset consists of 2000 patterns and testing dataset consists of 5000 patterns. These training and testing data sets are used for the training and testing purpose.
D. Algorithm
1. Input – Satellite ImageDataMatrix, Image Height, Image Width,
Training Data
2. Create and initialize data structures.
3. Compute initial Centroid for each class in training data.
, =
∑ , ,
Where,
i= 1 to No of Classes, j= 1 to No of Features, k= Total No of Patterns
4. For each pixel in ImageDataMatrix
4.1 Compute distance from each cluster centroid [ ]
= ( − [ ])
4.2 Calculate Minimum Distance and assign that cluster label
← ( [ ])
5. Compute centroids again
,
= ∑ , , + ∑ , ,
+
6. Compute objective function
7. Repeat the steps from 4-6 until Objective Function is minimized.
8. Assign final class label to each pixel 9. Assign the color codes to each class. 10. Display of result image.
E. Kappa Coefficient
The accuracy of the algorithm has been calculated using confusion matrix and kappa coefficient. To evaluate the performance of a classification method, Cihlar et al. (1998) proposed six criteria: accuracy, reproducibility, robustness, ability to fully use the information content of the data, uniform applicability, and objectiveness. In reality, no classification algorithm can satisfy all these requirements nor be applicable to all studies, due to different environmental settings and datasets used. Classification accuracy assessment is, however, the most common approach for an evaluation of classification performance. The confusion matrix approach is the one most widely used in accuracy assessment.
The overall accuracy can be calculated as:
Overall Accuracy (%) = ×100
The Kappa coefficient can be calculated as :
Kappa Coef icient = ∑ − ∑ ∑ ∑
− ∑ ∑ ∑
Where,
N = x = p = total number of pixels
= number of correctly classi ied pixels
V. RESULT AND DISCUSSION
The results of the above experiment have been shown in this section. The results on five training and testing datasets have been shown in detail in form of confusion matrix, kappa coefficient, and their distribution and line diagram. The results on actual satellite images have also been given.
A. Confusion Matrices
TABLEI
CONFUSION MATRIX FOR SET1
C1 C2 C3 C4 C5 C6
C1 700 0 0 0 0 0
C2 0 994 0 25 474 0
C3 3 12 1032 0 1 0
C4 0 19 0 876 0 0
C5 0 0 0 0 559 0
C6 0 0 0 0 0 305
TABLEII CONFUSION MATRIX FOR SET2
C1 C2 C3 C4 C5 C6
C1 450 0 0 0 0 0
C2 0 1165 0 116 259 0
C3 10 18 1001 0 0 0
C4 0 7 0 956 0 0
C5 0 0 0 0 536 0
C6 0 0 0 0 0 482
TABLEIII CONFUSION MATRIX FOR SET3
C1 C2 C3 C4 C5 C6
C1 735 0 0 0 0 0
C2 0 1018 0 68 437 0
C3 28 9 1000 0 1 0
C4 0 17 0 830 0 0
C5 0 0 0 0 566 0
C6 0 0 0 0 0 291
TABLEIV CONFUSION MATRIX FOR SET4
C1 C2 C3 C4 C5 C6
C1 450 0 0 0 0 0
C2 0 1165 0 116 259 0
C3 10 18 1001 0 0 0
C4 0 7 0 956 0 0
C5 0 0 0 0 536 0
C6 0 0 0 0 0 482
TABLEV CONFUSION MATRIX FOR SET5
C1 C2 C3 C4 C5 C6
C1 591 0 0 0 0 0
C2 0 961 0 84 241 0
C3 19 14 956 0 0 0
C4 0 13 0 1067 0 0
C5 0 0 0 0 520 0
C6 0 0 0 0 0 534
TABLEVI
CLASS WISE ACCURACY OF EACH SET
Set 1 Set 2 Set 3 Set 4 Set 5
C1 100.00 100.00 100.00 100.00 100.00
C2 66.57 75.64 66.84 75.64 74.72
C3 98.47 97.27 96.33 97.27 96.66
C4 97.87 99.27 97.99 99.27 98.79
C5 100.00 100.00 100.00 100.00 100.00
C6 100.00 100.00 100.00 100.00 100.00
B. Kappa Coefficient
TABLEVII
ACCURACY AND KAPPA COEFFICIENT OF ALL THE SETS
Set Accuracy(%) Kappa Value
Set 1 89.32 86.92
Set 2 91.80 89.87
Set 3 88.80 86.27
Set 4 91.80 89.80
Set 5 92.58 90.90
C. Line Diagram
Fig. 5 Class Wise Accuracy of Each Set
Fig. 6 Class Wise Accuracy of Each Set
D. Data Distribution
Fig. 7 Distribution of Classes
0 20 40 60 80 100 120
C1 C2 C3 C4 C5 C6
Accuracy (%
)
Classes
Set 1
Set 2
Set 3
Set 4
Set 5
82 84 86 88 90 92 94
Set 1
Set 2
Set 3
Set 4
Set 5
Va
lu
es
Sets
Accuracy(%)
E. Satellite Image Results
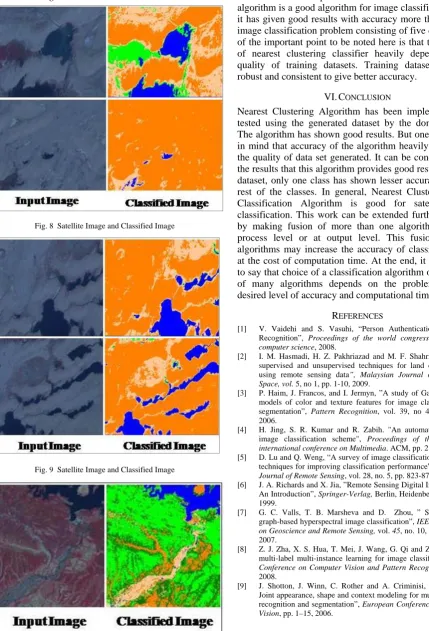
Fig. 8 Satellite Image and Classified Image
Fig. 9 Satellite Image and Classified Image
Fig. 10 Satellite Image and Classified Image
The result of the experiment shows that nearest clustering algorithm is a good algorithm for image classification. Here it has given good results with accuracy more than 90% for image classification problem consisting of five classes. One of the important point to be noted here is that the accuracy of nearest clustering classifier heavily depends on the quality of training datasets. Training datasets must be robust and consistent to give better accuracy.
VI. CONCLUSION
Nearest Clustering Algorithm has been implemented and tested using the generated dataset by the domain expert. The algorithm has shown good results. But one has to keep in mind that accuracy of the algorithm heavily depends on the quality of data set generated. It can be concluded from the results that this algorithm provides good results. For our dataset, only one class has shown lesser accuracy than the rest of the classes. In general, Nearest Clustering Image Classification Algorithm is good for satellite image classification. This work can be extended further in future by making fusion of more than one algorithm either at process level or at output level. This fusion of many algorithms may increase the accuracy of classification but at the cost of computation time. At the end, it is important to say that choice of a classification algorithm or the fusion of many algorithms depends on the problem in hand, desired level of accuracy and computational time.
REFERENCES
[1] V. Vaidehi and S. Vasuhi, “Person Authentication using Face Recognition”, Proceedings of the world congress on engg and computer science, 2008.
[2] I. M. Hasmadi, H. Z. Pakhriazad and M. F. Shahrin, ”Evaluating supervised and unsupervised techniques for land cover mapping using remote sensing data”, Malaysian Journal of Society and Space, vol. 5, no 1, pp. 1-10, 2009.
[3] P. Haim, J. Francos, and I. Jermyn, ”A study of Gaussian mixture models of color and texture features for image classification and segmentation”, Pattern Recognition, vol. 39, no 4, pp. 695-706, 2006.
[4] H. Jing, S. R. Kumar and R. Zabih. "An automatic hierarchical image classification scheme", Proceedings of the sixth ACM international conference on Multimedia. ACM, pp. 219-228, 1998. [5] D. Lu and Q. Weng, “A survey of image classification methods and
techniques for improving classification performance”, International Journal of Remote Sensing, vol. 28, no. 5, pp. 823-870, 2007. [6] J. A. Richards and X. Jia, ”Remote Sensing Digital Image Analysis:
An Introduction”, Springer-Verlag, Berlin, Heidenberg, 3rd edition, 1999.
[7] G. C. Valls, T. B. Marsheva and D. Zhou, ” Semi-supervised graph-based hyperspectral image classification”, IEEE Transactions on Geoscience and Remote Sensing, vol. 45, no. 10, pp. 3044-3054, 2007.
[8] Z. J. Zha, X. S. Hua, T. Mei, J. Wang, G. Qi and Z. Wang, ”Joint multi-label multi-instance learning for image classification”, IEEE Conference onComputer Vision and Pattern Recognition, pp. 1-8, 2008.