ISSN (Print) : 2320 – 3765 ISSN (Online): 2278 – 8875
I
nternational
J
ournal of
A
dvanced
R
esearch in
E
lectrical,
E
lectronics and
I
nstrumentation
E
ngineering
(An ISO 3297: 2007 Certified Organization)
Website: www.ijareeie.com
Vol. 6, Issue 12, December 2017
Enhancement of Reconfiguration Problem
Using Harmony Search Algorithm for Power
Distribution System
K.K.S.V.V.Prakasa Rao, Dr.P.Hema Chandu, Dr.V.C.Veera Reddy,
Satish Dhawan Space Centre, Andhra Pradesh, India Associate Prof. &HOD, Dept. of EEE, SVTM, MPL, India
Retd Professor, SV University, Tirupati,India
ABSTRACT: This paper introduces a new, fast, Harmony Search Algorithm (HSA) for the purpose of solving the DSR problem in normal operation by satisfying all objectives simultaneously with a relatively small number of generations and relatively short computation time. The objectives of the problem are to minimize real power losses and improve the voltage profile and load balancing index with minimum switching operations. Instead of generating several ranks from the non dominated set of solutions, this algorithm deals with only one rank; then the most suitable solution is chosen according to the operator's wishes. If there is no preference and all objectives have the same degree of importance, the best solution is determined by simply considering the sum of the normalized objective values. Also, a HSA operation is applied instead of a random one to speed up convergence. To test the algorithm, it was applied to widely studied test systems and a real one. The results show the efficiency of this algorithm as compared to other methods in terms of achieving all the goals simultaneously with reasonable population and generation sizes and without using a mutation rate, which is usually problem dependent.
KEYWORDS: Distribution system reconfiguration, graph theory, guided mutation, Harmony Search Algorithm (HSA).
I.INTRODUCTION
ISSN (Print) : 2320 – 3765 ISSN (Online): 2278 – 8875
I
nternational
J
ournal of
A
dvanced
R
esearch in
E
lectrical,
E
lectronics and
I
nstrumentation
E
ngineering
(An ISO 3297: 2007 Certified Organization)
Website: www.ijareeie.com
Vol. 6, Issue 12, December 2017
Fig. 1. Single-line diagram of a main feeder.
The authors R.Srinivasa Rao, S.V.L.Narasimham, M.R.Raju, and A.Srinivasa Rao presents a Harmony Search algorithm (HSA) was proposed to solve the network reconfiguration problem to get optimal switching combinations simultaneously in the network to minimize real power losses in the distribution network [1]. The proposed algorithm converges to optimum solution quickly with high accuracy. The size of the solution vector is equal to the total number of switches in the system. As the size of the system increases, the size of the solution vector in the other methods is large compared to the proposed method and computation time is also better than other methods.
II. FORMULATION OF OPTIMIZATION PROBLEM
A. Power Flow Equations
By applying efficient method [2], the load flow solutions in a distribution system are computed by the following set of simplified recursive equations derived from the single-line diagram shown in Fig.1:
= − , −
= −
| | { + ( + | | ) }− (1)
= − , −
= −
| | { + ( + | | ) }− | | − | | − (2)
| | = | | +
| | ( + ( + | | ) )− 2 + ( + | | ) . (3)
The power loss in the line segment linking buses k and k+1 may be considered as,
( , + 1) = ∙( + ) | | . (4)
By summing up the losses of all line sections of the feeder, the total power loss is given by,
, = ( , + 1). (5)
B. Power Loss Using Network Reconfiguration
ISSN (Print) : 2320 – 3765 ISSN (Online): 2278 – 8875
I
nternational
J
ournal of
A
dvanced
R
esearch in
E
lectrical,
E
lectronics and
I
nstrumentation
E
ngineering
(An ISO 3297: 2007 Certified Organization)
Website: www.ijareeie.com
Vol. 6, Issue 12, December 2017
′ ( , + 1) = ∙
′ + ′
′ . (6)
The total real power loss of the all lines sections in n bus system ( , ) is calculated by adding up the losses of all
line sections of the feeder, which is described as,
,
′ = ′ ( , + 1). (7)
C. Loss Reduction Using Network Reconfiguration
Net power loss reduction in the system is the variance of power loss before and after reconfiguration, that is equations (5) − (7) and is given by
∆ = , ( , + 1)− ′, ( , + 1). (8).
D. Objective Function of the Problem
The objective function of the problem is expressed to maximize the power loss reduction in distribution system while subjected to power balance constraints and power generation limit.
The bus voltage magnitudes are to be kept within acceptable operating limits throughout the optimization process, as follows, that means voltage constraints should be satisfied, as given below, subjected to
≤ ≤ (9) And feeder capability limits
, ≤ , , } (10)
Generator operator constraints
∑ ≤ ∑ + , (11)
Where the lower bound of bus voltage limits is and is the upper bound of bus voltage limits. Radial structure of the system
det( ) = 1 −1 ( )
det( ) = 0( )} (12)
III. HARMONY SEARCH ALGORITHM
The harmony search algorithm (HSA) is a latest meta-heuristic population algorithm. The harmony search algorithm (HSA) is simple in concept from natural musical presentation processes [5], few in parameters and easy in implementation. It has been effectively applied to different computational optimization [6] problems such as structural design, water network design, dam scheduling, and various benchmark and real-world problems like traveling salesman problem [7].
The main steps of HS are as follows [5]:
Step1) Initialize the quandary and algorithmic parameters. Step2) Initialize the harmony memory.
Step 3) Improvise a new harmony. Step4) Update the harmony memory. Step5) Check the stopping criteria.
These steps are explained in below as follows,
Step1. Initialize the Problem and Algorithm Parameters
The common optimization difficulty is specified as follows:
ISSN (Print) : 2320 – 3765 ISSN (Online): 2278 – 8875
I
nternational
J
ournal of
A
dvanced
R
esearch in
E
lectrical,
E
lectronics and
I
nstrumentation
E
ngineering
(An ISO 3297: 2007 Certified Organization)
Website: www.ijareeie.com
Vol. 6, Issue 12, December 2017
where ( ) is an objective function; is the set of each decision variable ; N is the number of decision variables; is the set of the possible range of values for each decision variable, that is ≤ ≤ ;and and are the lower and upper bounds for each decision changeable. The HS algorithmic parameters are also particular in this step. These parameters are harmony memory size (HMS), harmony memory considering rate (HMCR), pitch adjusting rate (PAR), number of improvisation (NI), and harmony memory (HM), which are defined in further steps.
Step 2.Initialize the Harmony Memory
In this step, the harmony memory (HM matrix) is filled with as many randomly generated solution vectors as HMS and sorted by the values of the objective function.
=
⎣ ⎢ ⎢ ⎢ ⎢
⎡ ⋯
⋯
⋮ ⋮ ⋮
⋯
⋮ ⋮
… ⎦⎥
⎥ ⎥ ⎥ ⎤
Step3. Improvise a New Harmony
A New Harmony vector →′= ( ′, ′,∙∙∙∙∙∙∙∙∙∙∙ ′ ) is generated from the HM based on memory considerations, pitch
adaptations, and randomisation. For illustration, the rate of the first decision changeable for the new vector can be chosen from any value in the specified HM range Values of the other decision variables can be chosen in the same manner known as improvisation. There is a possibility that the new value can be chosen using the HMCR constraint, which vary among 0 and 1 as follows:
′= ′ ∈{ , ,∙∙∙∙∙∙∙ }with probability HMCR
′ ∈ with probability(1−HMCR)
The HMCR sets the rate of choosing one value from the historic values stored in the HM and (1-HMCR) sets the rate of randomly choosing one feasible value not limited to those stored in the HM. For example, a HMCR of 0.9 indicates that the HS algorithm will choose the decision variable value from historically stored values in the HM with the 90% probability or from the entire possible range with the 10% probability. Each component of the New Harmony vector is examined to determine whether it should be pitch attuned. This process uses the PAR constraint that sets the rate of adjustment for the pitch chosen from the HM as follows: Pitch adjusting decision for
′ = with probability HMCR with probability(1−HMCR)
A PAR of 0.3 indicates that the algorithm will choose a neighboring value with 30% × HMCR probability.
( () < )
′ ← ′ ∈{ , ,∙∙∙∙∙∙∙∙∙∙∙ } ( < )
′ = ′ ± ()
Where is an arbitrary distance bandwidth for the continuous design variable and () is uniform distribution among 0 and 1. Since the quandary is distinct in scenery, is taken as 1.
Step 4. Update Harmony Memory
In this stage, if the New Harmony vector →′= ( ′, ′,∙∙∙∙∙∙∙∙∙∙∙∙ ′ )is better than the worst harmony vector in the HM in
ISSN (Print) : 2320 – 3765 ISSN (Online): 2278 – 8875
I
nternational
J
ournal of
A
dvanced
R
esearch in
E
lectrical,
E
lectronics and
I
nstrumentation
E
ngineering
(An ISO 3297: 2007 Certified Organization)
Website: www.ijareeie.com
Vol. 6, Issue 12, December 2017
Step 5. Check stopping criterion
Repeat steps 3 and 4 until the termination criterion is satisfied termination criterion: The computations are terminated when the termination criterion (maximum number of improvisations) is satisfied. Otherwise, steps 3 (improvising New Harmony from the HM) and 4 (updating the HM) are repeated.
IV. SIMULATION RESULTS
The proposed algorithm was programmed using MATLAB7.12 and implemented on a 1.64-GHz Notebook PC with 4 GBof RAM. It was applied to two widely-studied test systems, a16-bus system and a 33-bus system. In order to test the convergence performance of the HSA, it was applied 100 times to each system and the most repeated solution set (the mode) was selected as theactual or representative solution set. The mode set represented 92% of all solutions sets for the 33-bus system. and each chromosome was evaluatedaccording to (3)–(6) using a Newton-Raphson based load flow program. The results are presented in the following andcompared with results from other work.
33-Buses Test System
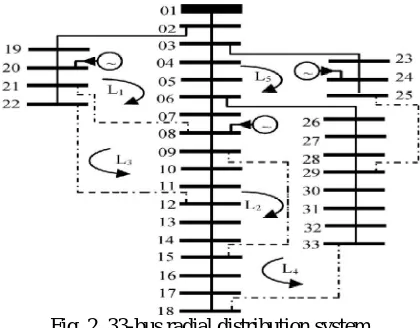
Fig. 2. 33-bus radial distribution system
The system data is given in [8]. As shown in Fig. 2, the system consists of 33 nodes, 37 branches, and five fundamental loops. The base MVA and kV are 10 and 12.66, respectively,and the total system loads are 3715 kW and 2300 kVAR. Initially, branches 33,34,35,36, and 37 are open, as shown in Fig. 2, and the totalsystem power loss is 224.93 kW. The new HAS produced a set of 34 nondominated solutions. Only the optimum topologies(from that set) according to the four objective functions are listed in Table I. The results shown in Table I were obtainedafter ten generations and with an initial population of 30 chromosomes,and it required 20.2 s of CPU time.
ISSN (Print) : 2320 – 3765 ISSN (Online): 2278 – 8875
I
nternational
J
ournal of
A
dvanced
R
esearch in
E
lectrical,
E
lectronics and
I
nstrumentation
E
ngineering
(An ISO 3297: 2007 Certified Organization)
Website: www.ijareeie.com
Vol. 6, Issue 12, December 2017
Fig 3. Voltage profile of the IEEE 33 bus System with & without Harmony Search Algorithm (HSA)
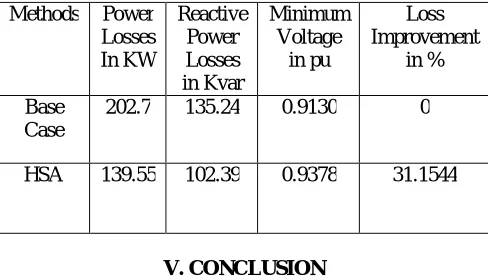
TABLE I
OPTIMUM SOLUTIONS OF THE FOUR OBJECTIVES RESULTING FROM THE APPLICATION OF FNSGA TO THE 33-BUS SYSTEM
Methods Power Losses In KW
Reactive Power Losses in Kvar
Minimum Voltage
in pu
Loss Improvement
in % Base
Case
202.7 135.24 0.9130 0
HSA 139.55 102.39 0.9378 31.1544
V. CONCLUSION
A novel algorithm has been offered to solve the network reconfiguration problem for minimizing the active power losses. Proficient Meta heuristic HSA is used in the optimization procedure of the network reconfiguration. The proposed method is tested on an IEEE 33-bus test system at different load extents, low, normal and high. The result shows that network reconfiguration method is more proficient in decreasing power loss and improving the voltage profile compared to other methods. In previous approaches, system reconfiguration in distribution networks are considered separately. However, in the proposed method network reconfiguration deal concurrently for better loss minimization and voltage summary.
REFERENCES
[1] A. A. Zin, A. Ferdavani, A. Khairuddin, and M. Naeini, “Two circularupdating hybrid heuristic methods for minimum-loss reconfiguration of electrical distribution network,” IEEE Trans. Power Syst., vol. 28, no. 2, pp. 1318–1323, May 2013.
[2] T. Thakur and Jaswanti, “Study and characterization of power distribution network reconfiguration,” in Proc. 2006 IEEE Power and Energy Society Transmission and Distribution Conf., pp. 1–6.
[3] D. Shirmohammadi and H. Wayne Hong, “Reconfiguration of electric distribution networks for resistive losses reduction,” IEEE Trans.Power Del., vol. 4, no. 2, pp. 1492–1498, Apr. 1989.
[4] S. Civanlar, J. J. Grainger, H. Yin, and S. S. H. Lee, “Distribution feeder reconfiguration for loss reduction,” IEEE Trans. Power Del., vol. 3, no. 3, pp. 1217–1223, Jul. 1988.
[5] M. E. Baran and F. F. Wu, “Network reconfiguration in distribution systems for loss reduction and load balancing,” IEEE Trans. PowerDel., vol. 4, no. 2, pp. 1401–1407, Apr. 1989.
ISSN (Print) : 2320 – 3765 ISSN (Online): 2278 – 8875
I
nternational
J
ournal of
A
dvanced
R
esearch in
E
lectrical,
E
lectronics and
I
nstrumentation
E
ngineering
(An ISO 3297: 2007 Certified Organization)
Website: www.ijareeie.com
Vol. 6, Issue 12, December 2017
[7] S. K. Goswami and S. K. Basu, “A new algorithm for the reconfiguration of distribution feeders for loss minimization,” IEEE Trans. PowerDel., vol. 7, no. 3, pp. 1484–1491, Jul. 1992.
[8] T. E. McDermott, I. Drezga, and R. P. Broadwater, “A heuristic nonlinear constructive method for distribution system reconfiguration,” IEEE Trans. Power Syst., vol. 14, no. 2, pp. 478–483, May 1999.
[9] W. M. Lin and H. C. Chin, “A new approach for distribution feeder reconfiguration for loss reduction and service restoration,” IEEE Trans. Power Del., vol. 13, no. 3, pp. 870–875, Jul. 1998.
[10] M. A. Kashem, G. B. Jasmon, A. Mohamed, and M. Moghavvemi, “Artificial neural network approach to network reconfiguration for loss minimization in distribution networks,” Int. J. Elect. Power EnergySyst., vol. 20, no. 4, pp. 247–258, May 1998.
[11] A. Augugliaro, L. Dusonchet, M. G. Ippolito, and E. R. Sanseverino, “Minimum losses reconfiguration of MV distribution networks through local control of tie-switches,” IEEE Trans. Power Del., vol. 18, no. 3, pp. 762–771, Jul. 2003.
[12] K. Nara, Y. Mishima, A. Gjyo, T. Ito, and H. Kaneda, “Loss minimum reconfiguration of distribution system by tabu search,” in Proc. 2002 IEEE Conf. Transmission and Distribution, Asia, pp. 232–236.
[13] Y. Jeon and J. Kim, “Network reconfiguration in radial distribution system using simulated annealing and tabu search,” in Proc. 2000 IEEE Power Engineering Society Winter Meeting, pp. 2329–2333.
[14] A. Skoonpong and S. Sirisumrannukul, “Network reconfiguration for reliability worth enhancement in distribution systems by simulated annealing,” in Proc. 2008 IEEE Int. Conf. Electronics, ComputerTelecommunications, and Information, pp. 937–940.
[15] K. H. Jung, H. Kim, and Y. Ko, “Network reconfiguration algorithm for automated distribution systems based on artificial intelligence approach,” IEEE Trans. Power Del., vol. 8, no. 4, pp. 1933–1941, Oct. 1993.
[16] S. H. K. Vuppalapati and A. K. Srivastava, “Application of ant colony optimization for reconfiguration of shipboard power system,” Int. J.Eng., Sci., Technol. (IJEST), vol. 2, no. 3, pp. 119–131, 2010.
[17] A. Ahuja, S. Das, and A. Pahwa, “An AIS-ACO hybrid approach for multi-objective distribution system reconfiguration,” IEEE Trans.Power Syst., vol. 22, no. 3, pp. 1101–1111, Aug. 2007.
[18] Y. T. Hsiao, “Multi-objective evolution programming method for feeder reconfiguration,” IEEE Trans. Power Syst., vol. 19, no. 1, pp. 594–599, Feb. 2004.