ISSN 2286-4822
www.euacademic.org DRJI Value: 5.9 (B+)
The Endogenous Indicators for Performance of
Teacher Education Institutions: An Exploratory
Factor Analysis
BRIJRAJ SINGH
Research Scholar Faculty of Education D.E.I (Deemed Univ.), Agra India ANAND PYARI Professor and Head Department of Foundations of Education Faculty of Education D.E.I (Deemed Univ.), Agra
India DR. R. K. KALRA Associate Professor Faculty of Education D.E.I (Deemed Univ.), Agra
India
Abstract:
Development Scale (EIDS). Those items placed in the final form of the scale having more than 0.3 value of item-total item correlation. Finally a set of 35 items placed in the final form of the scale. The index of Cronbach’s alpha reliability and test retest reliability were found satisfactory. The content and face validity were established for this scale (EIDS). The statistical techniques “factor analysis” performed using SPSS 16.0 version. The six indicators were found and known as governance, student support and progression, team effort and healthy coordination, knowledge assimilation, faculty quality and development and infrastructure with innovative resources and these indicators accounted nearly 75 percent of variance among observed quality aspects of the teacher education institutions.
Key words: Endogenous Indicators, Exploratory factor analysis, Performance
Introduction:
The demand for qualified and quality teachers has been continuously increasing over the world. There has been an unprecedented expansion of school education especially in the developing countries. In the past few years researchers have worked on factors that are instrumental in improving the efficiency of teacher education Institutions. Forecasting performance of the teacher education is a problem of obvious importance in education. Educationist, researchers and guidance workers always look for some endogenous indicators for predicting performance of Teachers Education Institute.
Singh (1995) emphasized that the educationists in the country were greatly concerned and anguished with the continued deterioration in the quality of teacher education.
Narayan Rao and Brahadeeswaran (2004) found that personnel management, financial management, classroom teaching, library facilities, interaction with external agencies, information network, decentralized responsibilities, programme for professional development and matching between Job and person were important indicators for quality and standard of higher education.
Singh and Singh (2007) stated that quality control was a major problem in teacher education and neither the State Governments nor the Universities tried to enforce the minimum standards required for teacher preparation. As a result it was found that there were a large number of institutions which did not have the minimum necessary buildings, furniture, library, teaching staff with appropriate qualifications etc.
It is found from the literature that after providing the NCTE a statutory status, there has been a mushroom growth of privately managed self-financed secondary teacher education institutions in India. {Singh (2005) and Sidhu (2004)}. Most of the privately managed colleges in India did not follow the norms the standards prescribed by NCTE. {NCTE (1998)}. Quality had been deteriorating with the increase in quantity of institutions {Singh (2004)}. Most of the privately managed self-financed colleges were established with the motive of profit making. {Singh (2004) and Joshi (2005)}.
which truly reflect internal aspect of the institutions and these factors may be enhanced within the institutions. A perusal of the related literature further reveals that only countable numbers of studies have been conducted in India related to the quality indicators for performance of Teacher education Institutions. In the present study it was planned to explore the endogenous indicators for performance of teacher education institute through factor analysis.
Objective of The Study:
This study is conducted with basic objective as: To explore the endogenous indicators affecting the quality of teacher education institutions through factor analysis.
Research Methodology:
The aim of the present study to explore endogenous indicators for performance of teacher education institutions, therefore, the methodology was designed in the following manner-
Research method: The investigation followed descriptive survey method to explore endogenous quality indicators through the sample of students, staff and administrators.
through purposive method of sampling because of exiting criteria of sample units.
reliability were estimated for the final form of the scale and index of Cronbach’s alpha reliability and test retest reliability were found satisfactory. The content and face validity were established for this scale (EIDS).
Statistical Techniques:
The data was analyzed through descriptive and inferential statistics using SPSS 16.0 version. The questions and responses were coded and entered in the computer using Microsoft Excel Software. Required analysis was done with the help of Statistical Package for Social Sciences 16.0 Version. The researcher has adopted various measures of statistics in order to arrange and thrash out the essence from the collected data and to make the data meaningful the following statistical techniques were used:
1. Mean
2. Standard Deviation 3. Factor analysis
i. Correlation matrix (Pearson moment)
ii. KMO & Bartlett’s Test for sample adequacy iii. Index of communalities
iv. Eigen values v. Scree plot vi. Factor loading
vii. Rotated component matrix
Discussion
value can be considered as adequate that should be greater than 0.6 (Kaiser and Rice, 1974). KMO value was found high (0.777) which indicates that the data set is highly desirable for factor analysis. The high KMO value indicates adequate and high correlation existed among the variables and appropriate for extraction of factors. A significance value of chi-square (Bartlett’s test) at p=0.01 indicates that the data do not produce an identity matrix and have significant deviation from identity matrix. This result implies that the data is thus approximately multivariate normal and acceptable for factor analysis
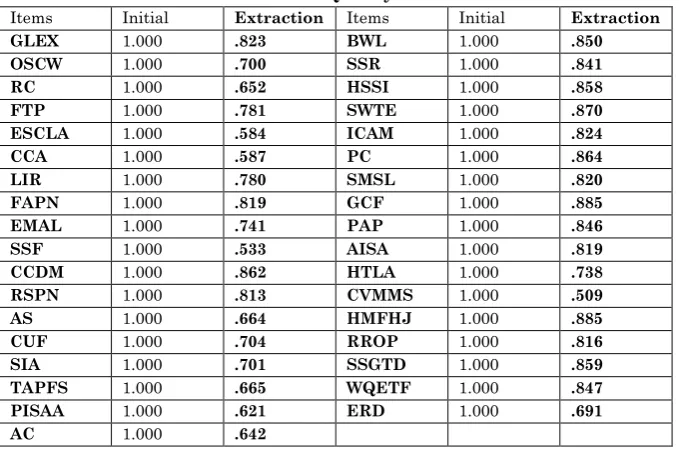
Communalities for quality items: Communality in Factor Analysis is same thing like R2 (R square) in the regression
analysis and it shows the extent to which the derived factors explain the particular item. The factor should explain at least half of each original item’s variance, so the communality value for each item should be 0.50 or higher (Malhotra, 2006). If communality value for a particular item is low (<0.5), then that item cannot be considered for factor analysis and If communality value for a particular variable is high (>0.5) then that item can be considered for factor analysis. Communality index values (Table-2) for each quality items was found relatively large (greater than 0.5), so we can say that all the items have large proportion of its variance which can be accounted by the common factors, hence all items are acceptable for further analysis. The investigator found in pre-requisite phase of factor analysis that the obtained data is appropriate and adequate and also the items have large proportion of its variance accounted by the factors which indicates the suitability pre-requisites for factor analysis.
Eigen values are used to consolidate the variance. In factor analysis, Eigen values are used to condense the variance accounted by the factor. The factor with the largest index of Eigen value has the most variance and considered for further analysis, and the factors with small or negative Eigen value (<1) that are usually omitted from solutions" (Tabachnick and Fidell, 1996,).Only those components placed which have Eigen value equal or greater than 1. It was found that there are six factors which have Eigen value more than 1 and also accounted 75.128 percent of the variance among the quality items(Table -3) which is exceed than the 60 percent threshold commonly used in social sciences to establish satisfaction with the solution (Hair et al., 1995) and also it is seen that first factor accounted 17.925 % of total variance among the quality items and second, third, fourth, fifth and sixth factor accounted 15.636%, 12.390%, 11.131%, 9.913% and 8.133% respectively. These six factors accounted and explained the large amount of quality aspects or performance of teacher education institutions. “Scree plot” for 35 quality items with their factor loading value is obtained and shown as under-
result of scree plot can be validated with above PCA output analysis.
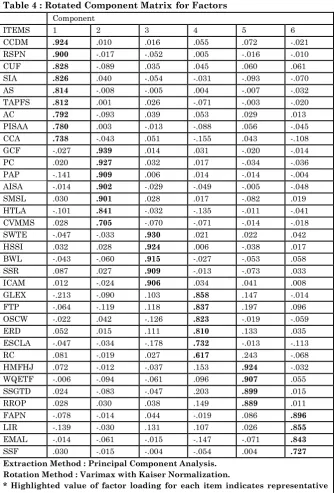
Rotated Component Matrix for Factors: In this step, Varimax with Kaiser Normalization method for rotated component matrix (Table-4) is usedin the present study. The inclusion of items in the factor was determined by their factor loadings. Factor loadings are the correlation of the items with the factor. It indicates the strength of the relationship between the item and factors. 35 items considered in the primary data were reduced to 6 factors model and each factor was given a name which associated with the corresponding items. The factor with their representative items are given in the following
Table -5:
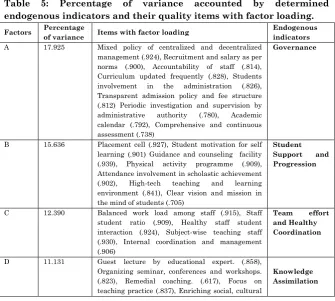
Table 5: Percentage of variance accounted by determined endogenous indicators and their quality items with factor loading.
Factors Percentage
of variance Items with factor loading
Endogenous indicators
A 17.925 Mixed policy of centralized and decentralized
management (.924), Recruitment and salary as per norms (.900), Accountability of staff (.814), Curriculum updated frequently (.828), Students involvement in the administration (.826), Transparent admission policy and fee structure (.812) Periodic investigation and supervision by
administrative authority (.780), Academic
calendar (.792), Comprehensive and continuous assessment (.738)
Governance
B 15.636 Placement cell (.927), Student motivation for self
learning (.901) Guidance and counseling facility (.939), Physical activity programme (.909), Attendance involvement in scholastic achievement
(.902), High-tech teaching and learning
environment (.841), Clear vision and mission in the mind of students (.705)
Student Support and Progression
C 12.390 Balanced work load among staff (.915), Staff
student ratio (.909), Healthy staff student interaction (.924), Subject-wise teaching staff (.930), Internal coordination and management (.906)
Team effort and Healthy Coordination
D 11.131 Guest lecture by educational expert. (.858),
Organizing seminar, conferences and workshops. (.823), Remedial coaching. (.617), Focus on teaching practice (.837), Enriching social, cultural
and leisure activities (.732), Enforcement on research development. (.810)
E 9.913 Highly motivated faculty with high job satisfaction
(.924), Reward and recognition for outstanding progress (.889),Staff setting goal for teaching
Development (.899), Well qualified and
experienced teaching faculty (.907)
Faculty quality and
Development
F 8.133 Library with innovative resources (.855), Financial
assets as per norms (.896), Electronic multimedia and laboratories (.843), Students support facilities e.g canteen, toilet, water etc. (.727)
Infrastructure With
Innovative Resources
It is revealed from the table-5 that there are six indicators which labeled with their common features. These indicators are known as governance, student support and progression, team effort and healthy coordination, knowledge assimilation, faculty quality and development and infrastructure with innovative resources and these indicators accounted nearly 75 percent of variance among observed quality aspects of the teacher education institutions. The index of factor loading is shown with quality items that indicate the level of importance of items in the endogenous indicators.
Conclusion of the Study:
Annexure
Table 1: Kaiser-Meyer-Olkin and Bartlett’s Test of Sphericity Kaiser-Meyer-Olkin Measure of Sampling Adequacy .777* Bartlett's Test of Sphericity (measure
for identify the correlation matrix)
Chi-Square 1205. 4
Degree of freedom 595
Level of significant .01
* High and Adequate (>0.6)
Table 2 : Communalities for Each Quality Items
Items Initial Extraction Items Initial Extraction
GLEX 1.000 .823 BWL 1.000 .850
OSCW 1.000 .700 SSR 1.000 .841
RC 1.000 .652 HSSI 1.000 .858
FTP 1.000 .781 SWTE 1.000 .870
ESCLA 1.000 .584 ICAM 1.000 .824
CCA 1.000 .587 PC 1.000 .864
LIR 1.000 .780 SMSL 1.000 .820
FAPN 1.000 .819 GCF 1.000 .885
EMAL 1.000 .741 PAP 1.000 .846
SSF 1.000 .533 AISA 1.000 .819
CCDM 1.000 .862 HTLA 1.000 .738
RSPN 1.000 .813 CVMMS 1.000 .509
AS 1.000 .664 HMFHJ 1.000 .885
CUF 1.000 .704 RROP 1.000 .816
SIA 1.000 .701 SSGTD 1.000 .859
TAPFS 1.000 .665 WQETF 1.000 .847
PISAA 1.000 .621 ERD 1.000 .691
AC 1.000 .642
Table 3 : Factor Structure with Eigen Values and percentage of Variance
Components Initial Eigen Value
Rotation Sums of Squared Loadings
% of variance Cumulative
percentage
1 6.426 17.925 17.925
2 5.686 15.636 33.562
3 4.566 12.390 45.951
4 4.356 11.131 57.083
5 2.850 9.913 66.995
Table 4 : Rotated Component Matrix for Factors
Component
ITEMS 1 2 3 4 5 6
CCDM .924 .010 .016 .055 .072 -.021
RSPN .900 -.017 -.052 .005 -.016 -.010
CUF .828 -.089 .035 .045 .060 .061
SIA .826 .040 -.054 -.031 -.093 -.070
AS .814 -.008 -.005 .004 -.007 -.032
TAPFS .812 .001 .026 -.071 -.003 -.020
AC .792 -.093 .039 .053 .029 .013
PISAA .780 .003 -.013 -.088 .056 -.045
CCA .738 -.043 .051 -.155 .043 -.108
GCF -.027 .939 .014 .031 -.020 -.014
PC .020 .927 .032 .017 -.034 -.036
PAP -.141 .909 .006 .014 -.014 -.004
AISA -.014 .902 -.029 -.049 -.005 -.048
SMSL .030 .901 .028 .017 -.082 .019
HTLA -.101 .841 -.032 -.135 -.011 -.041
CVMMS .028 .705 -.070 -.071 -.014 -.018
SWTE -.047 -.033 .930 .021 .022 .042
HSSI .032 .028 .924 .006 -.038 .017
BWL -.043 -.060 .915 -.027 -.053 .058
SSR .087 .027 .909 -.013 -.073 .033
ICAM .012 -.024 .906 .034 .041 .008
GLEX -.213 -.090 .103 .858 .147 -.014
FTP -.064 -.119 .118 .837 .197 .096
OSCW -.022 .042 -.126 .823 -.019 -.059
ERD .052 .015 .111 .810 .133 .035
ESCLA -.047 -.034 -.178 .732 -.013 -.113
RC .081 -.019 .027 .617 .243 -.068
HMFHJ .072 -.012 -.037 .153 .924 -.032
WQETF -.006 -.094 -.061 .096 .907 .055
SSGTD .024 -.083 -.047 .203 .899 .015
RROP .028 .030 .038 .149 .889 .011
FAPN -.078 -.014 .044 -.019 .086 .896
LIR -.139 -.030 .131 .107 .026 .855
EMAL -.014 -.061 -.015 -.147 -.071 .843
SSF .030 -.015 -.004 -.054 .004 .727
Extraction Method : Principal Component Analysis. Rotation Method : Varimax with Kaiser Normalization.
* Highlighted value of factor loading for each item indicates representative component or factor.
BIBLIOGRAPHY
Bartlett, M.S. 1950. “Tests of significance in factor analysis.” British Journal of Psychology. 3(Part II): 77-85.
Best, John W. and James V. Kahan. 2006. Research in Education. New Delhi: Prentice Hall of India, 249.
Cattell, R.B. 1996. “The screen test for the number of factors.” Multivariate Behavioral Research.1966;1(2):245-76. Costello, A.B. and Osborne, J.W. 2005. “Best Practices in
Exploratory Factor Analysis: Four Recommendations for Getting the Most From Your Analysis.” Practical Assessment, Research & Evaluation 10(7):1-9.
David, Fred R. 1993. Strategic Management. 4th Ed. New York: Macmillan Publishing Company.
Encyclopedia of Educational Research. 1973. USA
Kim, Jae-On and Charles W. Mueller. 1978. Factor Analysis: Statistical Methods and Practical Issues (Quantitative Applications in the Social Sciences). SAGE Publications, Inc.
Gorsuch, R.L. 1983. Factor Analysis. Hillsdale, NJ: Erlbaum. Hair, J., Anderson, R.E., Tatham, R.L. and Black, W.C. 1995.
Multivariate data analysis. 4th ed. New Jersey: Prentice-Hall Inc.
Joshi, Rambha. 2005. “Challenges to Teacher Education in 21st Century.” University News 43 (18): 165.
Kaur, Harvinder. 2012. “Growth and development of teacher education programme in Punjab with reference to expansion, quality and societies needs.”
Kothari, D.S. 1966. Report of the Education Commission 1964-66. Govt. of India, New Delhi.
Koul, Lokesh. 2009. Methodology of Educational Research. 4th
Edition. New Delhi: Vikas Publishing House.
Ministry of Human Resource Development (MHRD). 1986. Programme of Action. New Delhi: Government of India. Ministry of Human Resource Development (MHRD). 1992.
Programme of Action. New Delhi: Government of India. Ministry of Human Resource Development (MHRD). 1992.
Revised National Policy on Education. New Delhi: Government of India.
Mudaliar, A.L. 1953. Report of the secondary education commission, 1952-53. Govt. of India, New Delhi.
NAAC. Report on Manual for Self-appraisal of Teacher Education Institutions.
National Council for Teacher Education: Annual report of the years : 2003-04, 2004-05, 2005-06, 2006-07 and 2007-08, New Dehli: NCTE.
NCTE. 1993. National Council for Teacher Education, Act, Section 2(1). New Delhi: NCTE.
Singh, L.C. & Mishra, Sudarshan. 2005. “Quality concerns in Teacher Education.” University News 43(18): 29.
Singh, R.P. 2005b. “Teacher Training (Towards a better tomorrow).” Anweshika, Indian Journal of Teacher Education, New Delhi, NCTE-5.
Tabachnick, B.G. and Fidell, L.S. 2007. Using Multivariate Statistics. Boston: Person Education Inc.
WEBSITES:
http://ctb.ku.edu/
http://scholar.lib.vt.edu/ejournals/JVTE/v12n1/Balamura likrishna.html
http://shodhganga.inflibnet.ac.in/handle/10603/10003 http://www.indianjournals.com
http://www.eneraldinesight.com http://www.eric.ed.gor
http://www.intersciences.wiley.com http://www.allacademic.com