Interference (EMI) Shielding Effectiveness of Nanosize Conducting
Black-Silicone Rubber Composites over 8–18 GHz
Raj K. Jani1, 2, Manoj K. Patra1, Lokesh Saini1, Anuj Shukla1, Chandra P. Singh1, and Sampat R. Vadera1, *
Abstract—In this paper, studies on broadband microwave absorption and electromagnetic shielding effectiveness are reported in flexible rubber composites with low filler content of nanosize conducting carbon over 8–18 GHz frequency range of electromagnetic spectrum. Rubber based composites are prepared by loading of 1–15 wt% nanosize conducting Carbon Black (CB) in silicone rubber matrix. Effect of percentage loading of nanosize CB on DC conductivity, dielectric & microwave absorption properties and electromagnetic Shielding Effectiveness (SE) of silicone rubber composites is studied. The percolation threshold is achieved at low concentration (3 wt%) of CB in composites. The observed complex permittivity values revealed that composites with concentration of 5 wt% CB can provide more than 90% microwave absorption (Reflection Loss > −10 dB) over 8–18 GHz at composite thickness of 1.9–2.7 mm. Further, composites with concentration of 15 wt% of CB shows −40 dB SE over the broad frequency range 8–18 GHz at thickness 2.8 mm. The effect of composite thickness on microwave absorption properties and shielding effectiveness is also analyzed. Thus, the prepared rubber composites with suitable concentration of nanosize CB as filler may be used as microwave absorber in stealth applications as well as for EMI shielding of electronic equipments in various civilian and military areas.
1. INTRODUCTION
Flexible microwave absorbing composites are essentially required in military and civilian applications for reduction of radar signatures of airborne platforms/targets to achieve stealthy features as well as for protection of manpower & equipments from EM hazards. Rubber based composites with significant microwave absorption and shielding effectiveness have attracted the attention of the scientific community due to their advantages such as flexibility to cover curved structures, cut and paste type in nature, and weather resistant for outdoor applications. Ideally, promising composites should be thin, light weight and environmentally stable having wide absorption bandwidth coverage. In last few decades, various magnetic and carbonaceous materials have been used as fillers in composites to obtain microwave absorption and EMI shielding properties [1–3]. However, magnetic fillers based composites suffer from weight penalty due to their high density. Further, different carbon allotropes viz. carbon nanotubes (CNTs), carbon fibers (CFs) and graphene based composites also have certain difficulties including dispersion of filler in host matrix, reproducibility of functional properties, production of bulk quantity and cost effectiveness, thereby, limiting their extensive practical applications [4–11].
Nanosize conducting black (CB) is one of the promising filler materials due to its excellent electrical conductivity, light weight and low cost. There are several reports on the use of CB along with certain
Received 27 February 2017, Accepted 18 May 2017, Scheduled 24 July 2017
* Corresponding author: Sampat Raj Vadera ([email protected]).
1 Defence Laboratory, Defence R&D Organization, Jodhpur-342011, Rajasthan, India. 2 Department of Physics, Jai Narain Vyas
other filler materials in composites to achieve MW absorption properties [12–14]. In previous studies, this material has also been used by different researchers to obtain high Shielding Effectiveness (SE) in composites [15–17]. However, as per available literature it is seen that the use of CB alone as a microwave absorbing filler is not much explored. The authors could achieve SE values of ∼ −30 dB with high loading of carbon black∼50 parts per hundred (phr) in gigahertz frequency range. Although an SE of ∼ −40 dB has been reported in some of composites by using elongated fillers viz. Ni fibers, Steel fibers, Ni filaments, etc. [18–20], inclusion of these types of fillers in the matrix brings difficulty in fabrication processes leading to inconsistency in properties.
Dispersion of filler is one of the biggest challenges, particularly at high concentration. This may lead to variation of functional properties, weakening the mechanical properties, increasing the cost and weight penalty of composites. Therefore, development of lightweight, flexible composites is highly crucial for many of the civil and defence applications, particularly for airborne systems.
In this work, attempts are made to develop flexible composites by taking nanosize CB as the only filler material in a room temperature curable silicone rubber matrix having broadband microwave absorption properties and EMI shielding effectiveness at low filler concentration. The percolation threshold of composites is achieved at very low concentration (3 wt%) of nanosize CB in these composites. Microwave absorption properties and shielding effectiveness of composites with different concentrations of CB are investigated at microwave frequencies over 8–18 GHz.
2. MATERIALS AND METHODS 2.1. Preparation of Composites
Ketjenblack conducting carbon black (CB) (produced by AkzoNobel Functional Chemicals, USA) with surface area 800 m2/g (BET) and pore volume (dibutylphthalate) 310–345 ml/100 g has been used as a filler for achieving desired electromagnetic performance in the rubber composites. Silicone rubber (purchased from Performance Polymers, Bangalore, India) has been used as a binder matrix for preparation of composites. This matrix has viscosity ∼ 20 PaS, density ∼ 1.07 g/cc, dielectric constant ∼ 3, dielectric loss tangent ∼ 0.001 and room temperature curable characteristics. Xylene and Dibutyletindilaurate have been used as solvent and curing agent respectively for the preparation of composites.
The desired weight percentage of filler CB is added into the solvent and sonicated for 10 minutes using ultrasonic bath for dispersing CB particles properly. This CB suspension is then added to the silicone-rubber paste and stirred for 10 minutes. The required amount of hardner (5% of SiR) is added to the mixture and stirred properly for 5 minutes. The resultant mixture is immediately poured into a rectangular mould (50 mm×50 mm×2 mm) and pressed for 8–10 hours for proper curing. After curing, the sheet is removed from the mould and kept for 24 hours in ambient conditions. The obtained sheet is cut into the desired dimensions for waveguide measurements for EM characterization in X (8.2– 12.4 GHz) and Ku (12.4–18 GHz) bands of microwave frequency range. Samples with different loadings of CB from 1 wt% to 15 wt% in silicone-rubber are prepared with die press method. The samples prepared with 3 wt%, 5 wt%, 10 wt% and 15 wt% of nanosize carbon are named as S1,S2,S3 and S4, respectively. Pure silicone rubber sample, named asS0, is also prepared to compare the results.
2.2. Characterization of Composites
The structural characterization of the filler CB powder is carried out by powder X-ray diffraction performed on a Philip X’Pert Pro system while using CuKα1 (λ = 1.54A◦) radiation. Transmission Electron Microscope (TEM, JEOL 3010) and Scanning Electron Microscope (SEM, Carl Zeiss, EVO-MA 15) are used to analyze the size of filler particles and morphology of composite samples respectively. Four point resistivity probe and Electrometer (High Resistance meter) Model 6517A from Keithely are used for measurement of volume resistivity.
(b) (a)
(c)
Figure 1. (a) Set up for measurement of EM parameters and SE. (b) Sample holder with calibration standards. (c) S-parameter flow graph.
Thru-Reflect-Line (TRL) calibration technique in X and Ku bands. The levels of isolation (S2 1-parameter) are found ∼ −80 dB for perfect electric conductor (PEC). Rectangular samples of sizes 22.86 mm×10.16 mm and 15.80 mm×7.9 mm are cut from the prepared composites and measurements carried out in X and Ku bands to cover the frequency range 8–18 GHz. S-parameters (Reflection and Transmission) are measured in both bands. Complex permittivity and permeability properties are extracted from these parameters using Nicolson-Ross procedure [21]. Different components of SE viz. reflection, absorption and total SE are also calculated from the measuredS-parameters.
3. RESULTS AND DISCUSSION 3.1. Filler Material Characterization
Figure 2(a) shows the powder XRD spectrum of pure carbon black (CB) which is used as filler material in the present study. The pure hexagonal graphitic phase is seen from the spectrum. The average crystalline diameter determined from the XRD spectrum by using Debby Scherer equation is found in the range of 15–20 nm. The corresponding TEM image of powder is shown in Figure 2(b). From TEM image, it is observed that CB particles are distributed in the form of aggregates, wherein the individual particle size is found∼15 nm. These aggregates due to high surface area result into enhanced interfacial polarization causing increased attenuation of the electromagnetic wave energy.
(a) (b)
3.2. Volume Resistivity and DC Conductivity of Composites
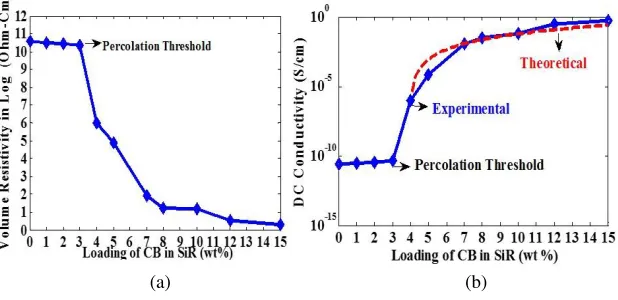
The volume resistivity of CB-SiR composites as a function of CB concentration is shown in Figure 3(a). Corresponding DC conductivity profile is shown in Figure 3(b).
(a) (b)
Figure 3. Effect of CB loading on (a) Volume resistivity (b) DC conductivity.
From Figure 3(a), it is observed that composites having 0–3 wt% CB loading show high resistivity of the order of 1011Ωcm. However, increasing the concentration of CB up to 4 wt%, the resistivity value sharply decreases by nearly five orders of magnitude to around 106Ωcm. With further increasing the CB content, the rate of decrease in resistivity with reference of CB concentration remains quite high up to loading of 8 wt%. Beyond 8 wt% CB concentration, rate of decrease in resistivity w.r.t. CB is very small, i.e., now the fall in resistivity is much less. The studies are continued up to 15 wt% of CB. The critical concentration level, where the system transforms from insulating to conducting stage, is known as percolation threshold. From the curve, percolation threshold is found at 3 wt%, and percolation zone can be defined in the range of 3–8 wt% loading of CB. Further, theoretical percolation threshold of CB as filler in polymer matrix can be explained by equation given by Janzen [22, 23]. The calculated value of percolation threshold is 3.6 wt% which closely matches with experimental value
∼ 3.0 wt% (Figure 3(a)) in the present study. Although the calculated value of percolation threshold is very close to the experimental data, selection of matrix and method of preparation of composites by proper dispersion of filler in matrix is very important to obtain low percolation threshold in the composites. We have achieved low percolation threshold by selecting appropriate CB with high surface area and high pore volume (DBP value) as filler material and room temperature curable silicone rubber (medium viscosity) as binder matrix.
Figure 3(b) shows the DC conductivity profile of the composites. The change in the conductivity beyond the percolation threshold is expressed using the following power law equation [24, 25].
σ =K(ρ−ρc)t (1)
whereσis the conductivity of composite,K the constant of proportionality,ρthe mass fraction of filler material, ρc the mass fraction of carbon black at the percolation threshold, andt the critical exponent which governs the scaling behaviour in the region ρc. The observed value of t = 2.96 is found in the range of reported values 2 to 4.5 for such systems [26, 27].
3.3. Morphology Studies of Composites
(d)
(a) (b)
(c)
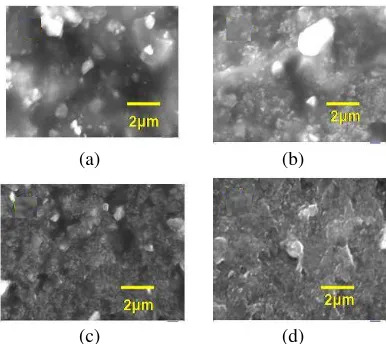
Figure 4. SEM Micrographs of CB-silicone rubber composites. (a) 3 wt%. (b) 5 wt%. (c) 10 wt%. (d) 15 wt%.
denser than the samples with lower concentrations. The composite with 15 wt% CB shows further change in morphology with layered structure (Figure 4(d)).
The insulating behaviour of composite with lower loading (1 wt% and 2 wt%) is observed due to insufficient network to conduct the electricity, as aggregates are largely spaced in the matrix. This behaviour continues up to 3 wt% loading of CB due to lack of continuous network. However, in 5 wt% composite, increase in dc electrical conductivity of the composites is observed due to formation of continuous network of aggregates which can provide effective conducting path [28]. Increase in the electrical conductivity of composites is observed at higher concentration of 10 wt% because of formation of strong chain structure of aggregates of CB. Further, for the composite with 15 wt% of CB, the flow of electron becomes much easier due to the formation of layer structure, which enhances the conductivity.
3.4. Complex Permittivity (ε=ε−jε) and Permeability (μ=μ−jμ) Properties
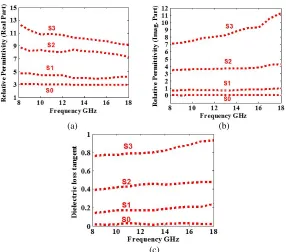
The real (ε) and imaginary (ε) parts of complex permittivity of composite samplesS0 toS3 are shown in Figures 5(a) and 5(b), respectively. From the figures, it is observed that both ε and ε values of composites increase with increasing the concentration of CB. The corresponding loss tangent (tanδe) values also increase with CB content (Figure 5(c)). Values ofε andεfor pure silicone rubber (sample
S0) are found ∼3 and ∼0.01, respectively, over 8–18 GHz, whereas for sampleS1 (3 wt% CB) ε and
ε values are increased to ∼5 and ∼1, respectively, and found almost constant over 8–18 GHz. With further increasing the concentration of CB (sampleS2 −5 wt%)ε andεshow dispersion characteristics with frequency and loss tangent values at∼0.45–0.5. At further higher concentration of CB (sampleS3
−10 wt%), composite shows more dispersion characteristics with increased loss tangent values∼0.8–0.9 over 8–18 GHz. The dispersion behaviour of imaginary part of permittivity [29] in the composites is given as:
ε = σdc
ω +ε
relax (2)
The enhanced values of loss factor in sampleS2 andS3are observed due to formation of conductive network between CB aggregates as depicted in SEM images resulting in increase in dc conductivity (σdc). As a result, the dielectric loss of composites increases. EM characterization results of sample
(b) (a)
(c)
Figure 5. Complex permittivity vs. frequency. (a) Real part (ε). (b) Imaginary part (ε). (c) Dielectric loss tangent (tanδe).
3.5. Microwave Absorption Properties
Reflection Loss (RL) of the composites as a microwave absorber is calculated using the measured data of complex relative permittivity (ε) and relative permeability (μ) based on transmission line model. The normalized input impedance (Zn), reflection coefficient (Γ) and RL (in dB) for a PEC backed single layer absorber under normal incidence of EM wave are defined as [30]:
Zn = Zm
Z0 =
μ εtanh
j
2πf d c
√
μ
(3)
Γ = Zn−1
Zn+ 1 (4)
R.L. = 20 log10|Γ| (5)
where f is the frequency of the EM wave; dis the thickness of the absorber; c is the velocity of light in the free space;εandμ are the relative complex permittivity & permeability;Z0 is the characteristic impedance of free space∼377 Ω;Zmis the impedance of material;Znis the normalized input impedance. Figure 6(a) shows the calculated RL (microwave absorption) values for samplesS0,S1,S2 and S3 for composite thickness 2 mm.
(a) (b)
Figure 6. Reflection loss (RL) vs. frequency (a) RL of samples S0–S3 at thickness 2 mm (b) RLof sample S2 at different thicknesses.
(a) (b)
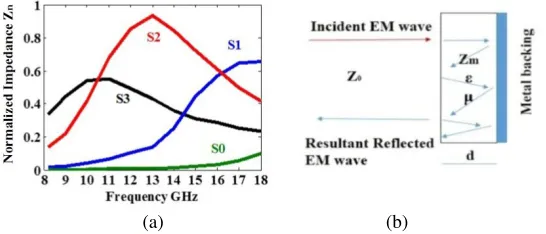
Figure 7. (a) Normalized impedance vs. frequency of all samples at thickness 2 mm. (b) Schematic of RL phenomenon of a single layer MW absorber.
maximum RL ∼ −28 dB is observed at 14 GHz, with more than 90% MW absorption (RL> −10 dB) over 12–18 GHz (6 GHz BW).
Although sampleS3 shows high value of loss tangent in comparison to sampleS2(Figure 5(c)), the EM wave reflects from the front surface of the absorber (Figure 7(b)), due to major contribution from impedance mismatch (Figure 7(a)). As a result, the absorption of microwave energy decreases in sample
3.6. Shielding Effectiveness (SE)
The shielding effectiveness of a material is measured in terms of reduction in magnitude of incident power/field upon transition across the shield material. The total shielding effectiveness (SET) is expressed as [31]:
SET =SER+SEA+SEM = 10 log10[PT/PI] = 20 log10[ET/EI] = 20 log10[HT/HI] (6) Three different mechanisms, namely reflection (R), absorption (A) and multiple internal reflections (M), contribute towards overall attenuation. Experimentally, shielding effectiveness is measured using Vector Network Analyzer (VNA) system. S-parameters (S11 & S21) are measured with VNA system. Further, reflection (SER), absorption (SEA) components of SE and total shielding effectiveness (SET) are calculated using these parameters as [32, 33]:
SER = 10 log 10(1−R) = 10 log 10
|1−S11|2
(7)
SEA = 10 log 10(1−Ae) = 10 log 10 T 1−R
(8)
SET = 10 log 10|T|= 10 log 10|S21|2 =SER+SEA (9) Results of shielding effectiveness for samples S0–S4 measured in X and Ku bands are shown in Figure 8. Figures 8(a) and 8(b) show the reflection component (SER), and Figures 8(c) and 8(d) show the absorption component of SE (SEA) over X and Ku bands. From the figures it is observed that SER decreases with increasing the frequency. Figures 8(e) and 8(f) show the variation of total shielding effectiveness (SET) with frequency in X and Ku bands. The total shielding effectiveness is determined from the measured values of transmission parameters (S21) as per Eq. (9). From the figures, it is clear that SE of the composites increases with increasing the loading of CB in matrix. The composite with 15 wt% of CB (samples S4) shows ∼ −40 dB SE over X and Ku bands. The observed Shielding effectiveness of composites results from high values of electrical conductivity of samples, which
(b) (a)
(c)
(e)
(d)
(f)
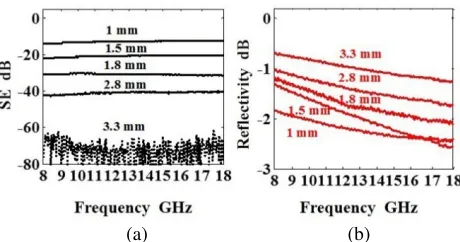
Figure 9(a) and 9(b) show the effect of composite thickness on shielding effectiveness and reflectivity for 15 wt% CB composite in 8–18 GHz. The shielding effectiveness increases from −15 dB to −40 dB by varying the thickness from 1 mm to 2.8 mm respectively for this composition. Further increasing the thickness (∼ 3.3 mm), the transmission values approach PEC response (Figure 9(a)). Reflectivity profile of the composite does not show any significant change (values are found within ∼1–2 dB) with thickness (Figure 9(b)). From the above studies, it is clear that dominant phenomenon for increase in shielding effectiveness is absorption of microwave energy within the composites.
(a) (b)
Figure 9. Effect of composite thickness on (a) shielding effectiveness, (b) reflectivity.
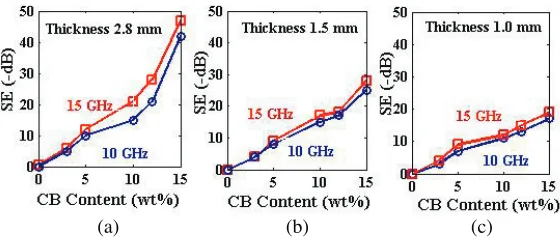
3.6.2. Effect of Filler Content on SE
The SE of composite depends on the conductivity, thickness of sample and frequency of operation. To find SE values of the composites for different contents of CB, we plot graphs for different thicknesses of the composites as shown in Figure 10. It is observed that SE values increase with increasing CB content in the composites irrespective of thickness. However, the values are found more for higher thickness. From these curves, loading of CB required to get desired SE values can be determined for a given thickness and frequency.
Details of conductivity, RL and SE values of composites having thickness 2.8 mm are summarized at Table 1.
Table 1. Conductivity, RL and SE of Composites (thickness 2.8 mm).
Sample Composition Conductivity (S/cm)
Tangent Loss
(tanδe)
RL (−dB) at 13 GHz
SE (−dB)
S0 0 wt% 2.63×10⁻¹¹ ∼0 ∼0 ∼0
S1 3 wt% 6.50×10⁻¹¹ ∼0.2 ∼2 ∼5
S2 5 wt% 1.25×10⁻⁶ ∼0.4 ∼29 ∼10
S3 10 wt% 5.95×10⁻² ∼0.8 ∼9 ∼15
(b)
(a) (c)
Figure 10. SE vs. content of CB (wt%) at thickness (a) 2.8 mm, (b) 1.5 mm, (c) 1.0 mm.
4. CONCLUSION
Conducting carbon black (CB) — silicone rubber composites are prepared, and their morphology, DC conductivity, dielectric & microwave absorption properties and shielding effectiveness are investigated in the frequency range of 8–18 GHz. The volume resistivity and DC conductivity measurements suggest low percolation threshold at 3 wt% of CB for these composites and percolation zone found to be 3– 8 wt% loading of CB. The composites with 5 wt% loading of CB show more than 90% absorption (RL>−10 dB) in X and Ku bands with thicknesses 2.7 mm and 1.9 mm, respectively. Further, Shielding Effectiveness (SE) studies of composites are carried out with different concentrations of CB. An SE of
∼ −40 dB is achieved at 15 wt% CB-rubber composites with thickness 2.8 mm over the frequency range 8–18 GHz. The SE increases with increasing the thickness of the composites. SE values can be tuned in the range of−15 dB to−40 dB by varying the thickness from 1 mm to 2.8 mm for the same composition. The prepared composites with selected filler concentration have potentials for microwave absorption in Stealth Technology and also for EMI shielding of various equipments in military and civil areas.
ACKNOWLEDGMENT
The authors are thankful to Mr. Manish Kumar, Radiation & Solar Devices Group for support in DC conductivity measurements and Mrs. Anjali Bhatia, Head, Camouflage Division and Mr. V. S. Chauhan, Microwave Group, Defence Laboratory, Jodhpur for their valuable suggestions and technical support during experimental work.
REFERENCES
1. Knott, E. F., J. F. Shaeffer, and M. T. Tully, Radar Cross Section, Artech House Inc., Norwood, 1993.
2. Vinoy, K. J. and R. M. Jha, Radar Absorbing Materials: From Theory to Design and Characterization, Kluwer Academic Publishers, Boston, MA, 1996.
3. Qin, F. and C. Brosseau, “A review and analysis of microwave absorption in polymer composites filled with carbonaceous particles,” Journal of Applied Physics, Vol. 111, 061301-24, 2012.
4. Singh, V. K., A. Shukla, M. K. Patra, L. Saini, R. K. Jani, S. R. Vadera, and N. Kumar, “Microwave absorbing properties of thermally reduced graphene oxide/nitrile butadiene rubber composite,”
Carbon, Vol. 50, 2202–2208, 2012.
5. Bhattacharya, P., S. Sahoo, and C. K. Das, “Microwave absorption behavior of MWCNT based nanocomposites in X-band region,” Express Polymer Letters, Vol. 7212-223, 2013.
9. Savi, P., M. Miscuglio, M. Giorcelli, and A. Tagliaferro, “Analysis of microwave absorbing properties of epoxy MWCNT composites,”Progress In Electromagnetic Research Letters, Vol. 44, 63–69, 2014. 10. Saib, A., L. Bednarz, R. Daussin, C. Bailly, X. Lou, J. M. Thomassin, C. Pagnoulle, C. Detrembleur, R. Jerome, and I. Huynen, “Carbon nanotube composites for broadband microwave absorbing materials,” IEEE Transactions on Microwave Theory and Techniques, Vol. 54, 2745–2754, 2006. 11. Al-Hartomy, O. A., A. Al-Ghamdi, N. Dishovsky, R. Shtarkova, V. Iliev, I. Mutlay, and F.
El-Tantawy, “Dielectric and microwave properties of natural rubber based nanocomposites containing grapheme,”Materials Sciences and Applications, Vol. 3, 453–459, 2012.
12. Liu, X., Z. Zhang, and Y. Wu, “Absorption properties of carbon black/silicon carbide microwave absorbers,”Composites: Part B, Vol. 42, 326–329, 2011.
13. Wang, M., Y. Duan, S. Liu, X. Li, and Z. Ji, “Absorption properties of carbonyl-iron/carbon black double-layer microwave absorber,” Journal of Magnetism and Magnetic Materials, Vol. 321, 3442–3446, 2009.
14. Vinayasree, S., M. A. Soloman, V. Sunny, P. Mohanan, P. Kurian, P. A. Joy, and M. R. Anantharaman, “Flexible microwave absorbers based on barium hexaferrite, carbon black, and nitrile rubber for 2–12 GHz applications,” Journal of Applied Physics, Vol. 116, 24902–24907, 2014.
15. Wang, X., “Investigation of electromagnetic shielding effectiveness of nano-structural carbon black-ABS composites,”Journal of Electromagnetic Analysis and Applications, Vol. 3, 160–164, 2011. 16. Dinesh, P. G., N. M. Renukappa, T. Pasang, M. Dinesh, and C. Rangananthaiah, “Effect of
nanofillers on conductivity and electromagnetic interference shielding effectiveness of high density polyethylene and polypropylene nanocomposites,” European Journal of Advances in Engineering and Technology, Vol. 1, 16–28, 2014.
17. Das, N. C., D. Khastgir, T. C. Chaki, and A. Chakraborty, “Electromagnetic interference shielding effectiveness of carbon black and carbon fiber filled EVA and NR based composites,” Composites Part A: Applied Science and Manufacturing, Vol. 31, 1069–1081, 2001.
18. Li, L. and D. D. L. Chung, “Electrical and mechanical properties of electrically conductive polyethersulfone composite,”Composites, Vol. 25, 215–224, 1994.
19. Chung, D. D. L., “Electromagnetic interference shielding effectiveness of carbon materials,”Carbon, Vol. 39, 279–285, 2001.
20. Shui, X. and D. D. L. Chung, “Nickel filament polymer-matrix composites with low surface impedance and high electromagnetic interference shielding effectiveness,” Journal of Electronic Materials, Vol. 26, 928–934, 1997.
21. Nicolson, A. M. and G. F. Ross, “Measurement of the intrinsic properties of materials by time domain techniques,” IEEE Trans. on Instrumentation and Measurements, Vol. 19, 377, 1970. 22. Janzen, J., “On the critical conductive filler loading in antistatic composites,” Journal of Applied
Physics, Vol. 46, 966–969, 1975.
23. Donnet, J. B., R. C. Bansal, and M. J. Wang,Carbon Black, 2nd Edition, Marcel Dekker Inc., New York, 1993.
24. Stauffer, D. and A. Aharony, Introduction to Percolation Theory, 2nd Edition, Taylor & Francis, London, 1994.
26. Foulger, S. H., “Reduced percolation threshold of immiscible conductive blends,” Journal of Polymer Science Part: B Polymer Physics, Vol. 37, 1899–1910, 1999.
27. Belberg, I., “Tunneling and non-universal conductivity in composite materials,” Physical Review Letters, Vol. 59, 1305, 1987.
28. Wessling, B., “Electrical conductivity in heterogeneous polymer systems V(1): Further experimental evidence for a phase transition at the critical volume concentration,” Polymer Engineering Science, Vol. 31, 1200-6, 1991.
29. Achour, M. E., M. Malhi, J. L. Miane, F. Carmona, and F. Lahjomri, “Microwave properties of carbon black-epoxy resin composites and their simulation by means of mixture laws,” Journal of Applied Polymer Science, Vol. 73, 969, 1999.
30. Kim, S. S., S. B. Jo, H. I. Gueon, K. K. Choi, J. M. Kim, and K. S. Churn, “Complex permeability and permittivity and microwave absorption of ferrite-rubber composite in X-band frequencies,”
IEEE Trans. on Magnetics, Vol. 27, 5462, 1991.
31. Paul, C. R., Introduction to Electromagnetic Compatibility, 2nd Edition, John Wiley and Sons, New York, 2005.
32. Saini, P., V. Choudhary, B. P. Singh, R. B. Mathur, and S. K. Dhawan, “Enhanced microwave absorption behavior of polyaniline-CNT/polystyrene blend in 12.4–18 GHz range,” Synthetic Metals, Vol. 161, 1522–1526, 2011.