109
Vol 5 Issue 10 October, 2017
THE INTERNATIONAL JOURNAL OF
BUSINESS & MANAGEMENT
Effect of Micro Savings on Poverty Reduction in Central Region of Ghana
1. Introduction
Poverty has been identified as one of the world’s biggest problems, the international community recognises that reducing global poverty is one of the major development challenges of the twenty-first century (Kirsten 2011, Dupas & Robinson, 2012). Indeed, It was estimated in 2009 that over 1.8 billion of the worlds population lived on less than US$2 a day (UNESCAP-ADB-UNDP, 2012); and in 2010, 1.4 billion people lived at or below the level of US$1.25 per day (UNDP 2010).
A variety of measures have been adopted over the years by governments across countries to reduce the poverty gap. The World Bank for instance has adopted the twin goal of reducing the percentage of people living on less than $1.25 a day to 3 percent by 2030 and improving the living standards of the bottom 40 percent of the population in every country by the year 2030 (World Bank, 2015). Stewart, Van Rooyen, Dickson, Majoro and De Wet (2010) contend that in response to the Millennium development goals, several interventions have been adopted by countries to eradicate poverty. These interventions include support programme for enterprise development (SPEED), “Emprendedores and Tecnología" (EMPRETEC), Business Assisted Funds(BAF) and microfinance interventions among others. Microfinance interventions gained significant attention when the United Nations in its millenium development goals pledged to halve, the proportion of people whose income was less than $1 a day between 1990 and 2015 and directed governments across the world to assist in reducing extreme poverty and hundger by the year 2015 (UNDP, 2012).
Microfinance interventions entails the provision of financial services to low-income individuals and households, as well as micro, small and medium enterprises (MSMEs), using specially designed methodologies that ensures sustainability for lenders and improvement in the standard of living for its subscribers (PWC, 2016). Microfinance interventions which have widely been recognized as one of the most important engines of poverty reduction and economic development encompasses micro savings, access to credit, microinsurance and micro credit provided to people who operate micro, small and medium enterprises. It contributions to individual and social welfare, business creation and expansion particularly for MSME’s has been underscored by many studies. Microfinance interventions affords poor clients access to financial institutions, expand consumption, absorb disruptive shocks, manage risks and invest in durable goods, health and education which ultimately leads to economic development and poverty reduction (Cheston, Conde, Bykere, and Rhyne, 2016) .
Samuel N. Ampah
Ph.D. Fellow, Kenyatta University, Nairobi Kenya
Jagongo O. Ambrose
Senior Lecturer, Department of Accounting & Finance, Kenyatta University, Nairobi, Kenya
Job O. Omagwa
Lecturer, Department of Accounting & Finance, Kenyatta University, Nairobi, Kenya
Siaw Frimpong
Senior Lecturer, University of Cape Coast, Ghana
Abstract:
The study sought to investigate the effect of micro savings on poverty reduction from the perspective of microfinance clients who are also entrepreneurs of micro small and medium enterprises in the Central Region of Ghana. The Ghana Living Standards Survey (2014) found that over 6.4 million of Ghanaians representing 24.2 percent of the population lived below the poverty line in spite of the numerous interventions instituted by government and development partners over the years to address poverty. The Specific objectives of the study was to establish the effect of micro savings on poverty reduction in Central Region of Ghana. One hypotheses was formulated to cover the specific objective which was operationalized into four sub-hypotheses. Using cluster sampling techniques, the study sampled 370 entrepreneurs of micro small and medium enterprises. Questionnaire was used as the data collection instrument in an exercise that took place in November and December 2016. SPSS was used to analyse the data using cross tabulations and multiple regression analysis. The study found that micro savings had a statistically significant positive effect on growth in income and acquisition of business assets. It however had a relatively weak positive effect on consumption expenditure and a moderate effect on ability to educate children as poverty indicators. Accordingly the study rejected all the null hypothesis and concluded that microfinance interventions are effective at reducting poverty in Central Region of Ghana. The study cites limitations encountered and recommends areas for further studies.
110
Vol 5 Issue 10 October, 2017
The relationship between microfinance interventions and poverty reduction shows that cash flow requirements are not the only burden which impacts microfinance clients (Odell, 2009; Arun, Imai and Sinha, 2006 & Rosenberg, 2010). The health status of household members, education for children and funerals for family members also place a heavy burden on microfinance clients and threaten their ability to fulfill loan repayment obligations. According to Duvendack, Palmer-Jones, Copestake, Hooper, Loke and Rao (2011) microfinance interventions has gained considerable international acceptance as an imperative poverty reduction tool in most developing countries. This assertion is supported by Dzisi and Obeng(2013); Stewart et al., (2010) and Stewart et al., (2012). who have all argued that microfinance interventions are among the few recent innovations which have held much hope for poverty reduction in developing countries. The choice of the Central Region of Ghana as the study locale was based on a 2014 study which ranked the region as the fourth pourest in Ghana in spite of its unique characteristics as the seat of education, the heartbeat of tourism in Ghana, the availability and spread of microfinance institutions and enterprises and the availability of data to support the study.1.1. Statement of the Problem
The Ghana Living Standards Survey (2014) indicates that over 6.4 million of Ghanaians representing 24.2 percent of the population lives below the $1.25 poverty mark set by the World Bank. The study further stated that about 8.4 per cent of Ghanaians are extremely poor and lives below the poverty line of US$1 mark a day. The report further indicate that 18.8 percent of the people in Central Region of Ghana, with a population of 2.2 million (GLSS, 2014) lives below the poverty line. To address the poverty gap, the Government of Ghana implemented several interventions ranging from livelihood enhancement programs to support program for enterprise development and the setting up of microfinance institutions. For instance and In 2006, the government of Ghana established the microfinance and small loans centre (MASLOC) under the Ghana Poverty Reduction Strategy (GPRS) II to provide loans to the marginalized productive poor as a tool for reducing poverty and creating jobs (BOG, 2015).
Despite these interventions the number of people living with poverty continues to rise in rural Ghana (GSS, 2014). While several factors could be responsible, this study concentrates on the role of microfinance in the poverty reduction strategy of Ghana. Leading advocates of microfinance interventions such as Yeboah (2010) and Stewart et.al. (2012) have argued that, microfinance helps lift people out of poverty by raising incomes and consumption, not just smoothing them. However, Arhin-Sam (2013), Roodman and Morduch (2013) and Awarwoyi (2014) have all found statistically insignificant association between microfinance interventions and poverty reduction. Given the findings of the above studies and the lapse of time, the projection of microfinance as a poverty reduction strategy needed to be revisited. This study therefore sought to investigate whether new evidence has emerged to support the ability of microfinance interventions to eradicate poverty or otherwise from the point of view of clients who own micro small and medium enterprises in Central Region of Ghana to give a clearer understanding as to how microfinance interventions affect poverty reduction in Ghana.
1.2. Objective of the Study
The specific objective of the study was to establish the effect of microsavings on poverty reduction in Central Region of Ghana.
2. Literature Review
According to Ahmed-Karim and Alders-Sheuya (2014), microsavings have been much less at the forefront in the discourse of microfinance than microcredit. They contend that microsavings are generally less a financially profitable proposition for lending institutions than microcredit. However, providing the poor with access to save their money has been found by a number of studies to have promising effects on poverty reduction (Dupas & Robinson, 2012 and Pomaranz, 2013).This assetion is supported by Prina (2015) whose study on banking the poor in Malawi found that providing access to accounts to rural farmers resulted in increased input usage, higher crop sales and greater household expenditure over the subsequent agricultural year.
The impact of microfinance on income has been analyzed at the individual, household and enterprise levels. Microfinance impact studies assume the borrower is the sole operator of a single income generating activity, the output of which is constrained either by lack of capital or by the high marginal cost of credit relative to its marginal returns. Easing the capital constraint permits the operator to increase output, net income, profits, and hence their own welfare (de Mel et al. 2008). Deininger and Liu (2013) conducted various studies on different microfinance programmes in numerous countries and found strong evidence of positive relationship between access to credit and the borrower‘s level of income. The authors indicated that the middle and upper poor received more benefits from income-generating credit initiatives than the poorest.
Copestake et al (2001) estimated the effect of an urban credit programme – a group-based microcredit programme in Zambia- and found that microcredit has a significant impact on the growth in enterprise profit and household income in the case of borrowers who have received a second loan. With regards to association between microcredit and income, Awarwowyi (2014) relying on 60 estimates drawn from nine primary studies found that about 81.67% (49 estimates) were statistically insignificant, while the remaining estimates presented a positive and statistically significant weighted average. Thus, based on reported FEEs, he concluded that there was no significant association between microcredit and income.
111
Vol 5 Issue 10 October, 2017
Pitt and Khandkar (1998) and Morduch (1998) studies and was unable to replicate their positive findings on consumption smoothing. Instead they concluded that there was no statistically significant effect between access to credit and consumption expenditure, contradicting the strongest findings of those studies.Ownership of financial and non-financial assets has also been used as a proxy to measure poverty reduction as an alternative measure of consumption-based welfare. One of the merits of these asset-based indicators is the ease with which they can be measured compared with consumption based indicators (Khanom, 2011). An increase in the number of non-financial assets purchased for the household is regarded as a potentially strong indicator of the effect of a microfinance programme on clients as it serves as a measure of the wealth of a household (Batman, 2011). A study by Yeboah (2010) revealed that participation in SAT’s microfinance programme was strongly associated with increased expenditure by clients for the acquisition of household assets. In a similar study, Adjei et. al. (2009) using 547 respondents in Ghana found that an important form of self-insurance against crises is building up a household’s assets, which can reduce vulnerability through sale of assets to meet immediate consumption needs; improve credit worthiness, thereby improving the household’s borrowing chances during a crisis; and, finally, a larger and more diverse asset base can reduce covariate risk. In contrast, Stewart, Rooyen, Korth, Chereni, Da Silva and De Wet (2012) in their study captioned microfinance, silver bullet or poisoned chalice, found that micro credit has mixed impacts on levels of savings and accumulation of assets and in most cases reduce expenditure. The study also found no evidence that micro savings enables engagement in economic opportunities, although in some cases, but not all, it increases income, savings, expenditure and the accumulation of non-financial assets.
Education, one of the measures of poverty reduction as used in this study has been identified as the most important tool in providing people with the basic knowledge, skills and the competencies to improve their quality of life at all levels of development (Ampiah & Adu-Yeboah, 2009). Ghanaians therefore place high value on education and invest in their children’s education. According to Adjei et. al. (2009) who conducted a study in Ghana on the role of microfinance in asset building using clients of Sinnapi Aba Trust (SAT) as a case study. They found that for every 100 Ghana Cedis increase in the loan amount; expenditure on children’s education increased by five Ghana Cedis and concluded that established clients were found to be in a better position to contribute towards the education of their children and payment of healthcare for members of their households than new clients.
3. Methodology
The study adopted explanatory research design. Explanatory research design is appropriate where a researcher is attempting to explain how a phenomena operates by identifying the underlying factors that cause change in it in which case there is no manipulation of the independent variable (Kerlinger & Lee, 2000). As noted by Saunders, Lewis and Thornhill (2012) explanatory research is the systematic inquiry in which a researcher does not have direct control of the independent variables because their manifestations have already occurred. The target population for this study consisted of 10,000 active microfinance clients who were also operators of micro small and medium enterprises in Central Region of Ghana. The study combined clients of the various microfinance institutions into one population to have a fair representation in the study locale.
The study adopted the two-staged cluster sampling method in selecting respondents. Clients of microfinance institutions were grouped according to the various sub groups already in existence such as women associations, farmers groups, fishermen association, micro small and medium enterprises and households. A simple random sample was selected within each of these groups which formed the cluster. According to Cooper and Schindler (2003), cluster sampling techniques is appropriate when sampling "natural" but relatively heterogeneous groupings of a population.
To ensure that the sample size was representative of the population, the study adopted the formula given by Israel (2009) as follows:
= /[1 + ( )] where: n is the sample size, N the population and e the alpha level. Accordingly, the sample size for the study
was 370 given a population of 10,000 at a 5% confidence interval. The study utilized multiple regression analysis to analyse data. The statistical package for services solution (SPSS) was used to analyse the data. Where the p value was found to be less than the significant value of 0.05, the null hypothesis was rejected.
4. Results and Findings
The specific objective of the study was to ascertain the effect of microsavings on poverty reduction. Four sub hypotheses were formulated for each of the four outcome variables of poverty reduction (Growth in income, increase in consumption expenditure, acquisition of business assets and ability to educate children in Central Region of Ghana.
4.1. Microsavings and Growth in Income H01a
Table 1a to 1c presents the results of the above sub hypothesis. In table 1a, the regression function is modelled by taking microsavings as the predictor variable and growth in income as the outcome variable.
Model R R
Square
Adjusted R Square
Std. Error of the Estimate
Change Statistics
R Square Change
F Change
df1 df2 Sig. F
Change
1 .783a 0.613 0.609 0.48458 0.613 155.621 3 295 0.000
Source: Study data, 2016; Significance Level = 0.05
a. Predictors: (Constant), Rate of savings, Interest rates, Type of savings
b. Dependent Variable: Growth in Income
112
Vol 5 Issue 10 October, 2017
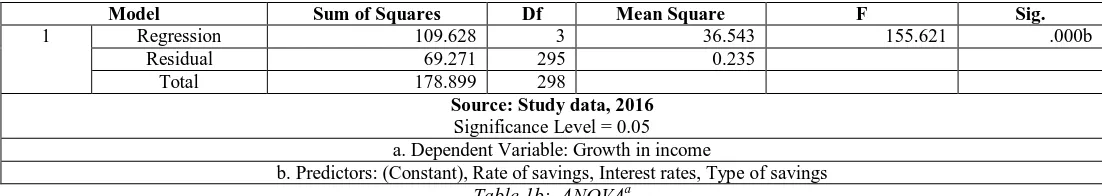
From table 1a above, a strong positive correlation is observed between microsavings (rate of savings, interest rates and type of savings) and growth in income (R =0.783 and P=0.000). The results further indicate that the R2 which is a measure of the amount of variability in one variable that is shared by the other variables is 61.3%, indicating that microsavings accounts for 61.3 percent of growth in income (R2 = 0.613). The adjusted R2tells us how much variance in Y would be accounted for if the model had been derived from the population. The Adjusted R2 is 60.9 percent and therefore very similar to the R2indicating that the cross-variability of this model is very good.Table 1b below presents results of the models overall significance in the form of analysis of variance. The ANOVA tests whether the model is significantly better at predicting the outcome than using the mean as a best guess.
Model Sum of Squares Df Mean Square F Sig.
1 Regression 109.628 3 36.543 155.621 .000b
Residual 69.271 295 0.235
Total 178.899 298
Source: Study data, 2016
Significance Level = 0.05 a. Dependent Variable: Growth in income
b. Predictors: (Constant), Rate of savings, Interest rates, Type of savings
Table 1b: ANOVAa
Results from table 1b above indicate that the model overall is statistically significant with a P-value less than 5 percent (p=0.000). The F-ratio represents the ratio of the improvement in prediction that results from fitting the model, relative to the inaccuracy that still exists in the model. In this case F=155.621 meaning that the model significantly improved our ability to predict the outcome variable better. From the foregoing, the sub-hypothesis, H01a which states that microsavings does not have a statistically significant effect on
growth in income is not supported and therefore rejected.
Table 1c below presents results of the regression coefficient (beta values) for microsavings and growth in income to indicate whether microsavings is significant in explaining growth in income.
Model Unstandardized Coefficients Standardized Coefficients T Sig. Collinearity Statistics
B Std. Error Beta Tolerance VIF
1 (Constant) 0.788 0.170 4.632 0.000
Type of savings 0.259 0.046 0.312 5.631 0.000 0.429 2.332
Rate of savings 0.014 0.058 0.009 0.250 0.802 0.925 1.081
Interest rate 0.351 0.038 0.523 9.275 0.000 0.413 2.420
Source: Researcher, 2017
a. Dependent Variable: Growth in income b. Significance level = 0.05
Table 1c: Coefficientsa
From table 1c above, the study finds that Type of Savings (P=0.000) and Interest Rates (P=0.000) are statistically significant microsavings indicators in explaining growth of income as a poverty indicator. Rate of savings is however not significant given that P=0.802. The beta values tell us to what degree each predictor affects the outcome if the effects of all other predictors are held constant. The implication of this is that as type of savings increases by one unit, growth in income increases by 0.259 units. Similarly as Interest Rates increase by one unit, growth in income increases by 0.351 units. The regression function for the sub-hypothesis (H01a) is extracted as follows:
Y1 = 0.788 +0.259X1 +0.351X3
Where Y1 = Growth in Income, X1 = Type of Savings andX3 = Interest Rate.
The above findings indicate that Microsavings have a significant positive relationship with growth in income. This finding is supported by Dupas and Robinson (2012) whose field experiment in Kenya found that market women who subscribed to the savings products significantly increased their income over the period of the intervention.
4.2. Microsavings and Increase in Consumption ExpenditureH01b
113
Vol 5 Issue 10 October, 2017
Model R R
Square
Adjusted R Square
Std. Error of the Estimate
Change Statistics
R Square Change
F Change
df1 df2 Sig. F Change
1 .393a 0.154 0.146 0.34947 0.154 17.990 3 296 0.000
Source: Study data, 2016 Significance Level = 0.05
a. Predictors: (Constant), Rate of savings, Interest rates, Type of savings b. Dependent Variable: Increase in consumption expenditure
Table 2a: Model Summaryb
Results in table 2a above indicate a weak positive correlation between Microsavings and increase in consumption expenditure (R = 0.393 and P = 0.000). This could imply that people who are active savers are reluctant to spend on consumption. The results further indicate that microsavings accounts for only 15.4 percent of increase in consumption expenditure (R2 = 0.154). According to Field (2013), the adjusted R2 gives some idea of how well the model generalizes and should be very close to the value of R2. The Adjusted R2 is 0.146 and is close to the R2 indicating that the cross-variability of this model is very good.
Table 2b below presents results of the models overall significance in the form of analysis of variance (ANOVA).
Model Sum of Squares Df Mean Square F Sig.
1 Regression 6.591 3 2.197 17.990 .000b
Residual 36.151 296 0.122
Total 42.743 299
Source: Study data, 2016
Significance level = 0.05
a. Dependent Variable: Increase in consumption expenditure b. Predictors: (Constant), Rate of savings, Interest rates, Type of savings
Table 2b: ANOVAa
Table 2b shows that the model overall is statistically significant with P< 5 (p=0.000). The F-ratio which represents the ratio of the improvement in predicting that results from fitting the model, relative to the inaccuracy that still exists in the model is 17.990 indicating that the model improved our ability to predict the outcome variable better. From the foregoing, the sub-hypothesis, H01b
which states that microsavings does not have a significant effect in predicting increase in consumption expenditure is hereby not supported and therefore rejected.
Table 2c below presents results of the regression coefficient (beta values) for microsavings and increase in consumption expenditure to indicate whether microsavings are significant in explaining increase in consumption expenditure.
Model Unstandardized Coefficients Standardized Coefficients t Sig. Collinearity Statistics
B Std. Error Beta Tolerance VIF
1 (Constant) 2.822 0.123 23.003 0.000
Type of savings -0.204 0.033 -0.500 -6.133 0.000 0.429 2.329
Interest rates -0.113 0.042 -0.152 -2.728 0.007 0.925 1.082
Rate of savings 0.059 0.027 0.180 2.171 0.031 0.414 2.418
Source: Study data, 2016 Significance level = 5%
a. Dependent Variable: Increase in consumption expenditure Table 2c: Coefficientsa
Results from table 2c above indicate that all three sub variables of savings with P values less than the significant level of 5% are statistically significant microsavings indicators in explaining increase in consumption expenditure as a poverty indicator. Table 2c above indicate that type of savings with a beta of -0.204 and interest rates with a beta of -0.113 have an inverse relationship with the outcome variable increase in consumption expenditure. The implication is that as type of savings increases by one unit, increase in consumption expenditure decreases by 20.4 percent. Similarly as Rate of Savings increases by one unit, increase in consumption expenditure increases by 5.9%. The regression function for the sub-hypothesis (H01b) is extracted as follows:
Y2 = 2.822 - 0.204X1 - 0.113X2 + 0.059X3
Where Y2 = Increase in consumption expenditure, X1 = Type of Savings, X2 = Interest Rate and X3 is rate of savings.
114
Vol 5 Issue 10 October, 2017
4.3. Microsavings and Acquisition of Business Assets H02cTable 3a to 3c presents the results of the above sub hypothesis. In table 3a below, the final output of the regression function is modelled by taking microsavings (Types of savings, Interest Rate and Rate of savings) as the predictor variable and acquisition of business assets as the outcome variable.
Model R R
Square
Adjusted R Square
Std. Error of the Estimate
Change Statistics
R Square Change
F Change
df1 df2 Sig. F Change
1 .775a 0.601 0.597 0.47163 0.601 148.468 3 296 0.000
Source: Study data, 2016 Significance Level = 0.05
a. Predictors: (Constant), Rate of savings, Interest rates, Type of savings b. Dependent Variable: Acquisition of business assets
Table 3a: Model Summaryb
Table 3a above indicate a strong positive correlation between microsavings and acquisition of household assets and or business assets (77.5 percent). This may imply that MSME’s are either able to save to acquire business assets or are able to use savings as a form of collateral to acquire assets. Table 3a also indicate that Microsavings accounts for 60.1 percent of acquisition of business assets (R2 = 0.601).
The above finding is consistent with that of Adjei and Arun (2009) whose study in Ghana suggested that Microsavings influenced the amount of wealth made by participants. It must however be called out that most microfinance institutions in Ghana adopted the Grameen model meaning that to qualify for a loan you need to have about 20 percent of the amount you require in the form of savings deposits before a loan will be approved.
Table 3b below presents results of the models overall significance in the form of an analysis of variance (ANOVA).
Model Sum of Squares Df Mean Square F Sig.
1 Regression 99.075 3 33.025 148.468 .000b
Residual 65.842 296 0.222
Total 164.917 299
Source: Study data, 2016
Significance level = 0.05
a. Dependent Variable: Acquisition of business assets
b. Predictors: (Constant), Rate of savings, Interest rates, Type of savings
Table 3b: ANOVAa
Table 3b above shows that the model overall is statistically significant with P< 5 (p=0.000). The F-ratio is 148.46 indicating that the model significantly improved our ability to predict the outcome variable. From the foregoing, the sub-hypothesis, H02c which states
that microsavings do not have a significant effect on acquisition of business asset is hereby rejected.
Table 3c below presents results of the regression coefficient for microsavings and acquisition of business assets to indicate whether microsavings has a significant effect in explaining acquisition of business assets.
Model Unstandardized Coefficients Standardized Coefficients T Sig. Collinearity Statistics
B Std. Error Beta Tolerance VIF
1 (Constant) 0.431 0.166 2.603 0.010
Type of savings 0.315 0.045 0.395 7.040 0.000 0.429 2.329
Interest rates 0.166 0.056 0.113 2.965 0.003 0.925 1.082
Rate of savings 0.293 0.037 0.455 7.968 0.000 0.414 2.418
Source: Study data, 2016
a. Significance level = 0.05
b. Dependent Variable: Acquisition of business assets
Table 3c: Coefficientsa
115
Vol 5 Issue 10 October, 2017
Y3 = 0.431 + 0.315X1 + 0.166X2 + 0.293X3Where Y3 = Acquisition of business asset, X1 = Type of Savings, X2 = Interest Rate and X3 is rate of savings.
Evidence from similar studies in Uganda and Zanzibar found that micro-credit clients invested more in business assets such as tools, plants and equipments (Barnes et al. 2001; Brannen 2010). The data from Tanzania suggests that investing in household assets is especially true of male clients, although it is also significant amongst female borrowers. Accordingly the findings of this study that microsavings has a significant effect on acquisition of business assets is hereby supported.
4.4. Microsavings and Ability to Educate childrenH01d
Table 4a to 4c presents the results of the above sub hypothesis. In table 4a below, the output of the regression function is modelled by taking microsavings (Types of Savings, Interest Rate and Rate of Savings) as the predictor variable and ability to educate children as the outcome variable.
Model R R
Square
Adjusted R Square
Std. Error of the Estimate
Change Statistics
R Square Change
F Change
df1 df2 Sig. F Change
1 .658a 0.433 0.427 0.56188 0.433 75.214 3 296 0.000
Source: Study data, 2016 Significance Level = 0.05
a. Predictors: (Constant), Rate of savings, Interest rates, Type of savings b. Dependent Variable: Ability to educate children
Table 4a: Model Summaryb
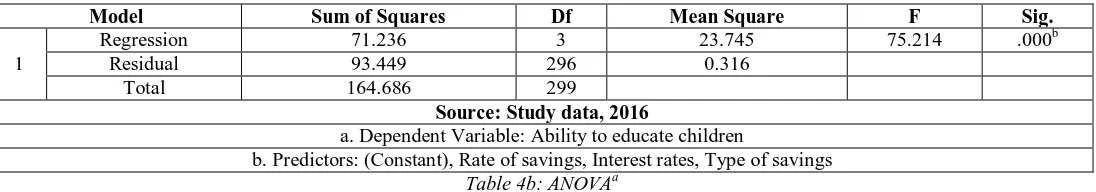
From table 4a above, a moderate positive correlation is observed between microsavings (rate of savings, interest rates and type of savings) and ability to educate children ( r =0.658). The results further indicate that Microsavings accounts for 43.3 percent of ability to educate children (R2 = 0.433). The adjusted R2 which gives us some idea of how well our model generalizes is R2 is 42.7 percent and therefore very similar to the outcome predicted by the R2, indicating that the cross-variability of this model is very good.
Table 4b below presents results of the models overall significance in the form of analysis of variance. According to Field (2013) ANOVA tests whether the model is significantly better at predicting the outcome than using the mean as a best guess.
Model Sum of Squares Df Mean Square F Sig.
1
Regression 71.236 3 23.745 75.214 .000b
Residual 93.449 296 0.316
Total 164.686 299
Source: Study data, 2016
a. Dependent Variable: Ability to educate children
b. Predictors: (Constant), Rate of savings, Interest rates, Type of savings
Table 4b: ANOVAa
The findings of table 4b above indicate that the model overall is statistically significant with a P-value less than 5 percent (p=0.000). According to Saunders, Lewis and Thornhill (2012) the F-ratio represents the ratio of the improvement in prediction that results from fitting the model, relative to the inaccuracy that still exists in the model. In this case F=75.214 meaning that the model significantly improved our ability to predict the outcome variable. From the foregoing, the sub-hypothesis, H02d which states that microsavings do
not have a significant effect on ability to educate children is therefore not supported and rejected.
Table 4c below presents results of the regression coefficient (beta values) for microsavings and ability to educate children.
Model Unstandardized Coefficients Standardized Coefficients T Sig. Collinearity Statistics
B Std. Error Beta Tolerance VIF
1 (Constant) 1.276 0.197 6.472 0.000
Type of savings 0.774 0.053 0.969 14.508 0.000 0.429 2.329
Interest rates -0.002 0.067 -0.001 -0.028 0.978 0.925 1.082
Rate of savings -0.362 0.044 -0.562 -8.257 0.000 0.414 2.418
Source: Study data, 2016
a. Dependent Variable: Ability to educate children b. Significance Level = 0.05
Table 4c: Coefficientsa
116
Vol 5 Issue 10 October, 2017
that rate of savings has an inverse relationship with ability to educate children. Accordingly, a unit increase in the rate of savings will result in a 0.362 decrease in ability to educate children.Interest rate is not significnant and is therefore excluded from the regression equation. The regression function for the sub-hypothesis (H01d) is therefore extracted as follows: Y4 = 1.4276 + 0.774X1 - 0.362X3
Where Y4 = Ability to educate children, X1 = Type of Savings and X3 is rate of savings.
The above finding is supported by empirical studies by Adjei et. al. (2009) and Ssewamala (2010) whose respective studies in Ghana and Uganda found significant positive relationship between microsavings and ability to educate children. Nanor (2008) and Shimamura (2009) however found mixed effect on ability to educate children. Nanor (2008) in particular found significant positive effect in some districts of the Eastern Region of Ghana and significant negative effects in other districts of the same region in Ghana.
5. Summary of Findings
The specific objective of the study was to establish the effect of microsavings on poverty reduction in Central Region of Ghana. To this end the researcher hypothesized that microsavings does not have statistically significant effect on poverty reduction in Central Region of Ghana (H01) and constructed four additional null hypotheses. The four hypothesis measured microsavings against growth
in income (H01a), increase in consumption expenditure (H01b) acquisition of business assets (H01b) and ability to educate children
(H01d), as proxies for poverty reduction.
Using multiple regression analysis, the study established strong positive relationship between microsavings and poverty reduction, microsavings and growth in income, Microsavings and acquisition of business asset. The study however found a weak positive relationship between microsavings and increase in consumption expenditure and a moderate positive relationship between microsavings and ability to educate children. This is in line with the theory of life cycle savings which view financial assets as vehicles for transferring resources across different times and outcomes over the life cycle, and that perspective allows households and planners to think about their decisions in a logical and rigorous way.
6. Conclusions and Recommendations
In view of the above findings in relation to the specific objective and research hypothesis, the study concluded that microsavings is perhaps the most important microfinance interveniton which influences poverty reduction as compared to other forms of interventions. The study therefore recommended that microfinance institutions should intensify their savings mobilisation initiatives by increasing the rate of interest on savings deposits so as to encourage the informal sector which continues to remain unbanked to save.
7. Implications of The Study and Areas for Further Research
There are several noteworthy implications associated with the outcome of this study. Firstly, the study rejected the main hypotheses and its sub hypothesis. The implication of this is that microsavings are important and efficient poverty reduction tools which could contribute significantly to growth in income and entrepreneurial development, increase in consumption expenditure, acquisition of assets and ability to educate children and should therefore be given all the attention it deserves.
The research gaps observed out of the study effort provide some basis for further empirical investigations. There is need to consider similar study over a longer period of time using randomised control trials as against the cross sectional design used for this study to capture the time effects of changes in the implementation of the interventions. Also, thee is the need to expand the study variables to cover, microcredit, micro leasing, money transfer and access to credit which are various forms of microfinance interventions to understand how these variables affect poverty reduction.
8. References
i. Adjei, J. K., Arun, T. & Hossain, F. (2009). The Role of Microfinance in Asset-Building and Poverty Reduction: The Case of
Sinapi Aba Trust of Ghana. BWPI Working Paper 87. Brooks World Poverty Institute ISBN : 978-1-906518-86-8
ii. Ahmed-Karim, Z. & Alders-Sheya, J. (2014). The promise of microfinance and womens empowerment. What does the
evidence say? An Ernst and Young Chartered Accountants Publication
iii. Ampiah, J. G. & Adu-Yeboah, C. (2009). Mapping the incidence of school dropouts: a case study of communities in Northern
Ghana. Comparative Education Vol. 45 , Iss. 2,2009
iv. Arun, T., Imai, K. & Sinha, F. (2006). Does microfinance reduce poverty in India? Propensity score matching based on a
national-level household data. Development Economics and Public Policy Working Paper Series No. 17, IDPM, University of Manchester.
v. Arhin-Sam, K. (2013). Clients and Microfinance services. Akez working papers in development studies No. 0002
vi. Augsburg, B., De Haas, R., Harmgart, H., Meghir, C. (2015). The Impacts of Microcredit: Evidence from Bosnia and Herzegovina.
American Economic Journal. Applied Economics 7.1 (Jan 2015): 183-203
vii. Awaworyi, S. K. (2014). Impact of Microfinance Interventions: A Meta-analysis. Monash University. Discussion Paper 03/14
viii. Bank of Ghana, (2015). Annual Report and Accounts 2014. Retrieved on 15/01/2016 from
http://www.bog.gov.gh/privatecontent/public/File/Bank per cent20of per cent20Ghana percent20Annual per cent
ix. Barnes, C., Gaile G, Kibombo, R. (2001a) The impact of three microfinance programs in Uganda.Washington,DC:
Development Experience Clearinghouse, USAID
x. Bateman, M. (2010) Why doesn’t microfinance work? The destructive rise of local neoliberalism. London: Zed Books
xi. Brannen, C. (2010). An impact study of the Village Savings and Loan Association (VSLA) program in Zanzibar, Tanzania. BA
117
Vol 5 Issue 10 October, 2017
xii. Cheston, S., Conde, T., Bykere, A. & Rhyne, E. (2016). The business of financial inclusion: insights from banks in emerging
markets. Institute of International Finance
xiii. Copestake, J. (2007). Mainstreaming microfinance: Social performance management or mission drift? World Development, 35(10):
1721-1738.
xiv. De Mel, S., McKenzie, D. &Woodruff, C. (2012). Business Training and Female Enterprise Start-up, Growth, and Dynamics:
Experimental evidence from Sri Lanka
xv. Deininger, K. & Liu, Y. (2013). Economic and social impacts of an innovative self-help group model in India. World Development
43: 149–163. 14.
xvi. Dupas, P. & Robinson J. (2013) Savings Constraints and Microenterprise Development: Evidence from a Field Experiment
in Kenya, American Economic Journal: Applied Economics, 5, 163–92.
xvii. Duvendak, M., Palmer-Jones. R., Copestake, J. G., Hooper, L., Loke, Y. & Rao, N.(2011). What is the evidence of the impact of
microfinance on the well-being of poor people? London: EPPI-Centre, Social Science Research Unit, Institute of Education,
University of London. ISBN: 978-1-907345-19-7
xviii. Dzisi, S., & Obeng, F. (2013) Microfinance and the Socio-economic Wellbeing of Women Entrepreneurs in Ghana. International
Journal of Business and Social Research (IJBSR), Volume-3, No.-11, November, 2013
xix. Ghana Statistical Service (2014). Ghana living standards survey round 6. Poverty profile in Ghana 2005 – 2013
xx. Israel, G. D. (2009). Determining Sample Size. PD006. Gainesville: University of Florida Institute of Food and Agriculture
Sciences. http://edis.ifas.ufl.edu/pd006
xxi. Kast, F., Meier, S., & Pomeranz, D. (2012). Under-Savers Anonymous: Evidence on Self-Help Groups and Peer Pressure as a
Savings Commitment Device. NBER Working Paper, (18417), Sept. 2012.
xxii. Khandker, S.R. (2003). Micro-Finance and Poverty: Evidence Using Panel Data from Bangladesh. Policy Research Working Paper
No. 2945, Washington D.C: World Bank.
xxiii. Kirsten, M. A. (2011). Improving the well-being of the poor through microfinance: Evidence from the Small Enterprise Foundation
in South Africa. Dissertation presented for the degree of Doctor of Philosophy in the Faculty of Economic and Management Science at the University of Stellenbosch
xxiv. Morduch, J. (2013). How microfinance really works. Milken Institute Review Second Quarter, 51–59
xxv. Nanor, M.A. (2008) Microfinance and its impact on selected districts ineastern region of Ghana. College of Art and Social
Sciences, Kumasi:Kwame Nkrumah University of Science and Technology.
xxvi. Pitt, M. M. & Khandker, S. R. (1998). The Impact of Group-Based Credit on Poor Households in Bangladesh: Does the Gender of
Participants Matter? Journal of Political Economy 106(5), 958–96. 334
xxvii. Prina, S. (2015). “Banking the Poor via Savings Accounts: Evidence from a Field Experiment” Journal of Development Economics
115: 16–31. PWC (2016) Shifting trends in the microfinance ecosystem November 2016.
xxviii. PWC (2016). Shifting trends in the microfinance ecosystem November 2016.KS/November2016-8029
xxix. Robinson, M. (2003). The Microfinance Revolution: Sustainable Finance for the Poor. Vol. 1. Washington D.C: World Bank.
xxx. Robinson, Jonathan (2012) Limited Insurance within the Household: Evidence from a Field Experiment in Kenya, American
Economic Journal: Applied Economics, 4, 140–64
xxxi. Roodman, D. & Morduch, J. (2013). The Impact of Microcredit on the Poor in Bangladesh: Revisiting the Evidence. Center
for Global Development Working Paper No. 174.
xxxii. Roodman D (2010) You can’t have it all. David Roodman’s microfinance open book blog, 24 April 2010
xxxiii. Rosenburg, R. (2010) Does Microcredit Really Help Poor People?
https://www.cgap.org/sites/default/files/CGAP-Focus-Note-Does-Microcredit-
xxxiv. Saunders, M. N. K., Lewis P., & Thornhill, A. (2009). Research methods for business students. (5th Edition) Harlow, England:
Pearson Education.
xxxv. Saunders, M. N. K., Lewis P., & Thornhill, A. (2012). Research methods for business students. (6th Edition) Harlow, England:
Pearson Education
xxxvi. Stewart R, van Rooyen C, Korth M, Chereni A, Da Silvade N. R., De Wet, T (2012). Do micro-credit, microsavings and
micro-leasing serve as effective financial inclusion interventions enabling poor people, and especially women, to engage in meaningful economic opportunities in low- and middle-income countries. Asystematic review of the evidence. EPPI-Centre, Social Science Research Unit, Institute of Education, University of London.
xxxvii. UNDP (2010). The real wealth of nations: pathways to human development
http://hdr.undp.org/en/reports/global/hdr2010/chapters/
xxxviii. UNESCAP-ADB-UNDP (2012) Accelerating Achievement Of The Millennium Development Goals In South Asia Jointly
Organized By United Nations Economic And Social Commission For Asia And. The Pacific Asian Development Bank United Nations Development Programme 17-18 February 2012 New Delhi, India
xxxix. van Rooyen C., Stewart R., and de Wet T. (2012). The impact of microfinance in sub-Saharan Africa: A systematic review of the
evidence. World Development. Vol 40(11): 2249–2262
xl. World Bank (2015). A Measured approach to ending poverty and boosting shared prosperity concepts, data, and the twin goals.
Policy research report 2015. International Bank for Reconstruction and Development / The World Bank 1818. H Street NW, Washington DC 20433
xli. Yeboah, E. R. (2010). Microfinance in Rural Ghana. A thesis submitted to the University of Birmingham for the degree of