ABSTRACT
OLLS, COURTNEY WILLIAMS. Leader Personality Traits and Subordinate Perceptions of Destructive Leadership: A Pattern-Oriented Approach. (Under the direction of Dr. S.
Bartholomew Craig.)
Destructive leadership can have disastrous consequences for employees, organizations, and the public. Despite growing interest in this area, consensus has yet to be reached regarding which, if any, individual differences are associated with destructive leadership. This study expands upon the existing research by using cluster analysis and latent profile analysis to address this question. The primary objectives of this study were to: 1) identify a set of distinct personality profiles within a sample of organizational leaders, and 2) determine whether differences exist among these personality profiles on subordinate ratings of destructive leadership. Results based on a sample of 242 subordinates rating 135 leaders yielded nine distinct personality profiles comprising four empirically derived personality dimensions (Egocentrism/Narcissism, Power/Influence, Conscientiousness, and
Leader Personality Traits and Subordinate Perceptions of Destructive Leadership: A Pattern-Oriented Approach
by
Courtney Williams Olls
A dissertation submitted to the Graduate Faculty of North Carolina State University
in partial fulfillment of the requirements for the Degree of
Doctor of Philosophy
Psychology
Raleigh, North Carolina 2016
APPROVED BY:
_______________________________ ______________________________
Dr. S. Bartholomew Craig Dr. Adam W. Meade
Chair of Advisory Committee
_______________________________ ______________________________
BIOGRAPHY
Courtney Williams Olls was born in 1983 in Washington, DC. After graduating from the Holton-Arms School in Bethesda, Maryland, she received her Bachelor of Arts degree in Psychology from the University of Virginia in 2006. Courtney spent the next four years working in clinical trials research—first at Massachusetts General Hospital and then at the University of North Carolina at Chapel Hill. She began her graduate education in the
Industrial/Organizational Psychology Doctoral Program at North Carolina State University in the fall of 2010 and received her Master of Science degree in 2014. During this time she had several particularly valuable opportunities, including an internship at GlaxoSmithKline and an assistantship with the North Carolina State Highway Patrol. She is currently employed as an Organization Development Advisor at Quintiles in Research Triangle Park, North
ACKNOWLEDGMENTS
First, I would like to thank my committee members: Bart Craig, Mark Wilson, Adam Meade, and Shevaun Neupert for their feedback and guidance throughout this process. Special thanks to Bart Craig for his extraordinary patience and infinite wisdom. Additional thanks to Mark Wilson for his sense of humor and for giving me the opportunity to work with him and Bart on the State Highway Patrol projects. The experience I gained while working with you both has been invaluable.
Thank you to MK Ward, who has been my friend since day one of graduate school. I know I wouldn’t have survived prelims—much less graduate school—without you. I would also like to extend my gratitude to Ruchi Patel and Alexandra Mullins, who have been wonderful friends, mentors, and graduate school “sisters” over the years.
Loving thanks to my family (Mom, John, Charles, Alex, Brooks, Charlie, Bennett, Walker, as well as extended family members) and all of my friends—both near and far—who have loved and supported me over all these years. And thank you all for knowing when to ask about school and when to ask about something else instead.
TABLE OF CONTENTS
LIST OF TABLES ...v
LIST OF FIGURES ... vi
Leader Personality Traits and Subordinate Perceptions of Destructive Leadership: A Pattern-Oriented Approach ...1
Perspectives on Leadership ...2
The Bright Side of Leadership ...4
The Dark Side of Leadership ...5
Personality and Destructive Leadership ...12
The Current Study ...29
Method…….... ...30
Participants ...30
Procedure ...32
Measures ...33
Results………. ...39
Personality Items Factor Analysis ...39
Cluster Analyses ...44
Latent Profile Analyses ...73
Personality and Organizational Level ...84
Cluster Profile Differences in Destructive Leadership Ratings ...84
Discussion…… ...87
Cluster Analysis: Empirically Derived Dimensions ...88
Cluster Analysis: A Priori Dimensions...91
Latent Profile Analyses ...93
Comparison of Person-Oriented Approaches ...95
Cluster Differences in Ratings of Destructive Leadership ...99
Strengths and Limitations ...100
Conclusions and Future Directions ...104
References…… ...107
APPENDICES ...127
Appendix A. Narcissistic Personality Inventory (NPI) ...128
Appendix B. Machiavellianism IV Scale (Mach-IV) ...130
Appendix C. Mini-IPIP Scales ...131
Appendix D. Perceived Leader Integrity Scale (PLIS) ...132
Appendix E. Destructive Leadership Questionnaire (DLQ:IH) ...133
Appendix F. Items for Empirically Derived Personality Dimensions ...134
LIST OF TABLES
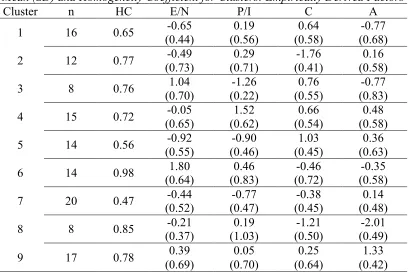
Table 1. Summary of Intercorrelations, Means, and Standard Deviations ...43 Table 2. Mean (SD) and Homogeneity Coefficient for Clusters:
Empirically Derived Factors ...48 Table 3. Mean (SD) and Homogeneity Coefficient for Clusters:
LIST OF FIGURES
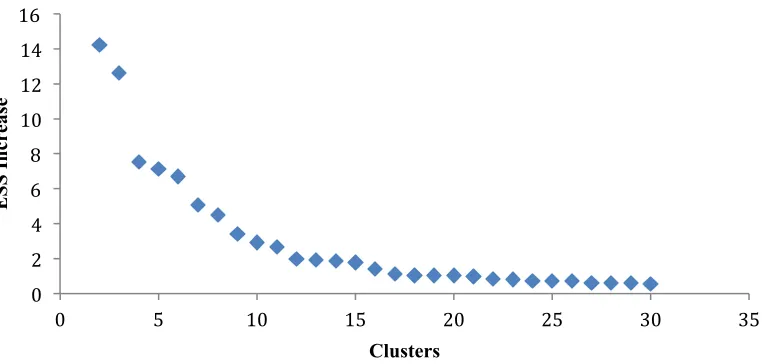
Figure 1. Error sum of squares (ESS). Initial cluster analysis for
empirically derived dimensions suggests a nine-cluster solution. ...46 Figure 2. Standardized scores for empirically derived personality factors,
by cluster. ...49 Figure 3.1. Standardized scores for empirically derived personality factors
for cluster profile 1. ...50 Figure 3.2. Standardized scores for empirically derived personality factors
for cluster profile 2. ...51 Figure 3.3. Standardized scores for empirically derived personality factors
for cluster profile 3. ...52 Figure 3.4. Standardized scores for empirically derived personality factors
for cluster profile 4. ...53 Figure 3.5. Standardized scores for empirically derived personality factors
for cluster profile 5. ...54 Figure 3.6. Standardized scores for empirically derived personality factors
for cluster profile 6. ...55 Figure 3.7. Standardized scores for empirically derived personality factors
for cluster profile 7. ...56 Figure 3.8. Standardized scores for empirically derived personality factors
for cluster profile 8. ...57 Figure 3.9. Standardized scores for empirically derived personality factors
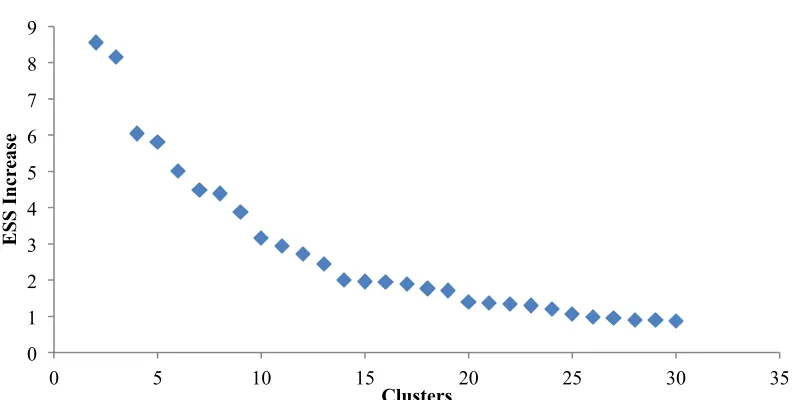
for cluster profile 9. ...58 Figure 4. Error sum of squares (ESS). Initial cluster analysis for a priori
dimensions suggests a 10-cluster solution. ...60 Figure 5. Standardized scores for a priori personality factors, by cluster. ...62 Figure 6.1. Standardized scores for a priori personality factors for cluster
Figure 6.2. Standardized scores for a priori personality factors for cluster
profile 2. ...64 Figure 6.3. Standardized scores for a priori personality factors for cluster
profile 3. ...65 Figure 6.4. Standardized scores for a priori personality factors for cluster
profile 4. ...66 Figure 6.5. Standardized scores for a priori personality factors for cluster
profile 5. ...67 Figure 6.6. Standardized scores for a priori personality factors for cluster
profile 6. ...68 Figure 6.7. Standardized scores for a priori personality factors for cluster
profile 7. ...69 Figure 6.8. Standardized scores for a priori personality factors for cluster
profile 8. ...70 Figure 6.9. Standardized scores for a priori personality factors for cluster
profile 9. ...71 Figure 6.10. Standardized scores for a priori personality factors for cluster
profile 10. ...72 Figure 7. Standardized scores for empirically derived personality factors,
by latent profile. ...76 Figure 8.1. Standardized scores for empirically derived personality factors
for latent profile 1. ...77 Figure 8.2. Standardized scores for empirically derived personality factors
for latent profile 2. ...78 Figure 8.3. Standardized scores for empirically derived personality factors
for latent profile 3. ...79 Figure 9. Standardized scores for a priori personality factors, by latent
Figure 10.1. Standardized scores for a priori personality factors for latent
profile 1. ...82 Figure 10.2. Standardized scores for a priori personality factors for latent
profile 2. ...83 Figure 11. Standardized average PLIS scores for nine clusters (based on
ED factors). ...85 Figure 12. Standardized average PLIS scores for 10 clusters (based on
Leader Personality Traits and Subordinate Perceptions of Destructive Leadership: A Pattern-Oriented Approach
The study of leadership has long captured the interest of researchers, practitioners, and the public alike. There has been no shortage of theoretical and empirical research examining the characteristics of exemplary leaders: their upbringings and early influences, their emergence as leaders, their traits and behaviors, their relationships with followers, and the contexts in which they excel. As researchers have worked to describe what it means to be a good leader, practitioners have sought to prescribe the ingredients necessary for good leadership. Thousands of books have been published on the topic, designed to help anyone— from the mindful to the Machiavellian—with anything, from discovering the leader within to developing followers into leaders, from learning the traits of successful executives to
mastering the principles of effective management. At the center of it all is one key question: are good leaders born or made?
While research has yet to converge on the defining features of a good leader, the literature is quite consistent in terms of describing bad leaders. Bad leaders demonstrate poor judgment, an inability to build teams, difficulty building and maintaining relationships, and are generally incapable of learning from their mistakes (J. Hogan, Hogan, & Kaiser, 2011).
this study: 1) to identify and describe a set of distinct personality trait profiles among a sample of organizational leaders, and 2) determine whether any of these personality profiles can predict subordinate perceptions of destructive leadership.
To address these objectives, I will begin by providing an overview of the dominant perspectives of leadership, then describing two approaches to the study of leadership: the bright side and the dark side, the latter of which encompasses destructive leadership. I will then provide an overview of the extant literature regarding individual differences associated with, or predictive of, destructive leadership. As part of this overview, I will highlight the limitations of the variable-oriented approach that has been used in the vast majority of leadership research and discuss the advantages of using a pattern- or person-oriented approach to study personality predictors of destructive leadership. I will then proceed to address one of the primary study objectives using two pattern-oriented methodologies (hierarchical cluster analysis and latent profile analysis) to determine the set of personality trait profiles that exist in a sample of leaders. Next, I will examine whether these profiles are differentially represented across three organizational levels. I will then assess whether differences exist among the profiles in terms of subordinate perceptions of destructive leadership. Finally, in reviewing the findings of these analyses I will discuss how the results of the two pattern-oriented methodologies differed and the implications for future research. Perspectives on Leadership
conceptualized as systematic structures that exist to organize and direct collective effort (Craig & Kaiser, 2012; Kaiser, Hogan, & Craig, 2008).
Kaiser and Hogan (2010) described two dominant perspectives on leadership. One view of leadership is that of a formally defined position: if someone is in charge of
something, that person is therefore a leader. Alternatively, leadership may be considered from a human evolutionary standpoint: leadership is a mechanism that evolved over time to influence individuals to forego their individual interests in favor of coordinating collective effort for the long-term welfare of the group. That is to say, leadership is a resource for group survival (Kaiser & Hogan, 2010). Based on this evolutionary standpoint, it follows that modern organizations continue to have leaders because such organizations have, over time, proved to be more successful than those without them. Put differently, the leader role is an adaptive feature of organizations that has evolved over time. The role of leader is subsumed under leadership, which is a process—not simply a position—occurring within an organization.
Using this evolutionary perspective, leadership may be assessed by measuring group (i.e., organizational) outcomes that are critical for the success of the organization. In other words, the effectiveness of the leader can be defined as the extent to which the leader helps the organization achieve its collective goals. Thus, one way to operationalize leader
effectiveness is by measuring the performance of the leader’s group or team (Craig & Kaiser, 2012).
decision-making (Craig, 2008; Kaiser et al., 2008; Kaiser & Overfield, 2010). Craig and Kaiser (2012) described leader decision-making as largely intrapersonal, because it is ultimately a process that occurs within a single individual. Conversely, the interpersonal influence channel includes leader behavior that directly affects the behavior of others.
The Bright Side of Leadership
In many cases, as researchers have examined the types of leader behaviors that
influence group performance, they have tended to do so through rose-colored glasses. Kaiser and Craig (2014) argued that the academic study of leadership has demonstrated a positivity bias; in most cases, the concept of leadership has a positive connotation. Indeed, Burns (2003) contended that, “if it is unethical or immoral, it is not leadership” (p. 48). Consistent with this positivity bias, Cohen (2010) argued that business ethics and personal integrity were necessary (though perhaps not sufficient) for effective leadership. One interesting
implication of this view is that it renders the set of individuals who are both “leaders” and “bad” empty because, as soon as an individual behaves immorally, he or she is presumably stripped of the “leader” moniker. Consistent with this, some argue that Hitler cannot be considered a leader despite his ability to coordinate the collective efforts of a huge number of people in conducting horrific, devastating acts of violence and brutality.
path-goal theory, leader-member exchange theory, charismatic leadership theory, and transformational leadership theory—fall into this category. In emphasizing certain factors associated with effective leadership via their presence, these theories exemplify the bright side approach to leadership. The underlying assumption with the bright side approach is that ineffective leadership is the result of the absence of such factors (Ashforth, 1994). Yet, despite its prevalence in extant literature, there is evidence to suggest that such an approach does not represent the full range of factors related to effective leadership.
The Dark Side of Leadership
Hogan and Kaiser (2005) contended that it is necessary to distinguish between good and bad leadership, since “good leadership promotes effective team and group
performance… [whereas] bad leadership degrades the quality of life for everybody
associated with it” (p. 169). Researchers have become increasingly interested in examining the “dark side” of leadership, which focuses on the actively counterproductive factors that enhance leadership via their absence (Craig & Kaiser, 2012). This represents an important shift in the field. According to Craig and Kaiser, “there is a growing consensus in the field that dark side factors that undermine effective leadership are at least as important as
outcomes associated with unethical leadership, there may be greater research utility in focusing on the dark side of leadership than on the bright side.
Unfortunately, bad leadership is not a new phenomenon. Based on organizational climate research conducted from the mid-1950s to 1990, between 60 and 75% of employees indicated that their immediate supervisor was the worst part of their job (R. Hogan, Raskin, & Fazzini, 1990). In a more recent study, researchers found that approximately 14% of respondents reported having experienced aggression from their supervisor during the preceding 12 months (Schat, Frone, & Kelloway, 2006). When the definition of destructive leadership is expanded to include passive forms of destructive leadership, the rates are even higher. Depending on the estimation method used, researchers reported that between 34 and 61% of respondents indicated that their immediate supervisor had demonstrated some form of consistent and frequent destructive leadership behavior during the preceding six months; only 39% of respondents reported no exposure to such behavior over the same period of time (Aasland, Skogstad, Notelaers, Nielsen, & Einarsen, 2010). While this study did consider laissez-faire leadership (i.e., the absence of leadership) and other forms of destructive leadership that may include constructive elements, their findings portray a stark reality. In their latent class cluster analysis, more than 20% of respondents indicated that their
Unsurprisingly, such destructive behavior comes at a cost. Tepper and colleagues reported that abusive supervision costs organizations $23.8 billion annually, due to employee absenteeism, health care costs, and lost productivity (Tepper, 2007; Tepper, Duffy, Henle, & Lambert, 2006). At the individual level, a number of negative employee outcomes have been associated with destructive leadership as well, including employee counterproductivity (Detert, Treviño, Burris, & Andiappan, 2007), job tension and emotional exhaustion (Harvey, Stoner, Hochwarter, & Kacmar, 2007), resistance behavior (e.g., Bamberger & Bacharach, 2006), deviant work behavior (e.g., Duffy, Ganster, & Pagon, 2002), reduced family well-being (e.g., Hoobler & Brass, 2006), and intention to quit and job (dis)satisfaction (e.g., Tepper, 2000).
The findings from a recent meta-analysis offered further evidence of the harmful, widespread effects associated with destructive leadership. Schyns and Shilling (2013) found support for the hypothesized negative correlations among destructive leadership and positive subordinate outcomes (e.g., attitudes towards leader, well-being, and individual
Taken all together, it is reasonable to conclude that many if not all subordinates are likely to encounter some form of destructive leadership at some point during the course of their work lives. Furthermore, the potential consequences of destructive leadership are severe enough—at the individual, organizational, and societal levels—to warrant further investigation.
Defining destructive leadership. One of the challenges associated with destructive leadership (DL) research is that there is a lack of consensus regarding how it should be defined. As is the case in many areas of psychology, different researchers have referred to the same phenomena using different names. Other terms used in this area of research include: unethical leadership (the omission of positive behaviors considered to be morally required; Craig & Gustafson, 1998), leader derailment (characterized by previously
successful individuals who experience some type of involuntary, halted career progression; Hogan & Hogan, 2001; McCall & Lombardo, 1990), toxic leadership (characterized by individuals who, via destructive behavior and dysfunctional attributes, inflict serious, lasting harm on people and/or entities they lead; Goldman, 2006; Lipman-Blumen, 2006; Padilla & Mulvey, 2008), petty tyranny (lording power over others; Ashforth, 1994), abusive
supervision (a supervisor's "sustained display of hostile verbal and nonverbal behaviors, excluding physical contact," as perceived by his or her subordinates; Tepper, 2000),
Pittinsky, 2006) and, somewhat more controversially, negligent or laissez-faire leadership (the absence of leadership and/or avoidance of intervention; Aasland et al., 2010).
Furthermore, the term destructive leadership itself has been defined in several different ways. One point of contention among researchers involves the issue of
intentionality. Some do not consider intentionality to be a definitional feature of DL (e.g., Einarsen et al., 2007; Tepper, 2007), while others have not addressed the issue of
intentionality at all (e.g., Ashforth, 1994; Ma, Karri, & Chittipeddi, 2004), and still others consider it a necessary part of the definition (e.g., Craig & Kaiser, 2012). The second point of disagreement is related to the issue of who may be considered potential victims of DL. Some researchers consider only the organization and/or its members (i.e., the in-group) as potential victims of DL, while others also include external stakeholders and/or members of the community. For the purposes of this study, destructive leadership is defined as the
stakeholders” (e.g., local community members) as potential victims of destructive
leadership—an important extension based on the unique responsibilities afforded to those in leadership roles (Kaiser & Craig, 2014).
As an aside, it is worth noting that although I refer to destructive leaders, that is not to say that this is an all-or-nothing phenomenon. There is evidence that destructive leadership can and does exist alongside forms of constructive leadership by the same individual (e.g., Aasland et al., 2010; Rayner & Cooper, 2003).
Measuring destructive leadership. Considering both the nature of destructive leadership as well as the varied opinions on how to define it, it is not surprising that measuring it has presented some challenges to researchers.
leadership, this may not be problematic. But if, as in the present study, destructive leadership necessarily involves intent on the part of the leader, the decision about what measures— indeed, what items—are used to assess DL is an important one.
One values-centric construct that is conceptually related to destructive leadership is leader integrity. A common method by which integrity has been measured uses competency ratings provided by subordinates. Kaiser and Hogan (2010) examined how subordinate ratings have been used to assess managers’ integrity and argued that this may be problematic. Based on their research, they offered two recommendations. First, due to the very nature of integrity (or lack thereof), managers who are low in integrity are unlikely to rate themselves as such. Therefore, observer ratings should be more likely to pinpoint individuals with low integrity. Further, while managers may not often get caught in a destructive act, those who are likely to engage in such activities tend to exhibit cues consistent with unethical behavior, which are in turn used by subordinates as they form impressions of their manager. As a result, subordinates are likely to be the most useful source of information regarding their manager’s integrity, whether or not they have observed an overt violation (Kaiser & Hogan, 2010).
(Einarsen et al., 2007). In any event, it would seem that subordinate ratings—rather than supervisor ratings—may be more likely to accurately capture destructive leadership.
In an effort to address the issues associated with using integrity competencies, Craig and Gustafson (1998) developed the Perceived Leader Integrity Scale (PLIS). This measure distinguishes itself from competency ratings by focusing on the negative end of the integrity continuum. Furthermore, subordinates are asked to estimate the likelihood that their leader would engage in such behaviors rather than rating overt unethical behaviors. In essence, the PLIS is uniquely capable of capturing leaders’ reputations for integrity, i.e., how others think of them (R. Hogan, 2007). Reputation refers to the collective impressions that individuals make on others and reflects one of two ways in which MacKinnon (1944) believed
personality should be defined. The other way is by factors internal to individuals that explain their behavior. Hogan (2007) refers to this as their identity. Having outlined the merits of assessing leader integrity using measures reflective of their reputation, I will now examine the role that leader identity plays in destructive leadership.
Personality and Destructive Leadership
As discussed, destructive leadership has broad-reaching, negative effects on employees, organizations, and society. Therefore it stands to reason that an empirical examination of the antecedents of destructive leadership could provide a useful foundation for researchers and practitioners aiming to develop interventions to prevent and/or counteract destructive leadership.
and environmental factors. They refer to these factors as the toxic triangle: characteristics of leaders, followers, and the environment that are associated with destructive leadership (Padilla et al., 2007). While the current study focuses on leader characteristics, it is worth noting that these factors should be considered within a greater context—both within individuals and with the environment.
That said, the relative weight carried by leader personality should not be discounted. Hogan and Kaiser contend that, “personality predicts leadership—who we are is how we lead” (2005, p. 169). Their conclusion is consistent with the findings of a meta-analysis conducted by Judge et al. (2002), in which the authors examined the relationship between personality and leadership in 78 studies. They found that all five dimensions of the five-factor model of personality (extraversion, agreeableness, conscientiousness, neuroticism, and openness) were correlated with overall leadership, which included both emergence and effectiveness. Specifically, extraversion, conscientiousness, openness to experience, and agreeableness were all positively related to overall leadership; neuroticism was negatively related to it. In a more recent meta-analysis examining the relationship between individual differences and leader effectiveness, Hoffman and colleagues (Hoffman, Woehr, Maldagen-Youngjohn, & Lyons, 2011) reported similar findings: achievement motivation (an indicator of conscientiousness; Judge et al., 2002), energy (extraversion; Judge et al., 2002),
dominance (extraversion; Hogan, Curphy, & Hogan, 1994), self-confidence (low
between leadership effectiveness and interpersonal skills, which itself is likely related to agreeableness.
Thus far, evidence to support the link between personality and leadership has primarily focused on the bright side of leadership. Kaiser and Hogan (2007) offered an exception to this trend and provided several additional conclusions about leader personality that may be more relevant to destructive leadership. They argued that personality “flaws” shape leader judgment, which may result in poor decision-making, coworker alienation, and team destabilization. Similarly, in their discussion of leader derailment, McCall and
Lombardo (1990) contended that leader derailment is caused by both personal flaws and performance shortcomings, noting that personal flaws (e.g., insensitivity to others) were the most frequent cause of derailment. Hogan and Hogan (1997) suggested that personality disorders (DSM-IV; American Psychiatric Association, 1994) offer a useful taxonomy of the most significant determinants of managerial failure and that leaders’ dark side tendencies may be considered extensions of the Big Five. To further complicate the issue, it may be that personality traits are differentially represented across organizational levels. That is to say, certain personality types may be more—or less—likely to exist at higher levels of the
organization. In their study of leader characteristics among U.S. Army officers, Mumford et al. (2000) found that while there were seven personality profiles among junior-level officers, the prevalence of these profiles was markedly different among senior-level officers.
Specifically, whereas 17% of junior-level officers were classified as “motivated
senior-level officers. This is an important finding particularly in light of the argument that the effects of leader personality are magnified as leaders are promoted to higher levels, due to having more discretion in their decisions and greater consequences for their actions (Kaiser & Hogan, 2007).
As evidenced by the preceding section, discussions of the link between personality traits and destructive leadership have been largely theoretical, with relatively few empirical studies examining this link. Of the empirical studies that have been done, researchers have generally used one of two approaches: a variable approach or a pattern (person-oriented) approach.
Variable approach.
leader populations are somewhat dubious, because many of those studies used samples comprising students or, at best, lower-level employees.
Commandeur, 2013). Researchers have also found narcissism to be negatively related to leader integrity (Blair, Hoffman, & Helland, 2008; Mumford, Connelly, Helton, Strange, & Osburn, 2001) and ethical decision making (Antes et al., 2007).
A recent meta-analysis was conducted to examine the relationship between narcissism and leadership. The authors did not find a linear relationship between narcissism and leader effectiveness, but they did report an underlying curvilinear trend, indicating that a moderate degree of narcissism may be optimal, with extreme levels of narcissism likely associated with lower effectiveness ratings (Grijalva et al., 2015). Although this meta-analysis examined the relationship between narcissism and leader effectiveness, it has important implications. Grijalva and colleagues (2015) argued that, while narcissists are adept at initiating relationships, they are often unable to maintain these relationships over time. As interpersonal influence is one of the two primary channels through which leaders affect organizational performance, the effects of leader narcissism may be significant.
and unethical behaviors (e.g., stealing, bending or breaking rules, cheating on taxes, or abusing power; Watts et al., 2013).
Although researchers increasingly argue for both negative and positive aspects of narcissism, consensus has yet to be reached regarding its underlying dimensionality, particularly as measured by the Narcissistic Personality Inventory (NPI; Raskin & Terry, 1988). A number of researchers have attempted to validate the factor structure of this measure, and have argued for the presence of two (Corry, Merritt, Mrug, & Pamp, 2008; Kubarych, Deary, & Austin, 2004), three (Ackerman et al., 2011; Kubarych et al., 2004), four (Emmons, 1984, 1987), or even seven factors, as suggested by Raskin and Terry
(1988). Some researchers argue that, while the NPI may measure several lower order factors, it does indeed measure a single higher-order, general narcissism factor (e.g., Emmons, 1987; Kubarych et al., 2004; Watson & Biderman, 1993). Consistent with this, other management researchers have treated narcissism as unidimensional in their research (Brunell et al., 2008; Hoffman et al., 2013; Judge et al., 2006). Thus, although it is often theoretically
conceptualized as multidimensional, narcissism is frequently treated as a unidimensional trait in organizational research. Therefore, narcissism is treated as unidimensional in the current study.
In some instances, this distinction may not necessarily be problematic—or even evident—if different aspects of narcissism all relate similarly to the criterion of
entitlement, tend to be more maladaptive (e.g., Paunonen, Lönnqvist, Verkasalo, Leikas, & Nissinen, 2006). Moreover, the extent to which certain narcissistic characteristics are perceived as adaptive may depend on the focal individual’s position. That is, some narcissistic characteristics, such as risk-taking and grandiosity, that are considered
maladaptive in the general population may be more likely to be perceived as neutral or even commendable in leaders (Watts et al., 2013).
While there is clearly evidence for the link between narcissism and destructive leadership (or similar constructs), much of the work in this area has been theoretical. Of the empirical research that has been done, very little of it has been both prospective and
conducted with leader participants. One exception to this is a study conducted by Blair and colleagues (2008). Based on multisource ratings provided for 154 managers, the researchers found that narcissism was negatively related to supervisory ratings of integrity. Interestingly, narcissism was found to be unrelated to subordinate ratings of integrity. However, it is worth noting that integrity was measured using five items on an evaluation scale, which were designed to examine the degree to which the leader engaged in certain behaviors (e.g., “Does not misrepresent him/herself for personal gain”), according to the rater. As previously discussed, this type of measure may not provide a comprehensive, accurate picture of destructive leadership, primarily because overt and observable counterproductive behavior has a very low base rate, and because most violations are only discovered after the fact (Kaiser & Hogan, 2010).
leadership using the 10-item Ethical Leadership Scale (Brown, Treviño, & Harrison, 2005). There was no main effect of narcissism on subordinate ratings of ethical leadership.
However, they did find an interaction effect between narcissism and ethical organizational context, such that narcissism was negatively related to ethical leadership in highly ethical contexts, but not related to ethical leadership in low ethical contexts (Hoffman et al., 2013). As with the Blair et al. (2008) study, the measure of ethical leadership used examined the extent to which leaders engaged in a particular behavior (e.g., “listens to what employees have to say”) according to subordinates, which may not offer a complete picture of destructive behaviors. To address this in the present study, the measure of DL being used asks the raters to indicate the likelihood that their manager would engage in a particular behavior, if given the opportunity.
Machiavellianism. Machiavellianism is a personality trait named after Niccolò Machiavelli, who wrote The Prince in the 16th century. Machiavellianism is defined as “cunning, manipulation and the use of any means necessary to achieve one’s political ends” (Judge et al., 2009, p. 867). Leaders high in Machiavellianism tend to seek to exert control over their followers, be politically oriented, and lack affect in interpersonal relationships (Deluga, 2001; McHoskey, 1999). Because they also tend to be highly capable of
influencing others, these leaders can typically convince others to do things for the leader’s own benefit, thus demonstrating clear abuses of power. For our purposes, the most
selfish goals—even if they cause harm to the organization or its members—but they are also prone to using harmful methods of influence to coerce subordinates to achieve such goals (Krasikova et al., 2013).
Extraversion. Extraversion is one dimension of the five-factor model (FFM) of personality and represents the degree to which an individual is sociable, assertive, active, and energetic (Judge et al., 2002). Excessive extraversion may be characterized by behavior that is bold, aggressive, and grandiose (Judge et al., 2009). These individuals prefer the spotlight and are likely to give themselves more credit than they deserve (R. Hogan & Hogan, 2001). Leaders who exhibit high levels of extraversion may be less likely to seek input from
colleagues, which may result in alienation (Judge et al., 2009). Further, because extraverts typically have a high need for stimulation, they are more likely to exhibit transient
enthusiasm for projects, people, and ideas (Beauducel, Brocke, & Leue, 2006). This may result in hasty or ill-advised decision-making (e.g., in aggressive pursuit of
acquisitions/investments), and later, change in course if the returns on their investments do not measure up to their bold and aggressive expectations (Judge et al., 2009). Despite these theoretical links, empirical research has yet to confirm a relationship between extraversion and destructive leadership. However, there has been research demonstrating a negative relationship between extraversion and CWB (Sackett, Berry, Wiemann, & Laczo, 2006; Salgado, 2002), and given the conceptual overlap between CWB and DL, it is reasonable to believe that extraversion may also be related to DL.
(Judge et al., 2002). Individuals who score high on measures of openness have been characterized as nonconforming, priding themselves on their authoritarian and anti-establishment attitudes (McCrae, 1996). High openness leaders tend to be more willing to employ almost any strategy or technique if they believe it increases the likelihood of organizational success (Judge et al., 2009). Leaders high in openness may be easily
distracted by new, unconventional ideas. Consequently they may be more likely to challenge traditional, deeply held organizational values (Judge et al., 2009). Interestingly, in his meta-analysis examining the relationships among the Big Five factors of personality and CWB, Salgado (2002) reported a negative relationship between openness and turnover, an indicator of CWB.
Neuroticism. A third dimension of the FFM, neuroticism (low emotional stability) represents the tendency to experience negative emotions (e.g., anxiety, insecurity, anger; Judge et al., 2002). Leaders low in neuroticism tend to be seen as reserved, laid-back, even leisurely (Goldberg, 1999). Given that the interpersonal component of leadership is
and colleagues found that emotional stability was positively related to subordinate ratings of ethical leadership after controlling for leader-member exchange (LMX) ratings (Kalshoven, Den Hartog, & De Hoogh, 2011).
Conscientiousness. Another dimension of the FFM, conscientiousness is characterized by individuals’ tendency to be efficient, detail-oriented, deliberate, and
demonstrate a strong sense of direction in pursuit of their goals (Costa & McCrae, 1992). At high levels of conscientiousness, individuals may be overly cautious and analytical, and as a result, may be less likely to incorporate innovative or risky strategies (R. Hogan & Hogan, 2001). Leaders who are very high in conscientiousness may also be perfectionists and, as a result, overly critical of subordinates’ performance (R. Hogan & Hogan, 2001). In addition to research demonstrating a link between conscientiousness and subordinate ratings of ethical leadership (Kalshoven et al., 2011; Walumbwa & Schaubroeck, 2009), researchers have also reported negative correlations between conscientiousness and both CWB (Sackett et al., 2006; Salgado, 2002) and organizational deviance (Berry, Ones, & Sackett, 2007).
ratings, even if not warranted. There is evidence that leader agreeableness is positively related to subordinate ratings of ethical leadership (Kalshoven et al., 2011; Walumbwa & Schaubroeck, 2009). Furthermore, researchers also found negative relationships between agreeableness and both CWB (Sackett et al., 2006; Salgado, 2002) and interpersonal deviance (Berry et al., 2007).
the sample and the power needed to detect more complex relationships, it was not possible to test interactions using a variable-oriented approach.
In contrast to a variable-oriented approach, a pattern- or person-oriented approach categorizes individuals based on their pattern of traits (e.g., high conscientiousness, low extraversion, high agreeableness, moderate neuroticism, and low openness). Thus, a pattern approach is able to identify actual trait patterns that exist among the sample and can then assess the extent to which they are related to criterion variables. Proponents of the pattern approach argue that individual differences (variables) are most meaningful when they are part of a pattern or configuration rather than examined in isolation (Magnusson, 1995). The pattern approach assumes that each individual continually interacts with the environment, but also that each individual maintains a fairly stable, consistent pattern of individual differences. As such, a pattern approach seems to more adequately reflect the configural nature of
personality itself. Furthermore, because leadership occurs in a dynamic, social context, we should be able to get a more complete picture of leadership by using a pattern approach to complement research done using a variable approach (Nystedt, 1997). The following section provides a more in-depth overview of the pattern approach, as well as a summary of the research that has been conducted in this area.
Pattern approach.
the underlying assumption is that an individual is more than the sum of his or her traits. Taken further, this implies that one trait, for example narcissism, is less meaningful on its own than when it is examined in the context of other traits occurring in an individual (Bergman, 2000; Foti & Hauenstein, 2007).
In addition to these theoretical differences, a pattern approach has several practical advantages over a traditional variable-based approach (e.g., multiple regression). First, a pattern approach allows for the identification of interactions that only hold for subsets of the sample, whereas traditional regression-based methods will only detect interactions if they hold across the entire sample. Related to this point, a pattern approach can examine configurations defined by larger numbers of variables than would be possible to test using regression without very large sample sizes.
Thus far, there has been virtually no research examining the relationships among individual differences and destructive leadership using a pattern approach. Of the leadership research that has been conducted using a pattern approach, nearly all of it has examined the relationships among individual differences and leadership effectiveness and/or emergence. McClelland and Boyatzis (1982) found that a profile including moderate to high need for power, low need for affiliation, and high activity inhibition was related to subsequent managerial promotion rates. Smith and Foti (1998) found that a profile including high
study of 821 junior-level U.S. Army officers, Mumford et al. (Mumford et al., 2000)
determined that there were seven types of leader characteristics among them. Of these, three of these types were also found among 426 senior-level officers, demonstrating the patterns of characteristics that were more prevalent among senior leaders.
All of the aforementioned pattern-oriented studies focused on the bright side of
leaders and/or leadership. In fact, very few “dark side” studies have used a pattern approach. In one such exception, Torregiante (2005) examined destructive trait patterns (using the Hogan Development Survey, HDS; R. Hogan & Hogan, 1997) and leadership performance among 295 executives to determine what personality trait patterns existed among them. She found that one personality profile (unpredictable, critical, overreacts to pressure, prefers to be alone, not afraid of failure, self-confident, suspicious of authority, sensitive to criticism, resistant to change, detail-oriented, well-organized, decisive, and willing to take risks) was associated with the lowest performance ratings. Based on her findings, she argued that the pattern of the HDS scores appeared to play a greater role in predicting leadership
performance than did the magnitude of the HDS scores (Torregiante, 2005). While this study did examine dark side traits, the criteria used were measures of constructive, rather than destructive, leadership.
in illegal activities (e.g., theft, vandalism, intoxicated driving, and experimentation with explosives). ASPs had also received more parking tickets, been issued more university judicial reprimands, and were more likely to have been arrested as compared to non-ASPs. The researchers argued that if hired, ASPs were also likely to intimidate subordinates or colleagues, lie, misrepresent others’ ideas as their own, and disobey ethical or legal procedures (Gustafson & Ritzer, 1995).
To summarize, while there has been a recent increase in research examining
individual differences associated with destructive leadership (or similar constructs), much of it has been either theoretical or retrospective. Of the prospective empirical research, a considerable proportion of those studies used non-employee (i.e., student) samples or lower-level employee samples. And of the empirical research that has been conducted using organizational leaders, virtually all of it has used a variable approach. Such research has certainly provided useful information regarding the extent to which individual differences are related to destructive leadership, but has also been somewhat limited in that the individual becomes abstracted in the analysis and interpretation, and does not adequately capture the configural nature of personality. Thus it would be valuable to examine these relationships from a different perspective—by examining the extent to which certain patterns of individual differences predict destructive leadership.
research was conducted using college students and focused on characteristics (e.g., psychopathy) not typical of a healthy population. By contrast, the current study seeks to utilize a person-centered approach to examine personality patterns (comprising subclinical traits) and the extent to which they are related to destructive leadership using a sample of organizational leaders.
The Current Study
Given the potential for harm resulting from destructive leadership, and the existing gaps in the extant literature, the purpose of the present study is to examine leader personality patterns and determine how different personality profiles are related to subordinate
perceptions of destructive leadership. The aim of the first two research questions is to gain a better understanding of the characteristic patterns of personality traits that actually exist among leaders and to estimate the frequency with which they occur.
Research question 1. How many distinct personality trait patterns (i.e., profiles) exist among leaders?
Research question 2. What is the nature of each profile and what proportion of the sample is classified under each?
As previously discussed, there is reason to believe that organizational level may play a role in the prevalence of personality profiles. Kaiser and Hogan (2007) argued that the effects of leader personality are magnified as leaders are promoted, due to having more discretion in their decisions and greater consequences for their actions. This is also
Kahn, 1978). In order to address this issue, the aim of the third research question is to
determine the prevalence of each personality profile at several different organizational levels. Research question 3. Are leader profiles differentially represented at three different organizational levels (first-line supervisor, middle manager, and executive)?
The aim of the fourth research question is to externally validate the clusters (profiles) by assessing the extent to which leader personality profiles are associated with subordinate perceptions of destructive leadership. As previously discussed, subordinate perceptions are likely to be the most accurate source of destructive leadership ratings. Due to the very nature of destructive leadership (i.e., deception, manipulation), truly destructive leaders are unlikely to rate themselves as such. Furthermore, leaders’ peers and their own supervisors appear to be less likely to witness behavior consistent with destructive leadership simply by virtue of the fact that leaders are likely to behave better in the company of their peers and superiors. Subordinates, however, are not only more likely to witness a leader’s destructive behavior, they are often the ones who experience it firsthand.
Research question 4. Do differences exist among personality profiles on ratings of subordinate perceptions of destructive leadership?
Method Participants
The current study used archival data that were collected from individuals employed in hierarchically structured organizations. Olls (2014) collected responses from 242
majority of potential leader participants were contacted using publically available
information (i.e., name and e-mail address), most of the participants likely represented non-profit, state and/or federally funded organizations. The majority of the leaders contacted were employed at one of several, large southeastern American universities, with the
remaining participants recruited from smaller organizations located throughout the southeast. In addition to education, a variety of industries were represented including: federal and state government, healthcare, information technology, professional services (e.g., law, medicine, consulting), financial services and banking, pharmaceuticals, and non-profit organizations. Leader participants reported working for organizations ranging in size from fewer than 100 employees (63%), to greater than 5000 employees (13%). Leader participants were nearly evenly divided across three organizational levels: first line supervisors (32.6%), middle managers (31.1%), and executives (31.9%); 3.7% of leaders considered themselves individual contributors1.
In order to be included in Olls’s (2014) analyses, subordinates must have directly reported to their leader for at least three months in order to ensure that there was sufficient time to interact with and form an impression of the leader. Of the subordinate participants, nearly all (94%) worked with their manager full time. Of these, 96% reported directly to their managers, and 4% reported indirectly (i.e., through an intermediate manager). The median length of time the subordinates had reported to the focal manager was 36 months. As participation only involved completing a brief survey, neither leader nor subordinate
participants were offered remuneration for their participation.
Procedure
Contact information was obtained for 1,050 potential leader participants via the researcher’s personal contacts as well as organizations’ websites. These individuals were contacted via e-mail and asked if they would be willing to complete an online survey as part of a research study. If they agreed, they were asked to complete personality measures on narcissism, Machiavellianism, extraversion, openness to experience, neuroticism,
conscientiousness, and agreeableness, in addition to answering several demographic
questions. Leader participants were also asked to provide contact information for up to five of their current direct report subordinates (Olls, 2014). The named subordinates were subsequently contacted by e-mail, informed that their manager had participated in a research study, and asked if they would be willing to complete a separate online survey as part of this study.
Subordinate participants were asked to complete the short version of the Perceived Leader Integrity Scale and a shortened version of the Destructive Leadership Questionnaire (DLQ; Shaw, Erickson, & Harvey, 2011). Subordinates were also asked to provide some demographic information and to answer several questions about their relationship to the focal manager and their organizational tenure (Olls, 2014).
Measures
Narcissistic personality inventory. Leader narcissism was assessed using a self-report measure consisting of items from the Narcissistic Personality Inventory (NPI; Kubarych et al., 2004; Raskin & Terry, 1988). Consistent with Galvin, Waldman, and Balthazard (2010)’s use of this measure in a sample of senior leaders, items from the vanity subscale (e.g., “I like to show off my body” and “I like to start new fads and fashions”) were not included as they were considered to be more relevant among college student samples (in which they are most frequently used) than among leader samples. The modified version contained 34 items (see Appendix A). Each item consisted of a pair of statements: one considered narcissistic, and the other non-narcissistic. Each item consists of a pair of statements: one considered narcissistic, and the other non-narcissistic. An example is:
A. I am not good at influencing people.
B. I have a natural talent for influencing people.
In this case, “B” is considered the narcissistic choice. One point was added to an individual’s NPI score for each narcissistic statement endorsed; thus an individual’s NPI score represents the proportion of narcissistic items endorsed. Higher scores indicate higher levels of
narcissism.
Machiavellianism IV scale. The 20-item, self-report Machiavellianism IV Scale (Mach IV; Christie & Geis, 1970) was used to assess Machiavellianism in leaders. The scale was developed in congruence with statements from Machiavelli’s The Prince and Discourses (Christie, 1970). Sample items include, “Never tell anyone the real reason you did
they want to hear,” and “There is no excuse for lying to someone” (reverse scored). Items were rated using a seven-point Likert type response format ranging from 1 (“strongly disagree”) to 7 (“strongly agree”). Of the 20 Mach-IV items collected, two items were removed from subsequent analyses in order to achieve a coefficient alpha greater than 0.70. These two items were: “One should take action only when sure it is morally right” (reverse coded) and “It is possible to be good in all respects” (reverse coded). The final, 18-item measure is provided in Appendix B.
Big Five personality inventory. The Big Five factors of personality (extraversion, openness to experience, neuroticism, conscientiousness, and agreeableness) were assessed using the 20-item Mini-IPIP scales (Donnellan, Oswald, Baird, & Lucas, 2006), which is a short version of the 50-item International Personality Item Pool – Five Factor Model measure (Goldberg, 1999). Each of the five factors was assessed using four items, for a total of 20 self-report items (see Appendix C). Items were rated using a five-point Likert type response format ranging from 1 (“very inaccurate”) to 5 (“very accurate”).
Extraversion. The extraversion scale was used to assess the extent to which individuals are sociable, assertive and active. Leader participants were asked to rate the extent to which each item described them. Sample items include, “Talk to a lot of different people at parties,” and “Keep in the background” (reverse scored).
Neuroticism. The neuroticism scale was used to assess the extent to which
individuals are anxious, unstable, stressed, and impulsive. Leader participants were asked to rate the extent to which each item described them. Sample items include, “Am relaxed most of the time,” (reverse scored) and “Get upset easily.”
Conscientiousness. The conscientiousness scale was used to assess the extent to which individuals are orderly, attentive to details, and deliberate in their actions. Leader participants were asked to rate the extent to which each item described them. Sample items include, “Get chores done right away,” and “Make a mess of things” (reverse scored).
Agreeableness. The agreeableness scale was used to assess the extent to which individuals are modest, empathetic, and concerned for others. Leader participants were asked to rate the extent to which each item described them. Sample items include,
“Sympathize with others’ feelings,” and “Am not really interested in others” (reverse scored). Perceived leader integrity scale. Subordinates’ impressions of their leaders’
representing the degree to which each item described the leader, ranging from 0 (“not at all”) to 3 (“well”). PLIS scores were calculated for each subordinate by averaging across those eight items. Higher PLIS scores indicate higher levels of destructive leadership (i.e., lower perceived integrity). For managers with two or more subordinate raters, the mean PLIS score across all subordinates for that manager was used. In order to determine whether aggregation to the leader level was appropriate, interrater agreement was calculated for all PLIS items. Agreement was calculated using r*wg(j) (Lindell & Brandt, 1999; Lindell, Brandt, & Whitney, 1999), which is similar to James and colleagues’ rwg(j) index (James, Demaree, & Wolf, 1984, 1993), but is more appropriate for bimodal distributions, which can occur when a manager’s subordinates cluster into an “in-group” and an “out-group” (characterized by high or low levels of trust, interaction, support, and loyalty, respectively; Dienesch & Liden, 1986). Values of r*wg(j) ranged from -0.66 to 1.00, with a median value of 0.93. This is considered very strong agreement among raters (LeBreton & Senter, 2008). Therefore, aggregation to the leader level was deemed to be appropriate.
Destructive leadership questionnaire. The Destructive Leadership Questionnaire (DLQ; Shaw et al., 2011) was developed in congruence with Einarsen et al.’s (2007)
conceptualization of destructive leadership, defined as the “systematic and repeated behavior by a leader, supervisor, or manager that violates the legitimate interest of the organization by undermining and/or sabotaging the organization’s goals, tasks, resources, and effectiveness and/or the motivation, well-being or job satisfaction of subordinates” (p. 208).
performance-centric in nature rather than values-centric (Mullins, 2015). In Olls’s (2014) study, subordinates rated their managers on a 20-item version of the DLQ. These 20 items were based on the results of an exploratory factor analysis conducted to reduce the number of items from the original 127-item measure while still retaining a representative sample of items from the full DLQ. Each of the 20 retained items loaded onto one of four factors: managerial ineffectiveness, interpersonal harshness, laissez-faire management, or indecisiveness/inaction.
Mullins (2015) has since reported that more than half of the original 127 DLQ items load more strongly onto performance-centric factors than on values-centric factors, the latter of which is more consistent with how destructive leadership is being defined in the current study. Therefore, the performance-centric and values-centric items from that study were compared to the 20 items used in Olls’s (2014) study. The 15 items that made up three subscales (managerial ineffectiveness, laissez-faire management, and
indecisiveness/inaction) used in Olls’s study were items that loaded onto one of Mullins’s performance-centric factors. The remaining five items (all on Olls’s interpersonal harshness subscale) loaded onto Mullins’s active destructive factor (one of Mullins’s two values-centric factors).
the remaining 15 items are more consistent with ineffective leadership rather than destructive leadership as it is defined in the present study; therefore these 15 items were not included.
DLQ items assess both supervisors’ trait-like personal characteristics and their behavior. Some examples of DLQ:IH items are: “My boss places brutal pressure on
subordinates” and “my boss is a tyrant.” The five items used for the DLQ:IH are provided in Appendix E. Consistent with the original DLQ measure, subordinates rated their leader using a six-point Likert type response format representing the degree to which they agreed with each item, ranging from 1 (“strongly disagree”) to 6 (“strongly agree”). Alternatively, participants could select “Don’t Know” if they felt unable to rate their manager on a
particular item.2
The DLQ:IH scores were obtained for each subordinate by averaging across those five items. Higher DLQ:IH scores indicate higher levels of destructive leadership. For single-rater/manager dyads, the DLQ:IH score calculated for the subordinate was used for that manager. For managers with more than one subordinate participating in the study, DLQ:IH scores were averaged across subordinates for that manager. In order to determine whether aggregation to the leader level was appropriate, interrater agreement was calculated for the DLQ:IH items using r*wg(j) (Lindell & Brandt, 1999; Lindell et al., 1999). Values of r*wg(j) ranged from -1.23 to 1.00, with a median value of 0.85. This is considered strong agreement among raters (LeBreton & Senter, 2008). Therefore, aggregation to the leader level was deemed to be appropriate.
Results Personality Items Factor Analysis
A combination of exploratory factor analysis (EFA) and confirmatory factor analysis (CFA) was performed to examine the factor structure of the personality items for this sample of leaders. EFA was conducted with all personality items using principal axis extraction and Harris-Kaiser oblique rotation. The goal of the factor analyses was to determine whether a seven-factor solution corresponding to the a priori scales (i.e., extraversion, openness, neuroticism, conscientiousness, agreeableness, narcissism, and Machiavellianism) would adequately fit the data. Based on examination of the eigenvalue scree plot and
interpretability of the rotated factor structure, a four-factor empirically derived (ED) solution was deemed to be most appropriate. Although this solution only accounted for
approximately 35% of the common variance, solutions containing more factors—and accounting for more variance—included factors with an inadequate number of items per factor (i.e., one or two) and were not readily interpretable. The highest-loading,
non-overlapping items that were not significantly cross-loaded on other factors were selected for each of these four factors. A follow-up CFA was conducted using just these selected items. The CFA indicated adequate fit of the four-factor model, χ2 (50) = 72.729, p = .020;
CFI=.838; WRMR=.924; RMSEA=.058. Although the RMSEA is not below .05, which is considered excellent fit, MacCallum, Browne, and Sugawara (1996) suggested that a RMSEA value less than .08 may be considered mediocre fit.
Agreeableness. The Egocentrism/Narcissism factor3 comprised nine items: all four extraversion items and five NPI items. Examples of items loading on the
Egocentrism/Narcissism factor were: “I really like to be the center of attention,” “I am the life of the party,” and “I know I am good because everyone keeps telling me so.” The Power/Influence factor4 comprised seven items: four Mach-IV items and three NPI items. Examples of items loading on the Power/Influence factor were: “I am a born leader,” “Never tell anyone the real reason you did something unless it is useful to do so,” and “I am an extraordinary person.” The Conscientiousness factor (α = 0.68) comprised all four of the mini-IPIP conscientiousness items. Examples of these items were: “Get chores done right away,” “Like order,” and “Often forget to put things back in their proper place” (reverse coded). The Agreeableness factor (α = 0.66) comprised three of the four mini-IPIP
agreeableness items. These items were: “Feel others’ emotions,” “Sympathize with others’ feelings,” and “Am not interested in other people’s problems” (reverse coded). The items for each of these four empirically derived factors are provided in Appendix F.
Because the ED solution did not include any items from the IPIP openness or neuroticism scales, a decision was made to perform subsequent analyses twice: once using the four empirically derived personality factors (Egocentrism/Narcissism, Power/Influence, Conscientiousness, and Agreeableness), and a second time using the seven a priori
personality factors (Extraversion, Openness, Neuroticism, Conscientiousness, Agreeableness, Narcissism, and Machiavellianism).
3 Because the extraversion and NPI items used to assess the EN dimension were originally on different metrics and had to be standardized prior to combining them, coefficient alpha could not be computed.
For the ED dimensions, subscale scores were computed for use in subsequent
analyses. For the Agreeableness and Conscientiousness dimensions, all of the items were on the same metric and therefore the subscale score was simply the mean of the items assessing that dimension. The Egocentrism/Narcissism dimension included both NPI and extraversion items, which were not on the same metric. Therefore, sub-dimension scores were first
calculated. The mean of the five NPI items was computed for each leader and then converted to a standard (z) score. Similarly, the mean of the four extraversion items was computed for each leader and then converted to a standard (z) score. Finally, the mean of the standardized NPI sub-dimension score and the standardized extraversion sub-dimension score was
computed to obtain the Egocentrism/Narcissism dimension score for each leader. Similarly, the Power/Influence dimension included four Mach-IV items and three NPI items, which were not on the same metric. Therefore, sub-dimension scores were first calculated. The mean of the four Mach-IV items was computed for each leader and then converted to a standard (z) score. Likewise, the mean of the three NPI items was computed for each leader and then converted to a standard (z) score. Finally, the mean of the standardized Mach-IV sub-dimension score and the standardized NPI sub-dimension score was computed to obtain the Power/Influence dimension score for each leader. These empirically derived (ED) personality dimension scores were used in both the cluster analysis and the latent profile analysis.
Thirty-four NPI items were used to assess leader narcissism (NARC). Eighteen Mach-IV items were used to assess leader Machiavellianism (MACH).
Confirmatory factor analyses (CFA) were performed to ascertain that the seven a priori factors could each be considered unidimensional. A one-factor CFA of the 18 Mach-IV items (randomly assigned to four parcels) indicated adequate fit, χ2(2) = 3.001, p > .05; CFI = .987; SRMR = .025; RMSEA = .061. A one-factor CFA of the 34 NPI items
(randomly assigned to eight parcels) indicated adequate fit, after allowing the error terms for parcel 1 and parcel 6 to correlate, χ2(19) = 25.837, p > .05; CFI = .975; SRMR = .049; RMSEA = .052. A five-factor CFA of the 20 IPIP items indicated adequate fit, assuming agreeableness items 1 and 2 (“Sympathize with others’ feelings” and “Feel others’
emotions”) and items 3 and 4 (“Am not really interested in others” (reverse) and “Am not interested in other people’s problems” (reverse)) had correlated errors, χ2(158) = 257.704, p < .001; CFI = .811; SRMR = .084; RMSEA = .068. Thus, each of the seven a priori
personality factors could be considered unidimensional when examined in isolation from the others. Subscale scores were calculated for each of these a priori (AP) factors for each leader by computing the mean of all items associated with each factor after reverse coding items as appropriate. These AP factor scores were used in both the cluster analysis and the latent profile analysis.
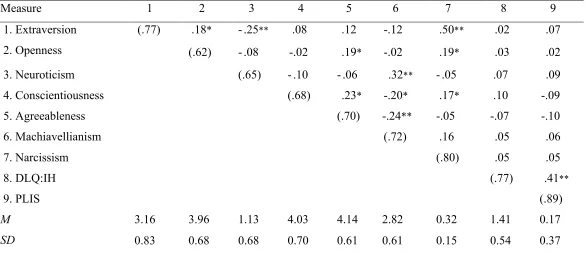
Table 1.
Summary of Intercorrelations, Means, and Standard Deviations
Measure 1 2 3 4 5 6 7 8 9 1. Extraversion (.77) .18* -.25** .08 .12 -.12 .50** .02 .07
2. Openness (.62) -.08 -.02 .19* -.02 .19* .03 .02
3. Neuroticism (.65) -.10 -.06 .32** -.05 .07 .09
4. Conscientiousness (.68) .23* -.20* .17* .10 -.09
5. Agreeableness (.70) -.24** -.05 -.07 -.10
6. Machiavellianism (.72) .16 .05 .06
7. Narcissism (.80) .05 .05
8. DLQ:IH (.77) .41**
9. PLIS (.89)
M 3.16 3.96 1.13 4.03 4.14 2.82 0.32 1.41 0.17
SD 0.83 0.68 0.68 0.70 0.61 0.61 0.15 0.54 0.37
Note. Numbers along the diagonal are Cronbach’s coefficient alpha values. Means, standard deviations, and reliabilities calculated at rater level (Nsubordinate = 242, Nmanager = 135). Intercorrelations calculated at manager level (N = 135).
All analyses, with the exception of cluster analyses, were performed using Mplus version 5.21 (Muthén & Muthén, 2010) and IBM SPSS version 19.0 (IBM Corp., 2010). Cluster analyses were conducted using the statistical package SLEIPNER version 2.1 (Bergman & El-Khouri, 2002).
To address the first research question (i.e., how many distinct personality trait patterns exist among leaders?) and the second research question (i.e., what is the nature of each profile and what proportion of the sample is classified under each?), two primary analyses were conducted on leader personality ratings: hierarchical agglomerative cluster analysis and latent profile analysis.
Cluster Analyses
Empirically derived factors. Data were prepared for cluster analyses by grouping personality items into the four empirically derived factors (Egocentrism/Narcissism, Power/Influence, Conscientiousness, and Agreeableness). Because dimension scores were being used (rather than item-level data), all leaders met SLEIPNER’s requirement for complete data and could therefore be included in the cluster analysis. Prior to any analyses, dimension scores were standardized (to z-scores) to prevent the resulting clusters from being affected by disproportionately large variances.
Next, outliers (i.e., cases that do not have an initial “sibling” based on pattern similarity) were identified and removed from the data using the RESIDUE function in SLEIPNER. If the SED between a case and its nearest ‘sibling’ was more than 0.5 (the default value for the RESIDUE function), the case was removed as an outlier. Of the 135 cases, the RESIDUE function identified and removed 11 outliers (8%). Therefore, 124 cases were included in this cluster analysis.