LEAKAGE BEHAVIOUR OF A PRE-STRESSED CONCRETE
CONTAINMENT UNDER AIR AND STEAM LOADS
IN THE PACE-1450 EXPERIMENT
Nico Herrmann1, Harald S. Müller2, Christoph Niklasch3, Sylvie Michel-Ponnelle4, Benoît Masson5
1
Vice-President, Materials Testing and Research Institute (MPA Karlsruhe), Karlsruhe Institute of Technology (KIT), Karlsruhe, Germany
2
President, Materials Testing and Research Institute (MPA Karlsruhe), Karlsruhe Institute of Technology (KIT), Karlsruhe, Germany 3
Senior Engineer, Züblin AG, Stuttgart, Germany 4
Senior Researcher, Department AMA, EDF R&D, Clamart, France 5
Senior Researcher, EDF SEPTEN, Villeurbanne, France
ABSTRACT
A variety of civil engineering R&D programs dedicated to the analysis of nuclear power plant containments under accidental conditions have been performed in the last decades. The possible air and steam leakage through cracks of the pre-stressed concrete containment is of particular interest. Experiments including the limit state under an accidental containment overpressure with realistic loading conditions are the basis for the verification of constitutive laws for concrete and techniques of modelling which are to be implemented in calculation codes.
For the PACE-1450 experiment a leakage testing facility for pre-stressed curved specimen has been built up. The test campaign has been successfully finished with the evaluation of gained results still ongoing. In sum twelve test runs have been performed. The first ones were mainly dedicated to the crack behaviour of the realistically reinforced specimen while the majority of the tests were focussing on the leakage behaviour of the cracked specimen. For the leakage tests cold air, heated air and air-steam mixtures were used as media transferring the cracks. The leakage has been collected at the outlet of the cracks with the possibility of dividing the air part from the water part.
A short description of the set-up is given in the paper which focuses on the results of the performed tests with heated air and the comparison of these leakage results with the cold air tests. The data evaluation of the experiments with air-steam-mixtures is still ongoing and will therefore be published in the near future.
INTRODUCTION
The possible leakage through cracks of the pre-stressed concrete containment is of particular interest regarding nuclear power plant containments under accidental conditions. In the last decades a variety of civil engineering R&D programs dedicated to relating analyses have been performed. Experimental investigations under loading conditions taking into account the limit state of the structure under an accidental containment overpressure are the basis for the validation of new constitutive laws for concrete and techniques of modelling which have to be implemented in calculation codes.
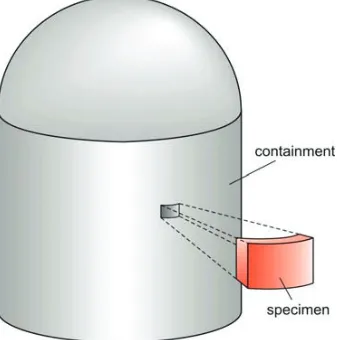
21.9 m and a thickness of 1.2 m simulating a part of a reactor containment as a pressure chamber under correct mechanical conditions in order to obtain a membrane stress state would have been too costly in these times, EDF and MPA Karlsruhe decided to build up a facility to test a representative curved specimen which can be loaded very similar to a closed ring under internal pressure and having realistic dimensions. Parts of an already existing facility have been reused for building up a new and improved testing facility which is focused on the testing of pre-stressed, curved specimen under inspection and accidental conditions. This issue has been investigated by EDF and MPA Karlsruhe in an intensive experimental and also numerical work and has already been published at several occasions in the past.
TEST PROGRAM AND EXPERIMENTAL SET-UP
The PACE-1450 experiment is intermediate sized and addresses the behaviour of a curved specimen being representative for a 1450 MWe nuclear power plant containment under accidental loading conditions. The specimen’s dimensions are 3.5 m in length, 1.8 m in width and 1.2 m in height which corresponds to the thickness of the original containment wall (see Figure 1). The reinforcement layout of the specimen is very similar to the original geometry and mainly consists of meshes of bars near the inner and outer surface and in sum four pre-stressing cables in the circumferential direction. During the tests the specimen is loaded by pressure which simulates the internal accidental containment pressure of up to 6 bars (all pressure values in this paper are given in absolute terms). The resulting ring tensile stress in the cylindrical part of the containment is externally applied in the experiment by hydraulic jacks. The initial stressing of the specimen of 12 MPa is realized in such a way that it allows for a decrease of the pre-stressing for the purpose of simulating the ageing of the structure.
The test facility is designed for the cracking of the pre-stressed specimen and for leakage measurements at different controlled crack widths that can be varied also during the tests. In order to gain knowledge of the behaviour of the containment wall segment under the chosen conditions the specimen is equipped with embedded optical fibre strain and temperature sensors and an acoustic emission system to record the initiation of cracks. At the extrados of the containment segment an optical fibre bonded to the surface is installed allowing for crack detection, with laser and inductive displacement sensors monitoring the crack opening and anemometers for air velocity measurement at the crack outlet. The displacement of the edges of the specimen is additionally measured by inductive sensors.
Concrete creep may vary with the mix design but it shall not result in a significant loss of pre-stressing that would jeopardize the containment structural integrity during an over-pressurization scenario (integrated standard leak rate test or accidental situation). For practical purposes, the pre-stressing in the test campaign was gradually decreased over time in order to accelerate the creeping of the concrete and its effects on the post-tensioning system. The first RUN 0 of the series was performed as a test of the facility at a low level of pre-stressing and pressure. The test pressure during RUN 1 to RUN 3 was 5.3 bars. For RUN 4 to RUN 6 a pressure level of 6 bars and a corresponding external force was chosen. The following RUN 7 to RUN 12 have now been successfully performed at a pressure level of 5.2 bars taking into account also hot air and air-steam-mixtures as in real accidental scenarios. The goal of these tests is mainly to steer desired leakage rates and get knowledge of the relation of these rates between cold air, hot air and air-steam-mixture tests. This paper will focus on the comparison of tests with cold air und heated air, namely RUN 7 and RUN 10. The following Table 1 gives an overview of the full test campaign.
Table 1: Test Program
RUN real age (years)
press. (bars)
temp.
(°C) media
pre-stressing (%)
remarks/idea (see also text)
0 0 1.43 20 air 25 testing of facility
1 0 5.30 20 air 100 first day of plant operation
2 10 5.30 20 air 80 leak tightness test after 10 years of operation 3 35 5.30 20 air 60 leak tightness test after 35 years of operation
4 60 6.00 20 air 60 accident after 60 years of operation/
cracking
5 60 6.00 20 air 60 first leakage test (all cracks)/accident after 60 years of operation
6 60 6.00 20 air 60 second leakage test (all cracks)/accident after 60 years of operation
7 60 5.20 20 air 60 third leakage test (single crack) with
varying values for the crack width
8 60 5.20 140 air 60 fourth leakage test (single crack) with
a fixed starting value for the crack width
9 60 5.20 140 air 60 fifth leakage test (single crack) with
an adjusted starting value for the crack width
10 60 5.20 140 air 60 sixth leakage test (single crack) with
an adjusted starting value for the crack width 11 60 5.20 140 air-steam 60 seventh leakage test (single crack) with
an adjusted starting value for the crack width 12 60 5.20 140 air-steam 60 eighth leakage test (single crack) with
an adjusted starting value for the crack width
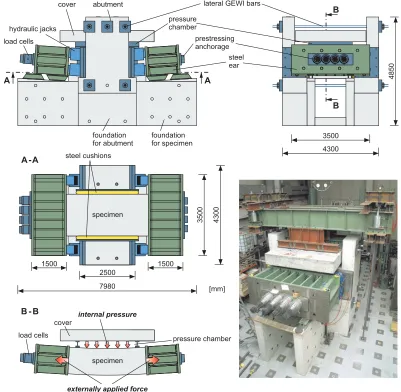
The mechanical part of the set-up mainly consists of the post-tensioned specimen (detailed description see the following chapter), the inner abutments, steel beams (the so called “ears”) at the left and the right hand side as well as the hydraulic jacks pushing the ears to the outward directions. The cover which encloses the pressure chamber, the foundations for the specimen and the abutments complete this part of the set-up (see Figure 2). The specimen itself lies between the sidewise abutments and is connected to the ears by in sum 128 GEWI reinforcement bars on each side. It is loaded with a tensile force that corresponds to the internal pressure which is obtained with the help of the pressure chamber lying atop of the specimen.
bars the specimen is initially put under tension at the very moment when the externally applied force exceeds the pre-stressing force. This situation occurred for the first time during RUN 3. During RUN 4 the concrete was put under a tension load beyond the value of its tensile strength and therefore there was the chance of getting global transversal cracks through the whole specimen.
For the purpose of simulating the pre-stressing of the containment in the original vertical direction steel cushions are placed between the specimen and the abutments which can be set under pressure up to 1 MPa. After appearance of cracks these cushions also serve for the purpose of sealing the specimen in a way that an occurring leakage could be collected and measured beneath the specimen. For the sake of clarity the fixing construction for the cover is not shown in the drawings of Figure 2, it can only be seen in the photo atop of the concrete cover. The thermo-hydraulic mixing facility is able to produce stable complex air-steam mixtures for highly time dependent accidental scenarios. The production principle of the air-steam-mixture has already been described in various other publications in the past.
THE SPECIMEN
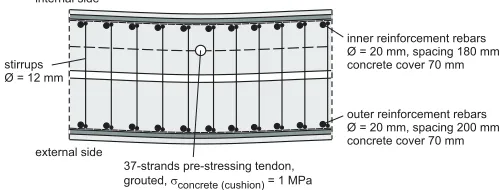
The specimen is post-tensioned by four tendons consisting of 37 strands each. The load in each tendon is prescribed to a level which leads to a stress state of 12 MPa in the original circumferential direction of the specimen. The inner as well as the outer reinforcement in this direction consists of horizontal bars with a diameter of 20 mm with a vertical spacing of 200 mm as shown in Figure 3. The inner and outer mesh layers are connected by stirrups and additional hooks with a diameter of 12 mm. The spacing between the outer vertical bars is 200 mm in the horizontal direction while at the internal side the spacing is reduced to 180 mm. One pre-stressing cable in the original vertical direction is placed lying horizontally within the specimen (flipped in the testing position (see Figure 4)) but without any pre-stressing force.
Figure 3. Section of the specimen as part of the containment
Figure 4. Vertical section in longitudinal direction of the specimen
GEWI reinforcement bars connect the specimen to the ears. The two surfaces of the specimen in the direction to the ears consist of steel plates in order to guarantee for a tight coupling between these parts. For the compensation of slight inaccuracies a thin wooden plate is placed between these steel surfaces of the specimen and the ears. For the assembling of the ears to the specimen they were slowly moved in position by inserting the reinforcement bars into the designated holes in the ear’s surface. After form closure they had been fixed in the correct position by nuts placed within special areas of the ears.
TEST SCENARIOS AND MEASUREMENTS
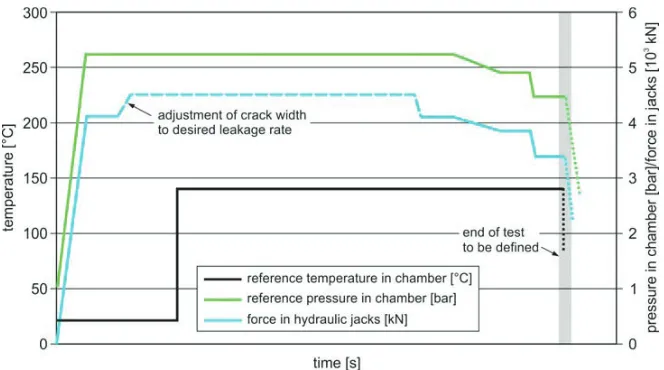
applied internal pressure. In the following RUN 7 and RUN 10 are discussed for which a scenario have been chosen that gives the opportunity for adjusting the leakage rate to different values as it was done in RUN 7 and to steer the leakage rate to a desired value and then start the increase of temperature as in RUN 10. In RUN 10 this was done with heated hot air of 140 °C while in RUN 7 the temperature has been kept stable to 20 °C (see Figure 5). The adjustment of the leakage rate was done by varying the crack width due to manually increasing the tension force independently from the physical relation between the inner containment pressure and the resulting ring tensile stress. After reaching a stable leakage rate the tension force was reduced again to the correctly calculated physical level. The first decreasing ramp for reaching a plateau at 4.9 bars was steered with a decrease rate of 0.5 bars per hour. The next ramps for reaching further pressure plateaus of 4.5 bars, 4.0 bars etc. were again performed with a faster rate of 0.2 bars per minute. The end of the test was decided between the project partners during the respective testing for the case that no further changes in the measured leakage rate was observed.
Figure 5. Principle pressure scenario for the representative tests RUN 7 (temperature kept to 20 °C) and RUN 10 (reference temperature 140 °C after reaching the desired crack width)
All relevant parts of the facility as well as the specimen itself are equipped with transducers for monitoring strain, temperature and cracking events. One measurement system is manufactured by SMARTEC® and consists of optical fibres Bragg network. These sensors provide information on temperature and strain in different locations and directions. Additionally conservative strain measurements with encapsulated strain gauges and temperature measurement with PT100 sensors are embedded at comparable positions to the above mentioned optical sensors. For the monitoring of appearing cracks an acoustic emission system by SMARTMOTE® has been embedded within the specimen. The structural behaviour of the specimen has been controlled by using displacement transducers that are placed at the edges of the specimen in longitudinal, horizontal and vertical direction. The forces in the pre-stressing cable are measured by individual load cells that have also already been used for the pre-stressing procedure and for the control of the pre-stressing decrease.
RESULTS
180
240 L
K M
N
K L
M N
A B C D
E 1 23
E12
A12
E19
D12 D18
C11 C15 C18 C21
B15 B18 B21
A10 A14 A22
load introduction zone load introduction zone
[cm]
observation zone supported area
30
30
30
30
30
30
5 10 10 10 10 10 10 10 10 10 10 10 10 10 10 10 10 10 10 10 10 10 10 10 5
measurement points
A15 A19 E14
Figure 6. Steel balls grid and crack pattern after RUN 4 with positions for crack opening measurements
In order to get more detailed information about the crack opening of the developing cracks a steel balls grid was applied to the specimen’s lower surface. It allowed for mechanical measurement of the displacement between two steel balls at both sides of the new crack without having to know in advance where it will appear. The grid was installed by gluing the balls in five lines with each point 100 mm from its neighboured points. The exact distance between balls is controlled by attaching an extensometer (BAM extensometer Pfender) with an accuracy of 0.001 mm. As the attachment of the extensometer can produce deviations, the measurement is done three times by the same person and the average value is regarded as the correct result. All distances between these points have been measured after the installation, at the pressure peak of 6 bars during RUN 4 and afterwards in order to evaluate the remaining crack widths. At the locations of main interest the crack opening could be identified during RUN 4 as 0.5 mm to 0.6 mm at a pressure level of 6 bars. The average remaining crack widths after the test were measured to less than 0.02 mm.
For the second part of the campaign (RUN 7 to RUN 12) only one of the four main cracks was chosen for further investigations. All cracks beside the middle crack in Figure 6 have been sealed with a steel sheet construction being mounted on the top surface of the specimen. So only the chosen crack of a total length of 1.5 m was accessible to the media. As the crack path within the specimen could not be traced the same collection chamber covering the whole observation area of the lower surface was used below the specimen in order to catch all leakage coming through the specimen. The target value for the starting leakage rate was defined after RUN 7 for the other tests by EDF. This rate was defined basing on the results of RUN 7 and also on observations at real power plants.
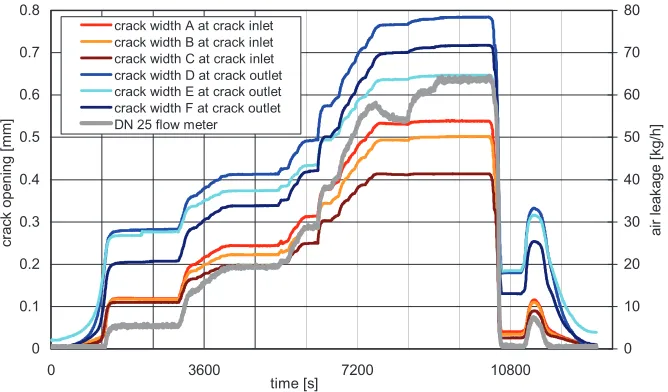
In previous papers only results of the first part of the campaign (RUN 0 to RUN 6) for cold air tests have been published. In the following representative results of the second part of the campaign (RUN 7 to RUN 12) will be shown. Here, RUN 7 and RUN 10 have been chosen. RUN 7 was a test with cold air and RUN 10 was performed under hot air conditions according to the scenario displayed in Figure 5.
at little less than 0.5 mm of average crack opening. Shortly before reaching the last force level some secondary leakage (probably at the sealing of the cover to the specimen) occurred which can be seen in Figure 7 as a decrease of the pressure in the chamber after ca. 7300 s and which could be fixed after ca. 9000 s by adjusting the cover holding construction. After an overall time of ca. 9800 s the test was finished, the last peaks after this time were only steered for test reasons of the facility.
0 50 100 150 200 250 300
0 3600 7200 10800
time [s] te m p e ra tu re [ °C ] 0 1 2 3 4 5 6 p re s s u re i n c h a m b e r [b a r] /f o rc e i n j a c k s [ 1 0
3 k
N
]
reference temperature in chamber [°C] actual temperature in chamber [°C] reference pressure in chamber [bar] actual pressure in chamber [bar] actual force in jacks [kN]
Figure 7. Temperature, pressure in chamber and force in hydraulic jacks during RUN 7
0 0.1 0.2 0.3 0.4 0.5 0.6 0.7 0.8
0 3600 7200 10800
time [s] c ra c k o p e n in g [ m m ] 0 10 20 30 40 50 60 70 80 a ir l e a k a g e [ k g /h ]
crack width A at crack inlet crack width B at crack inlet crack width C at crack inlet crack width D at crack outlet crack width E at crack outlet crack width F at crack outlet DN 25 flow meter
Figure 8. Crack widths and leakage measurement during RUN 7
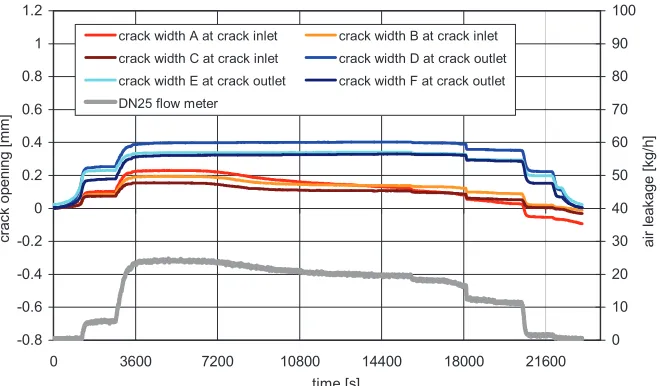
follows perfectly the pressure scenario for the pressure chamber (green lines in Figure 9) resulting in a crack width at the upper surface of the specimen of approximately 0.1 mm (reddish lines in Figure 10).
After ca. 2600 s the force in the jacks had been increased manually in order to reach the mentioned leakage rate which led to a crack width of approximately 0.2 mm at the intrados of the specimen. At the extrados this adjustment also resulted in a doubled crack opening. In Figure 9 also the reference as well as the actual temperature in the pressure chamber is shown. The heating only with air was very slow and it took nearly two hours to reach the target temperature of 140 °C. This had been expected due to the small heat capacity of air and the large volume of the concrete parts of the facility mainly the cover and the specimen itself. 0 50 100 150 200 250 300
0 3600 7200 10800 14400 18000 21600
time [s] te m p e ra tu re [ °C ] 0 1 2 3 4 5 6 p re s s u re i n c h a m b e r [b a r] /f o rc e i n j a c k s [ 1 0
3 k
N
]
reference temperature in chamber [°C] actual temperature in chamber [°C] reference pressure in chamber [bar] actual pressure in chamber [bar] actual force in jacks [kN]
Figure 9. Temperature, pressure in chamber and force in hydraulic jacks during RUN 10
-0.8 -0.6 -0.4 -0.2 0 0.2 0.4 0.6 0.8 1 1.2
0 3600 7200 10800 14400 18000 21600
time [s] c ra c k o p e n in g [ m m ] 0 10 20 30 40 50 60 70 80 90 100 a ir l e a k a g e [ k g /h ]
crack width A at crack inlet crack width B at crack inlet
crack width C at crack inlet crack width D at crack outlet
crack width E at crack outlet crack width F at crack outlet
DN25 flow meter
Figure 10. Crack widths and leakage measurement during RUN 10
Figure 8) decreased also from a value of 24 kg/h under cold conditions to less than 20 kg/h. Afterwards the force adjustment had been retracted not causing a significant effect. This may result from the cracks being already nearly totally closed. A slow decrease of the air pressure had been steered until 4.9 bars were reached and afterwards the values 4.5 bars and 4.0 bars have also been investigated but by using faster ramps to reach the respective target pressure. After the performance of the 4.0 bars plateau it was decided to end the test because no more relevant leakage could be registered. The pressure was then reduced in a fast ramp but still controlled by the steering computer.
Further evaluation of the test data is still ongoing and numerical simulations of all tests of the campaign are underway. The campaign will end in 2015 with the attempt to trace the crack paths in the specimen by filling them with special resin and by sawing the specimen afterwards.
CONCLUSION AND ACKNOWLEDGMENT
For the “PACE-1450 – Experimental Campaign” a leakage testing facility for pre-stressed curved specimen has been built and tests have been successfully performed. The experimental set-up as well as main results concerning cracking and the air leakage behaviour of the specimen under different temperature conditions are described in this paper. Within the current project tests with cold air, hot air and air-steam-mix were performed. Further investigations on the crack paths are planned and alredy scheduled. The facility has been designed in a way that with slight modification specimen with a different curvature can be tested under similar conditions. The research work is done within the framework of the cooperation project “PACE-1450 – Experimental Campaign” of MPA Karlsruhe and the EDF departments R&D and SEPTEN. An overall publication is planned for the near future.
REFERENCES
Eibl, J., Töllner, M., Akkermann, J., Herrmann, N., Rutte, R., Ramm, W., Elz, S. (2001). “Untersuchungen zum Leckverhalten von Stahlbetonwänden - Leckage im
Stahlbeton-containment“, Final Report of the Research Project BMWi 150 1063.
Herrmann, N., Gerlach, L., Müller, H. S., Le Pape, Y., Bento, C., Niklasch, C., Kiefer, D. (2009). “PACE-1450 - Experimental Investigation of the Crack Behavior of Pre-stressed Concrete
Containment Walls considering the Pre-stressing Loss due to Aging”, 20nd Conference on
Structural Mechanics in Reactor Technology SMiRT20, August 9-14, Espoo, Finland.
Herrmann, N., Müller, H. S., Niklasch, C., Michel-Ponnelle, S., Le Pape, Y., Bento, C. (2013). “PACE-1450 – The Crack and Leakage Behaviour of a Prestressed Concrete considering the Prestressing
Loss due to Aging”; 22th International Conference on Structural Mechanics in Reactor
Technology; SMiRT22, August 18-23, San Francisco, USA.
Herrmann, N., Müller, H. S., Niklasch, C., Michel-Ponnelle, S., Bento, C., Masson, B. (2014). “The PACE-1450 experiment – Crack and leakage behavior of a pre-stressed concrete containment wall
considering the aeging”, Contribution of Materials Investigations and Operating Experience to
LWRs, Safety, Performance and Reliability, Fontevraud 8, Avignon, France.
Le Pape, Y., Courtois, A., Ghavamian, S. (2006). “Nuclear power plant concrete containment: monitoring
and modeling the aging mechanisms”, Proceedings of the International Symposium: Contribution
of materials investigations to improve the safety and performance of LWRs, Vol.2, 1145-1155,
Fontevraud 6, France.
Niklasch, C., Coudert, L., Heinfling, G., Hervouet, C., Masson, B., Herrmann, N., Stempniewski, L.
(2005). “Numerical Investigation of the Leakage Behavior of Reinforced Concrete Walls”, The
11th International Topical Meeting on Nuclear Thermal Hydraulics NURETH11, Avignon, France.
Niklasch, C., Herrmann, N. (2009). “Nonlinear fluid–structure interaction calculation of the leakage
behavior of cracked concrete walls”, Nuclear Engineering and Design, Volume 239, September,