Flow-driven formation of solid-like microsphere heaps
†
Carlos P. Ortiz,
*
Robert Riehn
*
and Karen E. Daniels
*
Received 30th July 2012, Accepted 3rd October 2012 DOI: 10.1039/c2sm26762d
We observe the formation of heaps of repulsive microspheres, created by flowing a colloidal
microsphere suspension towards a flat-topped ridge placed within a quasi two-dimensional microfluidic channel. This configuration allows for both shear and normal forces on the microspheres in contact with the ridge. The heaps, which are formed against the ridge, are characterized by two distinct phases: a solid-like bulk phase in the interior and a highly fluctuating, liquid-like state which exists along its leading edge. We observe that heaps only form above a critical flow velocity,vc, and that they are
destroyed by thermal rearrangements when the flow ceases. We monitor the dynamics of heap formation using fluorescence video microscopy, measuring the heap volume and the angle of repose in response to microsphere deposition and erosion processes. We find that the steady state angle of repose,
qf, increases as a function of inflow velocity,vN, with a functional formqffpffiffiffiffiffiffiffiffiffiffiffiffiffiffivN‒vc.
1.
Introduction
Flowing particles will accumulate against an obstacle in their path, a phenomenon exhibited by industrial or agricultural grains accumulating in conical piles and microscopic particles undergoing membrane filtration, particularly ultrafiltration.1
This similarity in behaviors has raised the question of whether there is an underlying commonality which explains the general phenomenon, despite the large difference in length scales, the vastly different importance of Brownian motion and kinetic energy, and the near-absence of interparticle friction in colloidal interactions.
The quest to understand the formation of piles of granular materials has, in fact, become a model system in which to investigate how bulk behaviors arise from highly cooperative effects at the grain scale. Although the basic mechanism for understanding the angle of repose has long been known,2interest
in sandpiles was rekindled by the pioneering work of Baket al.3
Since then, detailed studies of pile-formation have led to a quantitative understanding of the intermittency of granular dynamics near the threshold of flow,4,5force chains,6,7how local dynamic rearrangements8–11 contribute to pile instability, the
prediction of avalanches,12memory effects,6frictional rheology
in submerged flows,13,14 and the relationship between internal
friction and the cessation of flow.15
In this paper, we report on the formation of sandpile-like structures in a two-dimensional (2D), approximately hard-sphere, colloidal system by flowing a dilute suspension against a
ridge within a microfluidic channel. Unlike piles formed under gravity, the flowing colloidal suspension is driven by a static pressure gradient which partitions the system into coexisting gas-like, liquid-gas-like, and solid-like microsphere phases. We find that for sufficiently large Peclet numbers (corresponding to large flow velocities), stable heaps of microspheres are formed by the deposition of particles out of a dilute suspension. When the flow is reduced, the heap re-evaporates in a thermally activated, reversible process. Below, we quantify the conditions under which these heaps form, and we report their key properties as a function of the flow velocity.
Our work extends earlier work on dense 2D colloidal systems in which a complex phase diagram,16,17the influence of hard and
soft interparticle potentials,18,19 the onset of layering,20 the
dynamic response to supercooling,21 and the effect of confine-ment22 were demonstrated. Analogous granular experiments showed a phase space that included even a colloid-like ordered, fluctuating phase.23 Here we add the action of a combined
compressive and shear field to the classical 2D colloid. In dense bulk suspensions the application of similar compressive gravi-tational fields24,25and the shearing field26,27have driven gas–fluid, fluid–solid and solid–solid transitions. Our system joins a growing range of techniques that utilize the tunability of key suspension parameters28 (Peclet number, polydispersity,
inter-action potential) to explore the interplay between Brownian, steric, and specific interparticle potential effects.
2.
Experimental setup
We perform experiments with a dilute suspension of fluorescent polystyrene microspheres (Bangs Laboratories) ofd¼ 520 nm (5.9% polydispersity) at a concentration of 0.1% (w/w), corre-sponding to 6.7 1011 microspheres per ml, suspended in a
Dept. of Physics, North Carolina State University, 2401 Stinson Dr, Raleigh, NC, 27695, USA. E-mail: [email protected]; [email protected]; [email protected]
† Electronic supplementary information (ESI) available: Video accompanying Fig. 3. See DOI: 10.1039/c2sm26762d
Dynamic Article Links
C
<
Soft Matter
Cite this: DOI: 10.1039/c2sm26762d
www.rsc.org/softmatter
PAPER
Downloaded by North Carolina State University on 30 October 2012
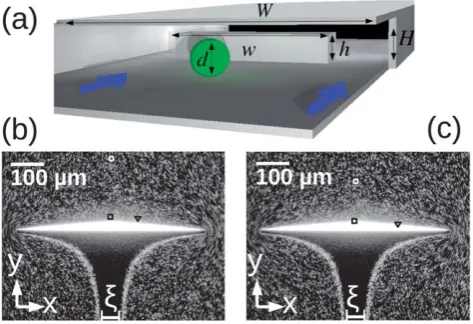
buffer solution described below. The suspension is pumped through a shallow microfluidic device with a flat-topped ridge rising from the channel floor. The full length of the microchannel is 14 mm, long enough to hydrodynamically decouple the access holes from the ridge. The ridge runs perpendicular to the mean flow direction so that microspheres accumulate upstream of it (see Fig. 1). The device channel has a quasi-2D geometry, with widthW¼200dand heightH¼1.8d. The ridge has widthw¼
100d and occupies the central 50% of the channel width, permitting flow around the sides, and a height h ¼ 1.5d, permitting flow over the top. Becaused>Hh, the streamlines which intersect the ridge push microspheres against it with both normal and shear forces (see Fig. 1b and c). Crucially, the geometry is resilient to catastrophic clogging since neither the ridge nor the resulting microsphere heaps span the entire width of the microchannel.
The microfluidic channels are manufactured on a silicon wafer using photolithography to define the channels and reactive ion etching to transfer the pattern into the wafer. Access holes
z300mm in diameter are sandblasted through the silicon wafer with 17 mm alumina particles. The fluid system is closed by bonding the silicon wafer to a borosilicate coverglass (Corning) coated with a 20 mm layer of cross-linked PDMS. This hybrid PDMS–glass coverglass allows for reversible chip bonding, allowing many experiments to be performed on the same chip.29,30The finished device is mounted on a sample holder that
provides 10 ml reservoirs to supply suspensions to the access holes. The suspension flow rate through the channel is set by a digital pressure regulator (AirCom PRE1-UA1) that applies pressurized air (0–10 kPa) into the O-ring sealed reservoir. This regulator allows for the control of extremely low flow rates, corresponding to speeds of 1–100mm s1, by using a piezoelectric crystal as the actuating element. The largest of these speeds corresponds to a Reynolds number of 104, indicating that inertial effects are negligible. The stability of these low velocities
is derived from the regulator’s response time of 10 ms and its high sensitivity (0.1% about the set-point). We measure the suspension velocity response to be linear as a function of pressure.
To introduce the suspension into the chip without micro-spheres interacting with air–water interfaces, we first wet the chip with a microsphere-free buffer. Addition of 1 mM sulforhod-amine dye to the buffer allows verification of complete wetting of the devices by fluorescence microscopy, especially of the gap above the ridge. We then removez90% of the wetting buffer from the reservoir and inject the microsphere-bearing suspension into the remaining buffer. This procedure ensures that air bubbles are not introduced into the access hole and thereby allows us to maintain a stable flow rate over the duration of the experiments. At the start of each experimental run, we flow the suspension into the device.
Using fluorescence microscopy, we both record the local microsphere distribution at the ridge, and continuously determine the two free suspension parameters: inflow velocityvNand mean 2D areal densityr, given by the number of microspheres per unit area. To do this, we use microspheres that are fluorescently labeled with DragonGreen dye (480 nm excitation, 520 nm emission, Bangs Laboratories). We obtain the inflow velocityvNby finding the angle of maximum autocorrelation in two-dimensional graphs of intensity as a function of time and vertical position for each image column. In the Hele-Shaw geometry, the lateral velocity field far from the heap is spatially uniform,31 except within a
distanceHof the channel edges. Thus measurement ofvNover 47mm100mm centered 200mm upstream from the ridge suffices to fully characterize the bulk flow. Throughout the paper, we have used the same spatial region to measure bothvNandr. The latter is measured by counting the number of extended maxima above a noise threshold.
Experiments are performed on a Nikon Eclipse 80i fluorescence microscope, where the microsphere fluorescence is excited by a continuous-wave broadband Xenon lamp (X-cite 120). Emitted light is collected with a 10(numerical aperture 0.3) Plan Fluor objective, and 658496mm2
images are acquired with an Andor Luca EMCCD camera. All images presented are oriented such that the mean inflow and outflow directions are vertical. The physical pixel size is 1010mm2, while the diffraction limited projection of a point object on the CCD at our emission wave-length is 88mm2. This is larger than an equivalent microsphere
diameter, and we are thus not able to resolve individual micro-spheres in dense heaps. The total depth of field is 5.6mm, larger than the depth of the microchannel. In the absence of external driving and far from the ridge, we measure the diffusion constant
Dfor a dilute set of microspheres by constructing trajectories for the centroids of individual microspheres32,33and measuring the mean squared displacements. We findD¼0.55mm2s1, which is comparable to the value expected from the Stokes–Einstein rela-tionship:kBT/6phR¼0.49mm
2
s1. Therefore, the microsphere diffusive time scale issDhd2/D¼0.49 s in the microchannel, so
we set our camera’s exposure time tose¼0.1 s. This exposure time
is sufficiently short to observe microsphere thermal rearrange-ments becausese<sD.
For the microspheres to have reversible contacts, it is neces-sary to reduce attractive interactions. We use a combination of steric and electrostatic stabilization. For steric stabilization, we add a non-ionic surfactant 0.1% (v/v), equivalent to 1.6 mM, Fig. 1 (a) Schematic of microchip geometry (not to scale), showing a
single microsphere flowing towards the flat-topped ridge over which fluid can flow. (b and c) Raw fluorescence images with linear grayscale (black¼background, white¼highest fluorescence intensity) of heap at steady state, at areal densityr¼235/(100mm)2and inflow velocityvN¼ 33 mm s1. In the two seconds between (b) and (c), three tracked microspheres marked by the circle, square, and triangle symbols are shown in both figures to illustrate their relative displacements.
Downloaded by North Carolina State University on 30 October 2012
Triton X-100 (Sigma Aldrich) to a stock suspension of concen-tration 0.1 wt%, which is enough surfactant to reach full coverage of the microspheres if the surface area per surfactant molecule is approximately 12A2. To ensure that the surfactant
coverage of the microsphere surface approaches full coverage, we tumble the suspension over 2 hours atz10 rpm to disrupt the surfactant micelles (critical micelle concentration for Triton X-100z0.02% (v/v), equivalent to 0.22–0.24 mM). To test that we have successfully disrupted the micelles into covering the microspheres, we measure the particle size distribution of the tumbled solution using dynamic light scattering. While the presence of free surfactant introduces an entropic attractive force, the depletion force, we observe that its magnitude is not sufficient to form weakly aggregated gels over months in the absence of fluid flow, much less in the presence of flow. Thus, for our purposes, this depletion force is negligible.
We introduce a long-range repulsive electrostatic interparticle interaction by using microspheres with sulfate-modified surfaces (pKaz2.5). The interaction strength can be tunedviathe buffer
component of the suspension. We set pH¼5.4 with a 10 mM citric acid buffer in water titrated with sodium hydroxide. Using the Henderson–Hasselbalch equation, we estimate the concen-tration of free ions and calculate a Debye length of 3 nm. Experimentally, the ionic strength of the solution is adjusted by dilution of a high-concentration buffer with deionized water until the conductivity is 0.2 0.02 mS cm1. The microsphere
z-potential isz43 mV, ensuring the electrostatic stabilization of the suspension.34 All conductivity, z-potential, and DLS measurements were conducted using a Zetasizer (Malvern).
3.
Results
An illustrative image of a heap at steady state is shown in Fig. 1b and c. The inflow (top to bottom) carries microspheres towards the ridge that runs horizontally. Above the ridge, a dense, approximately triangular zone forms. We measure the geometry of the dense region by finding the points of steepest intensity gradient for each pixel column of the image. From the finite difference of the raw intensities per column, we find the points of highest rise and highest drop in intensity by performing Gaussian fits. The distance between these points gives the distance from the heap surface to the heap base, which we define as the local extent
e(x,t) for each column, wherexis the horizontal position andtis the time. From eache(x,t) profile, we compute the heap area by integratingAðtÞ ¼Ðeðx;tÞdx. An angle of reposeq(t) was defined from the slope ofe(x,t) at the outer edge of the ridge.
Although the suspension flow pattern around the ridge is disturbed by its presence, the microsphere-excluded zone below the ridge provides a clear indication of the amount of liquid passing through the dense zone and over the barrier. We char-acterize the magnitude of this flow by the asymptotic physical extent of the excluded zone x (see Fig. 1b). The edge of the excluded zone is defined by two dense streams of microspheres originating from the fluid-like region along the heap surface (see Fig. 1b and c). While microspheres do not enter this zone advectively, the width of the boundary streams broadens downstream of the ridge due to Brownian motion. Despite this broadening, the streams remain distinct many ridge widths downstream from the ridge at our Peclet numbers. An upper
bound for the uncertainty inxdue to this broadening was 20%. In Fig. 1b and c, the high microsphere areal density indicated by the bright bands delimiting the excluded zone is primarily the result of deterministic lateral displacement35 of the streamlines
colliding with the heap. While the rate of microsphere erosion from the heap also contributes to an enhancedr, this rate is small at the steady state.
We varied the incoming flow velocity over a range of vN¼
1–100mm s1to explore the nature of the dense heap formed
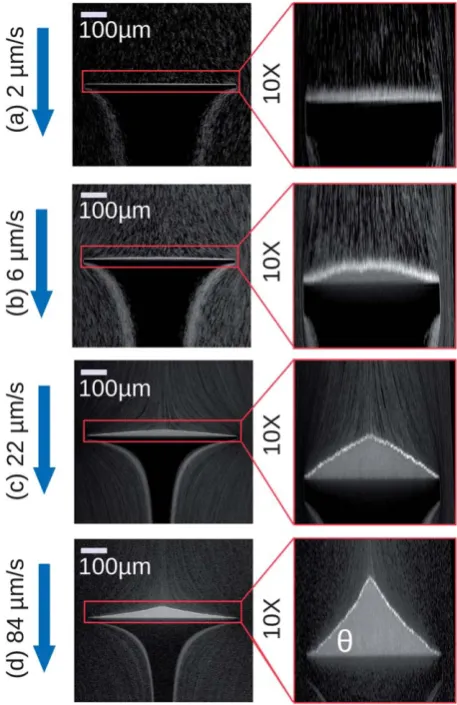
against the ridge. In Fig. 2, we plot the pixel-level fluctuation amplitude of the fluorescence intensity over 0.8 s (80 frames) after a steady state heap was formed (see below for the definition of steady state). Under this analysis, microsphere-free regions and static microspheres appear dark. Isolated microspheres appear as streaks which blend to a homogeneous gray at high flow velocities. The dense region appears gray, and the gray scale
Fig. 2 Processed images showing amplitude of intensity fluctuations in microsphere heaps formed at inflow velocities (a)vN¼2mm s1, (b)vN¼ 6mm s1, (c)vN¼22mm s1, and (d)vN¼84mm s1. The bulk flow is from top to bottom. Each pixel is given a grayscale value proportional to the standard deviation measured over 8 s (80 images) after steady state was reached. Images in the left column have the equal horizontal and vertical scales; images in the right column are stretched by a factor of 10 in the vertical direction. Bright areas at the surface of each heap are strongly fluctuating (fluid-like), while dark areas have a low fluctuation amplitude (solid-like).
Downloaded by North Carolina State University on 30 October 2012
indicates the local magnitude of microsphere rearrangements (without correction for the localr). In all images, we observe a highly fluctuating bright layer on the upstream side of the dense particle region. For sufficiently high flow velocities, we observe a region of low fluctuation amplitude between the ridge and the bright layer (Fig. 2b–d). This region is not present at low flow velocities (Fig. 2a). We interpret the presence of the low-fluctu-ating region as the formation of a quasi-2D heap, by analogy with granular heaps. In the following, we will refer to the region of low fluctuation amplitude as solid-like and the region of high fluctuation amplitude asfluid-like. Note that the fluid-like phase appears to be compressed by the applied flow field in a similar way that an atmosphere can be compressed, but that the large rmakes it unlikely that the particles can be treated as a classical gas.
We observe that the heaps in Fig. 2 do not form perfect triangles, even in the steady state. Instead, we find heaps with rounded peaks and convex sides at lowvN(Fig. 2b and c), and pointed tips and concave sides at high vN (Fig. 2d). We also observed a small degree of asymmetry between the left and right side of the heap, but no systematic variation was observed.
To define the process and time scale over which the heaps reach a steady state, we perform experiments in which we form heaps with solid-like cores at constantvN, and subsequently drop
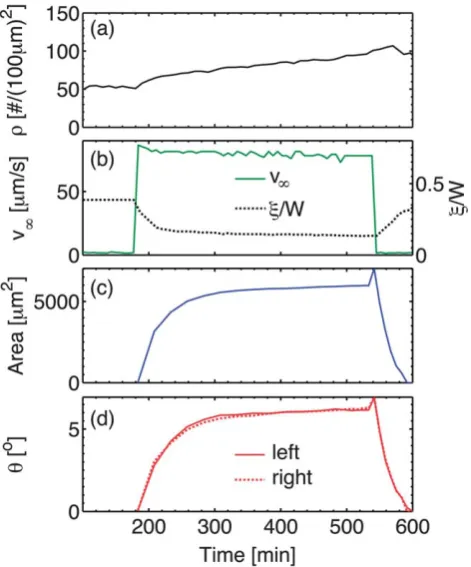
vNto a value at which only the fluid-like layer was previously observed. The results are shown in Fig. 3. Initially, the device was primed with a suspension atvN¼2mm s1for 3 hours without heap formation. AftervNwas quickly increased to 84mm s1, we observed an asymptotic increase of the heap area to A z
6000mm and a steady state angle of repose ofqf¼6.2. The final
heap containedz2104particles and wasz56dtall at its peak. WhenvNwas returned to 2mm s1, a short-lived expansion of the heap was recorded. Thereafter we observed a gradual reduction ofAandquntil only the fluid-like layer remained. The process thus appears as if the solid-like phase gradually erodes, in a process akin to evaporation or melting. All stages of the exper-iment indicated that Brownian motion of microspheres is essential: an atmosphere is present on the forming heap at all times; the heap impulsively expands whenvNis reduced, and the heap gradually reduces thereafter. Visual inspection of the steady state dynamics and of the heap formation and erosion process is available through the ESI.†
For this experimental run, we determined a deposition time constant of 42 min and an erosion time constant of 17 min by fitting exponential relaxation laws toA(t) at early times (Fig. 3c); similar values are obtained forq(t). At longer times, we observe a non-exponential, gradual increase ofA(t) andq(t); we believe this may result from the slow increase of the microsphere areal density throughout the high-vNphase fromr¼50/(100mm)2to
nearly twice of that. Note that this corresponds to a change in the interparticle spacing of the suspension from 16d to 11d, indi-cating that we remain in a weakly interacting gas-like flow regime during this time. We observed that variations within this range did not have a strong effect on the steady state, but did not conduct a detailed investigation of the effect ofron the dynamics or final state.
Fig. 4 shows a detailed exploration of the functional rela-tionship between heap geometry and vN, as illustrated by the images shown in Fig. 2. At each value ofvN, we allowed the heap to reach a steady state, defined by a change inAandqsmaller than 1% per hour (durations ranged from 2–6 hours). To distinguish the cross-over to a heap-forming state, we observed
Fig. 3 Time-series of (a) microsphere concentrationr, (b) inflow velocity vNand scaled width of excluded zonex/W(c) heap areaA, and (d) angle of reposeqin response to a six hour pulse of increased velocity. See ESI† for a video of these dynamics.
Fig. 4 Steady state angle of reposeqfas a function of inflow velocityvN. Solid points denote experiments in which a heap was formed and an angle could be measured; open symbols denote experiments in which no heap (NH) was formed. Velocity error bars represent our measurement uncertainty in the mean measured, while the angle error bars represent the min/max range of angles observed at steady state. Red points corre-spond to the increase/decrease sweep shown in Fig. 5, with indicating the runs in whichvNwas increasing and indicating the runs in whichvN was decreasing. Inset: all solid (heap-forming) points are plotted on logarithmic axes as a function ofvNvc, wherevc¼5mm s1. The dashed line provides a comparison to a power law with exponent 1/2.
Downloaded by North Carolina State University on 30 October 2012
that the two experiments withqfz0.5are unambiguously
heap-forming based on the visual identification of the characteristic low-fluctuation amplitude region using the temporal standard deviation technique. In this regime, q is difficult to measure accurately due to the small height of the heap (z2 pixels).
We observe that there is a well-defined relationship betweenvN
andqf, with finite-sized heaps forming for values ofvNabove a
critical velocityvcz5mm s 1
. Note that Fig. 4 is derived from two distinct experimental series with two different instances of device assembly and thatrvaried but was kept within the dilute regime. For the black points in Fig. 4, r ranges from 40 to 150 mm2, while for the red points, rranges from 290 to 370 mm2. The relative order ofvNvalues was changed between the runs, and the possibility of hysteresis was checkedviaa series of pressure changes in whichvNwas systematically increased and then decreased to the same values. This case will be discussed in more detail below. We observe that the data, in spite of the variation in r, approximately collapse to a single curve which take the approximate formqffpffiffiffiffiffiffiffiffiffiffiffiffiffiffiffiffivNvc.
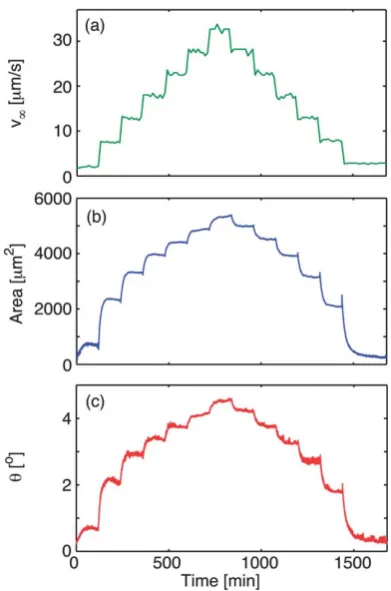
The detailed results of the hysteresis-probing experiment are shown in Fig. 5. The applied pressure is increased and decreased along a staircase profile, resulting in a velocity step of 6mm s1 every two hours (see Fig. 5a), sufficient to reach the steady state. The resultingA(t) andq(t) are shown in Fig. 5b and c, and the triangular points in Fig. 4 are derived from these plots. We observe only weak hysteresis, indicating that the steady state geometry is independent of whether driving is increasing or
decreasing. We further note that the apparent hysteresis is correlated with the variation inr.
An interesting feature of Fig. 5 is the presence of sudden variations inq(see Fig. 5c), which are not present in the heap area curve (Fig. 5b). Visual inspection of the raw video reveals that these likely represent rearrangement events on the heap surface that affect only the profile shape, but not the profile area. Interestingly, these rearrangements are more prominent during the second half of the experiment (erosion) than during the first half (deposition).
4.
Discussion
There are significant similarities between granular heaps created by the raining of particles under gravity and the microsphere heaps created in the present study: both are largely triangular in cross-section and can be built with different angles of repose. However, their dynamic response differs greatly. As we will argue below, the description of the microscale heaps formed here should be based on Brownian motion and viscous drag; note that Brownian motion cannot be described through a single, well-defined force. On the other hand, macroscale granular piles are typically described in terms of contact forces, and possibly inertial effects. In granular materials, the angle of repose is determined by the static friction coefficient m of the particle material,2with larger angles supporting greater tangential forces through larger values ofm. For example, Lemieux and Durian36 observedq z 20(equivalent to m¼ tanq ¼ 0.36) for heaps formed from dry, millimeter-scale, spherical, glass beads.
Compared to granular piles, we measure much lower angles of repose from 0.5to 7(see Fig. 4), and have no expectation of static frictional contacts between the microspheres. Therefore, a closer comparison lies with simulations and experiments on frictionless particles. Peyneau and Roux37observed a lower limit
ofqz5.8for molecular dynamics simulations of a frictionless pack under shear, independent of the applied pressure. Similarly, for 120mm bubbles rising against to form an upside-down heap, Lespiatet al.38observed a lower limit ofqz4.6. These values are consistent with our observations and support the expectation that static friction plays a minimal role. In addition, we find that we are able to form steady state heaps with even lower angles of repose, approachingqfz0(see Fig. 4). This suggests that at low
Peclet numbers, Brownian microspheres are able to explore their cages sufficiently well34,40to destroy the geometrical constraints which give rise to the finite angle of repose in frictionless gran-ular/bubble systems. The fluctuations also lead to lubrication and frictionless contacts since even small thermal displacements are able to disrupt the contact network.39Note that the dynamic friction from viscous drag is always present.
We have described the microsphere heaps formed abovevcas
having a solid-like core, which we identified by its small temporal density fluctuations when compared to the dense region formed below vc, or the boundary layer between the heap and the
surrounding dilute suspension (Fig. 2). Whether the micro-spheres exist in a solid-like or liquid-like state depends on a competition between the stabilizing normal component of the drag force of the fluid flowing through the heap, its de-stabilizing tangential component, and the de-stabilizing Brownian motion of microspheres. At the lowest inflow velocities (such as in Fig. 5 Time-series of (a) inflow velocityvN, (b) heap areaA, (c) angle of
reposeqfor a series of increasing and decreasing pressure steps. The areal density for this run isr¼(33042)/(100mm)2, where the range covers two standard deviations.
Downloaded by North Carolina State University on 30 October 2012
Fig. 2a), the Brownian motion dominates and we observe only a liquid-like phase, without forming a heap. The liquid-like region of our system mirrors the density increase (concentration polarization) that is observed at the interface of a filter membrane in cross-flow filtration systems.41At sufficiently high suspension concentrations or flow velocities through the membrane, these systems also show the formation of a filter cake, mirroring the solid-like bulk phase of the interior of the heap that we observe at highvN(Fig. 2b–d). Note that cross-flow filtration differs from our experiment in that the ratio of normal to tangential flow components is far larger in our system. It is commonly assumed that the cake phase is solidper se, while our heap still undergoes thermal reorganization.
Song and Elimelech42 describe a similar fluid-like layer as
having an exponential density distribution. They defined a criterion for cake formation based on the filtration numberNF,
defined as the ratio of the energy required to bring a particle from the surface of the cake to the interface of bulk solution and the concentration polarized layer. Our measurements support a similar criterion, in which we examine the relative importance of Brownian motion and fluid drag for the transition from a solely liquid-like state (Fig. 2a) to the one in which both phases are present (Fig. 2b–d). We quantify the importance of Brownian motion with the Peclet number PehsD/sa, wheresa¼d/vheapis
the particle advection time and sD¼ d 2
/D is the self-diffusion constant D. We measured D ¼ 0.25 mm2 s1 for a dense
suspension by suddenly ceasing the flow and observing the diffusive broadening of the interface between the solid-like and liquid-like states. A simple argument demanding flow continuity through the heap and over the ridge yields that the mean normal velocity of the aqueous suspension at the shear boundary for
particles is vheapxvNwx. Using our measured value of D, we
obtain 1 < Pe < 23 in the incoming dilute suspension flow for the range ofvNexplored here. The critical velocityvcz5mm s
1
corresponds to Pez2. This argument is only an estimate, as it neglects the influence of both shear and the incident particle density, both of which likely influenceqf. In addition, the
diffu-sion constant is modified by geometry- and concentration-dependent contributions to the Stokes drag43,44 as well as the
degree of confinement.40Nonetheless, in experiments on dense
suspension flows, Isaet al.45also observed a change in
rheolog-ical properties at similar values of Pe.
The microfluidically assembled microsphere heaps will also provide a convenient system in which to examine the behavior of a dense, solid-like colloidal system as a function of the applied stress. In Fig. 3 and 5 we note a transient compression and expansion of the heap upon sudden increase and decrease of the compressive stress set byvN, respectively. For instance, att ¼
533 min in Fig. 3c and d the heap area transiently expands by 18% under a drop in pressure ofz30 Pa, which corresponds to a modulus ofz102Pa, far smaller than the few 109Pa typical for
polystyrene. This observation provides evidence that individual microspheres are not in constant contact with each other but instead continually explore cages by Brownian motion.
Finally we note that the experimental system presented here lends itself for repeated analysis of non-steady state systems that may be driven into supercritical regimes. For instance, we are able to create patches of colloids close to space-filling packing by
releasing close-packed heaps through sudden stopping of the flow. As such, this system will be useful for exploring the temperature-dependence of jammed solids near the jamming transition.46,47 Our observation of a critical v
c above which
jamming occurs is consistent with suggestions48 that thermal systems should jam by increasing the osmotic or hydrostatic pressure. While not explored in the present study, the interpar-ticle potential is tunable by adjusting the pH of the buffer component of the suspension.
5.
Conclusion
In this paper, we have established a new system for the formation of a solid-like heap of microspheres within a microfluidic flow. We observe that the inflow velocity is the key control parameter in setting whether a steady state heap is formed (largevN, small Peclet number) or destroyed (small vN, large Peclet number). The steady state angle of repose of this heap increases from
qf z 0 near the transition, to larger angles (up to 7) at the
fastest velocities explored, with a functional formqffpffiffiffiffiffiffiffiffiffiffiffiffiffiffiffiffivNvc. We propose that this effect arises through the suppression of thermal fluctuations at larger flow velocities through reaching a critical density of microspheres in a region of concentration polarization.
Acknowledgements
The authors are grateful to James Gilchrist and Michael Shearer for stimulating conversations and to John Chavez for technical assistance with the experiments. Parts of this work were per-formed at the Oak Ridge National Laboratory and the Cornell NanoScale Facility, a member of the National Nanotechnology Infrastructure Network, which is supported by the National Science Foundation (Grant ECS-0335765). C.P.O. was sup-ported by an NSF Graduate Fellowship, with additional support from NSF grants DMR-0644743 and DMS-0968258.
References
1 G. Belfort, R. H. Davis and A. L. Zydney,J. Membr. Sci., 1994,96, 1–58.
2 C. A. Coulomb,Memoires de Mathematique et de Physique, 1776, 7, 343–382.
3 P. Bak, C. Tang and K. Wiesenfeld,Phys. Rev. Lett., 1987,59, 381– 384.
4 V. Frette, K. Christensen, A. Malthe-Sørenssen, J. Feder, T. Jøssang and P. Meakin,Nature, 1996,379, 49–52.
5 A. Abate, H. Katsuragi and D. Durian, Phys. Rev. E: Stat., Nonlinear, Soft Matter Phys., 2007,76, 061301.
6 J. Geng, E. Longhi, R. Behringer and D. Howell,Phys. Rev. E: Stat., Nonlinear, Soft Matter Phys., 2001,64, 060301.
7 C. Liu, S. Nagel, D. Schecter and S. Coppersmith,Science, 1995,269, 513–515.
8 L. Staron, J.-P. Vilotte and F. Radjai,Phys. Rev. Lett., 2002,89, 204302.
9 O. Dauchot, D. J. Durian and M. van Hecke, Dynamical Heterogeneities in Glasses, Colloids, and Granular Media, Oxford University Press, 2010.
10 H. Katsuragi, A. Abate and D. Durian,Soft Matter, 2010,6, 3023. 11 K. Nordstrom, J. Gollub and D. Durian, Phys. Rev. E: Stat.,
Nonlinear, Soft Matter Phys., 2011,84, 021403.
12 O. Ramos, E. Altshuler and K. Maløy,Phys. Rev. Lett., 2009,102, 078701.
13 F. Boyer, E. Guazzelli and O. Pouliquen,Phys. Rev. Lett., 2011,107, 188301.
Downloaded by North Carolina State University on 30 October 2012
14 C. Cassar, M. Nicolas and O. Pouliquen, Phys. Fluids, 2005, 17, 103301.
15 GDR MiDi,Eur. Phys. J. E: Soft Matter Biol. Phys., 2004,14, 341– 365.
16 C. A. Murray and R. A. Wenk,Phys. Rev. Lett., 1989,62, 1643–1646. 17 C. R. Nugent, K. V. Edmond, H. N. Patel and E. R. Weeks,Phys.
Rev. Lett., 2007,99, 025702.
18 A. H. Marcus and S. A. Rice,Phys. Rev. E: Stat., Nonlinear, Soft Matter Phys., 1997,55, 637–656.
19 K. Zahn, R. Lenke and G. Maret,Phys. Rev. Lett., 1999,82, 2721– 2724.
20 B. Pansu, P. Pieranski and L. Strzelecki,J. Phys., 1983,44, 531–536. 21 D. G. Grier and C. A. Murray,J. Chem. Phys., 1994,100, 9088. 22 R. Bubeck, C. Bechinger, S. Neser and P. Leiderer,Phys. Rev. Lett.,
1999,82, 3364–3367.
23 J. Olafsen and J. Urbach,Phys. Rev. Lett., 1998,81, 4369–4372. 24 P. Pusey and W. Van Megen,Nature, 1986,320, 340–342.
25 K. Davis, W. Russel and W. Glantschnig,Science, 1989,245, 507– 510.
26 B. J. Ackerson and N. A. Clark,Phys. Rev. Lett., 1981,46, 123–126. 27 M. O. Robbins and J. F. Belak,Phys. Rev. Lett., 1991,66, 3004–3007. 28 A. Yethiraj,Soft Matter, 2007,3, 1099.
29 D. W. Inglis, R. Riehn, R. H. Austin and J. C. Sturm,Appl. Phys. Lett., 2004,85, 5093.
30 D. W. Inglis,Biomicrofluidics, 2010,4, 026504.
31 N. Darnton,et al.,J. Phys.: Condens. Matter, 2001,13, 4891–4902. 32 J. Crocker and D. Grier,J. Colloid Interface Sci., 1996,179, 298–310.
33 D. Blair, and E. Dufresne, The Matlab Particle Code Repository. http://physics.georgetown.edu/matlab/.
34 W. B. Russel, D. A. Saville and W. R. Schowalter, Colloidal Dispersions, Cambridge University Press, 1992, p. 525.
35 L. R. Huang, E. C. Cox, R. H. Austin and J. C. Sturm,Science, 2004,
304, 987–990.
36 P.-A. Lemieux and D. Durian,Phys. Rev. Lett., 2000,85, 4273–4276. 37 P.-E. Peyneau and J.-N. Roux,Phys. Rev. E: Stat., Nonlinear, Soft
Matter Phys., 2008,78, 011307.
38 R. Lespiat, S. Cohen-Addad and R. H€ohler,Phys. Rev. Lett., 2011,
106, 148302.
39 C. Ancey,J. Rheol., 2001,45, 1421.
40 E. R. Weeks, J. C. Cocker, A. C. Levitt, A. Schofield and D. Weitz, Science, 2000,287, 627–631.
41 M. C. Porter,Ind. Eng. Chem. Prod. Res. Dev., 1972,11, 234–248. 42 L. Song and M. Elimelech,J. Chem. Soc., Faraday Trans., 1995,91,
3389–3398.
43 D. Leighton and A. Acrivos,J. Fluid Mech., 1987,177, 109. 44 A. Acrivos, G. Batchelor, E. Hinch, D. Koch and R. Mauri,J. Fluid
Mech., 1992,240, 651–657.
45 L. Isa, R. Besseling, A. Morozov and W. Poon,Phys. Rev. Lett., 2009,
102, 058302.
46 A. J. Liu and S. R. Nagel,Annu. Rev. Condens. Matter Phys., 2010,1, 347–369.
47 M. van Hecke,J. Phys.: Condens. Matter, 2010,22, 33101. 48 V. Trappe, V. Prasad, L. Cipelletti, P. N. Segre and D. A. Weitz,
Nature, 2001,411, 772–775.
Downloaded by North Carolina State University on 30 October 2012