Improving TCP Performance in Buffer-bloated Cellular
Networks via Dynamic Receive Window Adjustment
ABSTRACT
As smart phones and tablets become more and more pop-ular, TCP performance over cellular networks is of grow-ing importance for today’s Internet. However, our extensive measurements over 3G/4G networks of four major U.S. car-riers and the largest carrier in Korea reveal that TCP may suffer from extremely long delay and sub-optimal through-put. From the measurements, an important problem of TCP in cellular networks is observed: the current cellular net-works are over-buffered and the huge buffers nullify loss-based TCP congestion control, resulting in excessive growth of congestion window. To mitigate the problem, smart phone vendors rely on an ad-hoc solution that sets the maximum receive buffer size to a relatively small constant value than its actual size. Although this simple scheme alleviates the problem, it is sub-optimal in a number of scenarios due to its static nature. In this paper, we propose dynamic receive window adjustment (DRWA) and implement it in Android phones. DRWA only requires modifications on smart phones and is immediately deployable. Our extensive real-world tests confirm that DRWA reduces the average delay of TCP by 24.09∼48.97% in general scenarios and achieves up to 51.06% throughput improvement in specific scenarios.
Categories and Subject Descriptors
C.2.2 [Computer-Communication Networks]: Network Protocols
General Terms
Design, Measurement, Performance
Keywords
TCP, Cellular networks, Bufferbloat, Receive window ad-justment
1.
INTRODUCTION
TCP is the dominant transport layer protocol of the cur-rent Internet, carrying around 90% of the total traffic [13,18]. Hence, the performance of TCP is of utmost importance to the well-being of the Internet and has direct impacts on user experience. Although TCP is well-studied in traditional net-works, its performance over cellular networks has not been given adequate attention.
Conventional Networks
e.g., WiFi, Wired Networks
Server
Smart Device
Cellular Networks
e.g., 3G, 4G
Laptop
Figure 1: Over-buffering has been widely observed in the current Internet [9] but is especially severe in cellular networks, resulting in up to several seconds of end-to-end delay.
According to our measurements, TCP has a number of performance issues in this relatively new environment, in-cluding extremely long delay and sub-optimal throughput in certain scenarios. The reasons behind such performance degradations are two-fold. First, most of the widely de-ployed TCP implementations use loss-based congestion con-trol where the sender will not slow down its sending rate until it sees packet loss. Second, most cellular networks are over-buffered to accommodate bursty traffic and chan-nel variability [9, 15] as depicted in Figure 1. The huge buffer along with link layer retransmission conceals packet losses in cellular networks from TCP senders. The combina-tion of these two facts leads to the following phenomenon: the TCP sender keeps increasing its sending rate to probe the available bandwidth along the path. Even if it has al-ready reached the bottleneck link capacity, the congestion window will continue to grow since all the overshot pack-ets are absorbed by the buffers and all the packpack-ets corrupted over the wireless links are recovered by link layer retrans-mission. This results in a long queue in the cellular network system and up to several seconds of end-to-end delay.
it is sub-optimal in many scenarios, especially considering the dynamic nature of the wireless mobile environments. In high speed long distance networks (e.g., downloading from an oversea server over 4G LTE (Long Term Evolution) net-work), the static value is too small to saturate the link and re-sults in severe throughput degradation. In small bandwidth-delay product (BDP) networks, the static value is too large and the flows in a smart phone experience excessively long RTT.
In this paper, we propose a practical, receiver-based rem-edy to this issue called dynamic receive window adjustment (DRWA) . DRWA runs only on the receiver side (i.e., smart phone) and continuously adjusts the receiver window to be proper instead of reporting a static value. DRWA aims to keep the buffer at the bottleneck link (i.e., cellular link) non-empty while avoiding unnecessarily long queue. We achieve
this goal by letting DRWA enforce RTT to stay aroundλ∗
RT Tmin whereλis our control parameter. Our extensive
experiments over various cellular networks of different
car-riers reveal thatλ = 3keeps RTT 24.09∼48.97% lower
than the current TCP implementations in smart phones while throughput is guaranteed to be the same in general cases and upto 51.06% higher in a large BDP network.
Our proposal is similar in spirit to delay-based conges-tion control algorithms but does not require modificaconges-tions on large-scale servers (i.e., TCP senders). It is fully compat-ible with existing TCP protocol and can be easily deployed. Carriers or device manufacturers can simply issue an OTA (over the air) update to the smart phones’ protocol stack so that these devices could immediately enjoy enhanced perfor-mance when interacting with existing servers.
In summary, the key contributions of this paper include:
• We report extensive observations of TCP’s behavior in a range of different cellular networks and point out its negative impacts on user experience.
• We anatomize the TCP implementation in state-of-the-art smstate-of-the-art phones and locate the root cause of its perfor-mance issue in cellular networks.
• We propose a simple and backward-compatible
rem-edy that is experimentally proven to be safe and effec-tive. It provides substantial fixes to TCP performance issues and is immediately deployable.
The rest of the paper is organized as follows. In Section 2, we provide detailed observations of TCP’s abnormal behav-ior over various cellular networks. In Section 3, we anato-mize the root cause of such behavior and identify potential limitations of current TCP implementation in smart phones. Then, we suggest a simple remedy DRWA in Section 4 and extensively show its experimental performance in compari-son with the current implementation in Section 5. We con-clude our work in Section 6.
2.
OBSERVATIONS
In the past few decades, TCP has been well-studied in traditional networks, especially wired networks. With the
0 10 20 30 40 50 60
0 100 200 300 400
Time (second)
Congestion Window Size (KBytes)
AT&T HSPA+ T−Mobile HSPA+ Verizon EVDO Sprint EVDO Verizon LTE
Korean SKTele. HSPA+ WiFi
(a) Abnormality exists across different cellular networks (tested with Android phones)
0 10 20 30 40 50 60
0 100 200 300 400 500 600
Time (second)
Congestion Window Size (KBytes)
WindowsPC MacBook iPhone Android Phone
(b) Abnormality exists across different platforms (tested over AT&T HSPA+ network)
Figure 2: Abnormal TCP behavior in cellular networks: in this test, clients of different platforms download a large file from a university server over various cellular networks. The TCP congestion window (cwnd) is moni-tored on the server side using Web100 project [16].
exponential growth of hand-held devices like smart phones and tablet computers, TCP performance in cellular networks is becoming more and more important. Unfortunately, TCP performance of smart mobile devices over cellular networks is still lack of deep investigation though there exist a num-ber of measurement work for different types of cellular net-works [4, 12, 14, 15]. During our extensive real-world TCP performance measurements over various cellular networks, we found that the current TCP implementation shows ab-normal behaviors in cellular networks and has a number of performance issues including extremely long delay and sub-optimal throughput.
Figure 2 depicts the TCP congestion window measured from a Linux server when clients of different platforms (An-droid phone, iPhone, Windows PC, Macbook) download a large file from it over various cellular networks. The server uses CUBIC [10] as the TCP congestion control algorithm. The cellular networks we have tested include the four ma-jor U.S. carriers’ 3G networks, Verizon’s 4G LTE network and Korean SKTelecom’s HSPA+ network. As a reference, we also plot TCP’s behavior in WiFi networks under similar conditions.
Samsung Galaxy S2 (AT&T) HTC EVO Shift (Sprint) Samsung Droid Charge (Verizon) LG G2x (T-Mobile)
Wi-Fi 110208 110208 393216 393216
UMTS 110208 393216 196608 110208
EDGE 35040 393216 35040 35040
GPRS 11680 393216 11680 11680
HSPA+ 262144 N/A N/A 262144
WiMAX N/A 524288 N/A N/A
LTE N/A N/A 484848 N/A
Default 110208 110208 484848 110208
Table 1: Maximum TCP receive buffer size (tcp rmem max) in bytes on different Android phones for different carriers. Note that these values may vary on customized ROMs and can be looked up by looking for ”setprop net.tcp.buffersize.*” in the init.rc file of Android phones. Also note that different values are set for different carriers even if the network types are the same. We guess that these values are experimentally determined based on each carrier’s network conditions and configurations.
As shown in Figure 2, TCP congestion window over cel-lular networks does not show its conventional sawtooth be-havior while WiFi networks show that bebe-havior clearly. The TCP congestion window over cellular networks grows to a static value and stays there until the session ends. Through our extensive testing, this strange behavior, which we call “TCP congestion control collapse”, turns out to be universal in cellular networks. It exists in the 3G networks of all four major cellular network carriers in the US. It also exists in 4G LTE networks. We further confirmed that the same ab-normal TCP behavior is observed in the largest cellular net-work carrier in Korea. Moreover, this problem is observed across Android phones, iPhones as well as computers run-ning Windows 7 or Mac OS X Lion. This abnormal phe-nomenon caught our attention and revealed an untold story of TCP over cellular networks. We became interested in the reasons behind this behavior and its impact on user experi-ence.
2.2
Understanding the Problem
To understand the behavior of TCP over cellular networks, we focused on why the congestion window stays at a static value. The static congestion window first indicates that no packet loss is observed by the TCP sender (otherwise the congestion window should have decreased multiplicatively at any loss event). In a large scale real world measurement [12], it is shown that cellular networks typically experience packet loss rates close to zero. This no-packet-loss phe-nomenon can be explained by the large buffers existent in cellular base stations or middleboxes as well as the link layer retransmission mechanisms prevalent in cellular networks: most of the current 3G networks as well as the forthcoming 4G networks are over-buffered (or buffer-bloated as termed by [9]). These excessive buffers were originally introduced into cellular networks due to a number of reasons. First, the channel status of cellular links fluctuates quickly and the corresponding channel rate varies from dozens of Kbps to tens of Mbps. Second, the data traffic over such links is highly bursty. To absorb such bursty traffic over such a vari-able channel, the simple yet effective approach adopted by current cellular networks is to provide large buffers. These buffers smooth the bursty traffic and reduce the packet loss rate in cellular networks. Further, due to the relatively high
bit error rate over the wireless channel, link layer retransmis-sion is typically performed in cellular networks, which also requires large buffers in the routers or base stations to store the unacknowledged packets.
Providing large buffers seems to be a viable solution at Layer 2, but it has an undesirable interaction with the TCP congestion control at Layer 4. TCP mostly relies on packet loss to detect network congestion. Although other variants such as delay-based congestion control exist, most of the widely deployed TCP implementations (e.g., Newreno [7], BIC [21], CUBIC [10]) still use loss-based congestion con-trol [22]. Excessive buffers in cellular networks prevent packet losses from happening even if TCP’s sending rate far ex-ceeds the bottleneck link capacity. This “hides” the network congestion from the TCP sender and makes its congestion control algorithm malfunction.
If packet losses are perfectly concealed, the congestion window may not drop but it should persistently grow up. However, it strangely stops at a certain value and this static value is different for each cellular network or client platform. Our deep inspection to the TCP implementation in Android phones (since it is open-source) reveals that the value is de-termined by a parameter tcp rmem max that specifies the maximum receive window advertised by an Android phone. This gives an intuitive answer why the congestion window shows the flat behavior: the receive window (rwnd) adver-tised by the receiver crops the congestion windows (cwnd) in the sender. By inspecting various Android phone models, we found that tcp rmem max has diverse values for different types of networks as shown in Table 1. Generally speaking, larger values are assigned to faster communication standards (e.g., LTE).
To understand the impact of tcp rmem max, we show the TCP performance under various tcp rmem max settings for Verizon’s LTE and AT&T’s HSPA+ networks in Figure 3. Obviously, a larger tcp rmem max value allows the conges-tion window of the TCP sender to grow to a larger size and hence leads to higher throughput. But this throughput im-provement will flatten out once the link capacity is saturated. Further increase of tcp rmem max brings nothing but longer queuing delay.
65536 110208 262144 484848 524288 655360 0
5 10 15 20
TCP_rmem_max (Bytes)
Throughput (Mbps)
AT&T HSPA+ (default: 262144) Verizon LTE (default: 484848)
(a) Throughput Performance
65536 110208 262144 484848 524288 655360 0
200 400 600 800 1000 1200 1400
TCP_rmem_max (Bytes)
RTT (ms)
AT&T HSPA+ Verizon LTE
(b) RTT Performance
Figure 3: Throughput and RTT performance measured for a whole day when downloading from a local server over LTE and HSPA+ networks with various tcp rmem max values. For this test environment, 110208 may work better than the default 262144 in AT&T HSPA+ network. Similarly, 262144 may work better than the default 484848 in Verizon LTE network. However, the optimal value depends on the environment and is hard to set statically in advance.
between throughput and RTT in typical scenarios. However, despite the careful choice of the parameter values, the static nature of such parameter setting is doomed to be sub-optimal in certain cases. For instance, in the testing of Figure 3, the default value set by Verizon for its LTE network and AT&T for its HSPA+ network do not provide the best throughput and end-to-end latency. The downlink traffic is from a lo-cal university server in U.S. In this case, the end-to-end la-tency is relatively small and the resulted pipe size (i.e., BDP) is small. This default values for both LTE and HSPA+ are large enough to achieve full bandwidth utilization as shown in Figure 3(a). However, the default value triggers excessive packets in network and thus resulting in unnecessarily larger RTT as shown in Figure 3(b). This demonstrates the fun-damental limitations of the static parameter setting: it man-dates one specific trade-off point in the system which may be sub-optimal for other applications. Two realistic scenar-ios where the current implementation may hurt user experi-ences are discussed below.
2.3
Impact on User Experience
Web Browsing with Background Downloads: Top lines
of smart phones scheduled to be launched during 2012 are mostly with a quad core CPU of about 1.5GHz per core, more than 1GB RAM, and a high resolution screen (e.g., 1280×720 pixels). Due to their drastically improved ca-pability, the phones are expected to perform multi-tasking more often. For instances, people will enjoy web brows-ing or online gambrows-ing while downloadbrows-ing files such as books, musics, movies or applications from on-line markets in the background. In such cases, we found that the current TCP implementation incurs long delays for the interactive flow (Web browsing or online gaming) since the buffer is filled with packets belonging to the background download flow.
Figure 4 shows that the Web object fetching time are severely degraded when background downloads are under way. Since Web objects are typically small in size (for instance, we use 8KB, 16KB, 32KB and 64KB in this test), their fetching time mainly depends on RTT rather than throughput. When
0 5 10 15
0 0.2 0.4 0.6 0.8 1
Web Object Fetching Time (s)
P(X
≤
x)
With background traffic (avg=2.65) Without background traffic (avg=1.02)
Figure 4: Web object fetching performance with and without background traffic. The time taken to fetch the same web objects becomes 2.6 times longer if a file down-load coexists. If TCP maintains a smaller queue in the network, the drastic performance degradation can be mitigated.
a background flow causes long queues to be built up at the base station, the Web objects will be severely delayed. As the figure shows, average Web object fetching time is 2.6 times longer with background download1.
Throughput from Servers with Long Latency: The
con-tents that smart phone users visit are diverse. Some concon-tents are well maintained and CDNs (content delivery networks) are assisting them to get “closer” to their customers via repli-cation. In such cases, the throughput performance can be well-supported by the static setting of tcp rmem max. How-ever, there are still many websites or files showing long la-tencies due to their remote locations, such as the most com-mon usage of smart phones: web browsing, market appli-cation download and streaming. In such cases, the static setting of tcp rmem max (which is tuned for moderate la-tency case) fails to provide the maximum possible through-put since it cannot fill the long fat pipe. Figure 5 shows that when downloading some contents from a server abroad, the client suffers from sub-optimal throughput performance un-der the default setting. A larger tcp rmem max can achieve
1Note that the fetching times of multiple small objects in parallel
65536 262144 484848 655360 917504 1179648 1310720 0
2 4 6 8 10
TCP_rmem_max (Bytes)
Throughput (Mbps)
AT&T HSPA+ (default: 262144) Verizon LTE (default: 484848)
(a) Throughput Performance
65536 262144 484848 655360 917504 1179648 1310720 0
200 400 600 800 1000
TCP_rmem_max (Bytes)
RTT (ms)
AT&T HSPA+ Verizon LTE
(b) RTT Performance
Figure 5: Throughput and RTT performance measured for a whole day when downloading from a remote server in Korea via LTE and HSPA+ networks with various tcp rmem max values. The static setting results in sub-optimal throughput performance since it fails to probe maximum available bandwidth of the long fat pipe. 655360 for AT&T and 917504 for Verizon provided much higher throughput than their default values.
higher throughput, but if it is too large, packet loss will even-tually happen in which case throughput degradation will oc-cur as well.
3.
ANATOMY OF TCP BEHAVIOR IN
CEL-LULAR NETWORKS
In this section, we elaborate the details of the current TCP implementation in Android phones, especially the receive window adjustment algorithm and investigate the potential limitations of the current implementation. Inspired by the limitations, we suggest several possible solutions and dis-cuss their advantages and disadvantages.
3.1
Details of Current Implementation
We use Android phones to look into the implementation detail of the receive window adjustment algorithm due to the closed nature of other platforms (e.g., iPhone). We are unable to pinpoint the exact implementations of such closed platforms, but testing results shown earlier suggest that they exhibit similar behaviors. This observation imply that the underlying implementation may be very similar even in the closed platforms.
TCP receive window was originally designed to prevent a fast sender from overwhelming a slow receiver with lim-ited buffer space. It reflects the available buffer size on the receiver side so that the sender will not send more packets than the receiver can accommodate. The combination of this flow control and TCP congestion control ensures that neither the receiver nor any intermediate router along the path will be overloaded.
With the advancement in storage technology, memories are becoming cheaper and cheaper. Nowadays, it is not un-common to find a computer equipped with several gigabytes of memory and even smart phones are now equipped with 1GB of RAM (e.g. Motorola Droid Razr, Samsung Galaxy S2). Hence, buffer space on the receiver side is hardly the bottleneck in the current Internet. To improve TCP through-put, a receive buffer auto-tuning technique called Dynamic
Algorithm 1 DRS
Initialization:
rwnd←0;
RTT Estimation:
RT Test←the time between when a byte is first acknowl-edged and the receipt of data that is at least one window beyond the sequence number that was acknowledged;
Dynamic Right-Sizing:
if data is copied to user space then
ifelapsed time < RT Testthen
return;
end if
cwndest←data rcvd;
rwnd←max{2∗cwndest, rwnd};
Advertiserwndas the receive window size;
end if
Algorithm 2 DRS with tcp rmem max clamping
Same as Algorithm 1 except adding:
rwnd←min{tcp rmem max, rwnd};
Right-Sizing (DRS [6]) was proposed and many operating systems (including Linux and hence Android) have adopted the same or similar scheme in their kernels. In DRS, instead of determining the receive window based on the available buffer size, the receive buffer is dynamically adjusted so as to suit the connection’s demand. The fundamental goal of DRS is to allocate enough buffer (as long as we can afford it) so that the throughput of the TCP connection is never limited by the receive window size but only constrained by network congestion. Meanwhile, DRS tries to avoid allocating more buffers than necessary.
receiver. By definition, RTT is the time between when data is sent and the corresponding acknowledgement is received. However, since the receiver typically has no data to send, it is hard to measure RTT on the receiver side. DRS emulates RTT by monitoring the time between when a packet is first acknowledged and the receipt of data that is at least one win-dow beyond the sequence number that was acknowledged. Although there is some deviation, this RTT measurement is proved to be good enough for the purpose as demonstrated by its wide deployment in the Internet.
Once the RTT is known, the current congestion window of the sender can be trivially estimated on the receiver side by counting the amount of data received within one RTT. Since TCP congestion window can at most double within an RTT (e.g., during slow start), DRS set the advertised receive window to be twice of the estimated congestion window so that the TCP sender is always congestion-window-limited rather than receive-window-limited. Further, since the TCP sender may be application-limited and have not fully used the congestion window, the data received in an RTT may be smaller than the actual window size. DRS therefore uses the largest received window advertised during any RTT by
the maxoperation in Algorithm 1. Note that this makes
adjustment of the receive window in DRS non-decreasing. It is acceptable because the sole goal of DRS is to set the congestion window “free” from the constraints of the receive window. It does not matter if the advertised receive window is a bit too large. Finally, the receive window is of course bound by the maximum receive buffer size.
Linux adopted a receive buffer auto-tuning scheme simi-lar to DRS since kernel 2.4.27. Since Android is based on Linux, it inherits the same receive window adjustment algo-rithm. Other major operating systems also implemented cer-tain kind of TCP buffer auto-tuning (Windows since Vista, Mac OS X since 10.5, FreeBSD since 7.0). This implies a significant role change of TCP receive window. Although the functionality of flow control is still preserved, most of the time the receive window is set to a value that lets TCP con-gestion control fully explore the available bandwidth while preventing the receiver from allocating unnecessarily large buffers to a connection.
Although DRS works fairly well in traditional networks and improves TCP throughput to a great extent, it actually incurs a vicious cycle in cellular networks. When the con-gestion window of the TCP sender increases, more packets are clocked out within an RTT and the receiver’s estima-tion of the congesestima-tion window also increases. Since DRS requires the receive window to keep in pace with the growth of the congestion window, the advertised window will be in-creased, leaving more space for the congestion window to grow. This ever increasing trend will lead to long queues being built up at the routers or base stations and result in extremely long RTT. The current solution adopted by many Android smart phone vendors to break this vicious cycle is to set a relatively small maximum receive buffer size via tcp rmem max in Algorithm 2. This static size is strategi-cally configured for each carrier’s different cellular networks
(GPRS, HSPA+, EVDO, LTE, etc.) so that the performance is tolerable in ordinary scenarios. As we know, the cellular networks are highly dynamic due to the nature of wireless channel as well as user mobility and diversity. The static setting will lead to sub-optimal performance in numerous scenarios which we will detail in the following section.
3.2
Limitations of Current Implementation
Long End-to-End Latency: On the other hand, in manycases where the static value of tcp rmem max may over-estimate the pipe size, the RTT will be unnecessarily long though the bandwidth can be fully utilized. The excessive packets make the network more congested and can severely degrade the performance of short-lived flows such as web browsing or online gaming because their performance are more dependent on RTT than throughput.
Throughput Degradation: RTT in cellular networks is
rel-atively long (up to several seconds) because of long dis-tance transmission (remote server), link layer latency (re-transmission and contention at L2) and congestion within the network (queuing delay along paths). Since the maxi-mum throughput of a TCP flow using Algorithm 2 becomes roughly tcp rmem max divided by RTT, the static setting of tcp rmem max may result in bandwidth under-utilization if RTT become larger than certain limit.
Expensive Recovery from Packet Loss: Although packet
loss is uncommon in cellular networks, once it happens the recovery may be very expensive. In particular, we found that in AT&T’s HSPA+ network the sender almost always resort to the expensive retransmission time-out (RTO) rather than fast retransmit to recover from packet losses. Accord-ing to [19], the reason may be the middleboxes hold all out-of-order packets until everything is in order so that it can conduct some deep packet inspection and then forward them to the downstream.
3.3
Candidate Solutions and Our Approach
To address TCP’s problem in buffer-bloated cellular net-works, there are a few possible solutions. One obvious so-lution is to reduce the buffer size in cellular networks so that TCP can function the same way as it does in wired net-works. However, as explained earlier these extra buffers are essential to ensure the performance of cellular links under dynamic conditions and cannot be easily removed.
An alternative to this solution is to employ certain Active Queue Management (AQM) schemes like RED [8] or REM [2]. By randomly dropping or marking certain packets be-fore the buffer is full, we can notify TCP sender in advance and avoid the excessively long delay. However, despite be-ing studied extensively in the literature, few AQM schemes are actually deployed in the Internet due to the complexity of their parameter tuning, the extra packet losses introduced by them and the limited performance gains provided by them.
0 1 2 3 4 5 6 0
0.2 0.4 0.6 0.8 1
Throughput (Mbps)
P(X
≤
x)
TCP CUBIC (avg=3.34) TCP VEGAS (avg=1.03)
(a) Throughput
0 500 1000 1500
0 0.2 0.4 0.6 0.8 1
RTT (ms)
P(X
≤
x)
TCP CUBIC (avg=493) TCP VEGAS (avg=132)
(b) RTT
Figure 6: Throughput and RTT performance of TCP Vegas in cellular networks: although delay-based congestion control reduces the RTT, it suffers from throughput degradation.
0 10 20 30 40 50 60
0 200 400 600 800
Time (second)
Congestion Window Size (KBytes)
LinuxPC WindowsPhone
(a) CWND
0 10 20 30 40 50 60
0 500 1000 1500 2000
Time (second)
RTT (ms)
LinuxPC WindowsPhone
(b) RTT
Figure 7: TCP behaviors of a Linux PC and a Windows phone in cellular networks: They set tcp rmem max to a very large value. Their TCP exhibits the usual saw-tooth behavior, but this results in excessively long RTT in bufferbloated cellular networks.
RTT starts to increase rather than waiting until packet loss happens, they may serve the over-buffered cellular networks better than loss-based congestion control. However, as Fig-ure 6 shows, although delay-based TCP congestion control decreases RTT to a great extent, they suffer from throughput degradation. This agrees with the observation over a cellular network in [15]. Further, adopting delay-based congestion control requires modifications on the sender side (typically large-scale servers) which may incur considerable deploy-ment cost and affect both wired and wireless users.
In light of the problems with the above-mentioned solu-tions, we suggest to handle the problem on the receiver side by changing the static setting of tcp rmem max. That is be-cause receiver (mobile device) side modification has mini-mum deployment cost. Vendors may simply issue an OTA update to the protocol stack of the mobile devices so that they can enjoy a better TCP performance without affecting other wired users. It is a light-weight, effective and immedi-ately deployable solution to the problem.
To change the static limit imposed on the sender’s con-gestion window, one may simply remove the tcp rmem max parameter or set it to a very large value so that congestion window is free to grow (and drop). This will bring back the sawtooth behavior of TCP but will incur extremely long RTT due to the bufferbloat in cellular networks. As shown in Figure 7, Windows Phone (Samsung Focus) and Linux PC work in this way. Unfortunately, this type of solution leads
to even longer RTT and potential throughput degradation. Therefore, we need a dynamic receive window adjustment (DRWA) algorithm to ensure full utilization of the available bandwidth while maintaining RTT small.
4.
DYNAMIC RECEIVE WINDOW
ADJUST-MENT (DRWA)
4.1
Algorithm
The aim of DRWA is to adaptively set the receive win-dow to a proper size in different environment. Sometimes, it should be larger than the current static limit to get more throughput and sometimes it should become smaller than the current value to avoid unnecessary queues in the link. The challenges in this work lie in three parts. First, DRWA should remove the static setting of a relatively small max-imum receive buffer size. Second, DRWA should bear the capability to estimate the proper pipe size of a link via a new window adjustment algorithm. Finally, DRWA should be compatible with the current TCP protocol and easy to de-ploy.
Algorithm 3 DRWA
Initialization:
RT Tmin← ∞;
cwndest←data rcvdin the firstRT Test;
rwnd←0;
RTT and Minimum RTT Estimation:
RT Test←the time between when a byte is first acknowl-edged and the receipt of data that is at least one window beyond the sequence number that was acknowledged;
if TCP timestamp option is available then
RT Test ←averaging the RTT samples obtained from
the timestamps within the last RTT;
end if
ifRT Test< RT Tminthen
RT Tmin←RT Test;
end if
DRWA:
if data is copied to user space then
ifelapsed time < RT Testthen
return;
end if
cwndest←α∗cwndest+ (1−α)∗data rcvd;
rwnd←λ∗ RT Tmin
RT Test ∗cwndest;
Advertiserwndas the receive window size;
end if
needs to keep the queue size proper as necessary but non-empty always. Algorithm 3 gives the details.
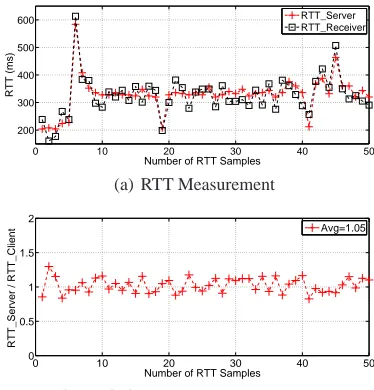
DRWA uses the same technique as DRS to measure RTT on the receiver side if TCP timestamp option is unavailable. However if TCP timestamp option is available, DRWA uses it to obtain a more accurate estimation of the RTT (Times-tamps can provide multiple RTT samples within an RTT whereas the traditional DRS way provides only one sam-ple per RTT). We surveyed the support for TCP timestamp option in Windows Server and Linux (Table 2) and found that when DRWA runs on Android phones, it could turn on timestamp no matter it talks to a Linux server or a Win-dows server. With assistance of timestamps, DRWA is able to achieve robust RTT measurement on receiver side and thus conquering the well-known battle of accurately mea-suring RTT in dynamic networks, as shown in Figure 8. In addition to RTT measurement, DRWA also records the minimum RTT ever seen in this connection and use it later to determine the receive window size. Since the minimum RTT approximates the round-trip propagation delay between the two hosts when no queue is built up in the intermediate routers especially in the cellular base station, we use it as an indication on what the network and channel conditions are.
After knowing the RTT, DRWA counts the amount of data received within one RTT in the same way as DRS. However, DRWA further smooths the estimated congestion window by
Server Client Timestamp Option Linux Linux (Android) Enabled Windows Linux (Android) Enabled Linux Windows Disabled Windows Windows Disabled
Table 2: Support for TCP timestamp option on Linux and Windows: both Linux and Windows support TCP timestamp and Linux clients turn it on by default when initiating a connection while Windows clients do not. Therefore, Android phones can use timestamp no mat-ter they talk to Linux or Windows servers.
0 10 20 30 40 50
200 300 400 500 600
Number of RTT Samples
RTT (ms)
RTT_Server RTT_Receiver
(a) RTT Measurement
0 10 20 30 40 50
0 0.5 1 1.5 2
Number of RTT Samples
RTT_Server / RTT_Client
Avg=1.05
(b) Ratio between RTT measurements
Figure 8: With timestamp option, DRWA is able to achieve robust RTT measurement on the client side. The testing was conducted over AT&T HSPA+ network by using Samsung Galaxy S2 phone. We print the RTT val-ues to kernel message on the client side and use Web100 to monitor RTT value on server side. The two RTT mea-surements are consistent though there exists minor devi-ation.
using a moving average with a low-pass filter (α is set to 7/8 in our current implementation). This smoothed value is used to determine the receive window we advertise. In
con-trast to DRS who always setsrwndto2∗cwndest, DRWA
sets it toλ∗ RT Tmin
RT Test ∗cwndest. WhenRT Testis close to
RT Tmin, implying the network is not congested,rwndwill increase quickly to give the sender enough space to probe the available bandwidth. AsRT Testincrease, we gradually
slow down the increment rate of rwnd to stop TCP from
overshooting. The operation of taking the maximum of the
newly calculatedrwnd and the previousrwndin DRS is
also removed so that DRWA makes bidirectional adjustment of the advertised window and controls theRT Test to stay aroundλ∗RT Tmin. More detailed explanation ofλwill be given in the following section.
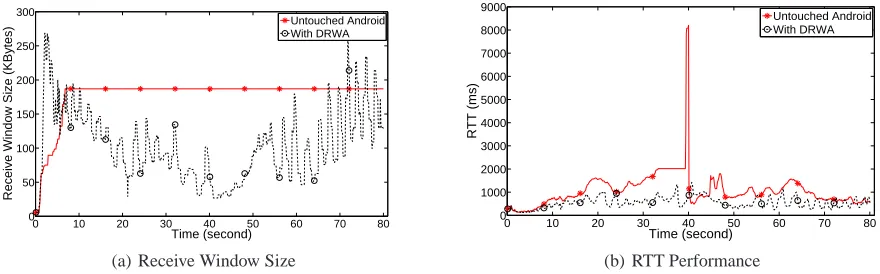
0 10 20 30 40 50 60 70 80 0
50 100 150 200 250 300
Time (second)
Receive Window Size (KBytes)
Untouched Android With DRWA
(a) Receive Window Size
0 10 20 30 40 50 60 70 80
0 1000 2000 3000 4000 5000 6000 7000 8000 9000
Time (second)
RTT (ms)
Untouched Android With DRWA
(b) RTT Performance
Figure 9: TCP behavior comparison between untouched Android phones and phones with DRWA: in this test the phones are moved from an area with good signal to an area with weak signal and then moved back again. In contrast to the static setting of the receive window in untouched Android phones, DRWA nicely tracks the variation of the channel conditions and dynamically adjusts the receive window. Due to the dynamic adjustment, DRWA is able to keep the RTT constantly low while the untouched Android phone experiences drastic increase in RTT under weak signal.
AT&T HSPA+ Verizon LTE Verizon EVDO Sprint EVDO SKTel. HSPA+ 0
2 4 6 8 10 12
Throughput (Mbps)
λ = 2
λ = 3
λ = 4
(a) Throughput Performance
AT&T HSPA+ Verizon LTE Verizon EVDO Sprint EVDO SKTel. HSPA+ 0
100 200 300 400 500 600
RTT (ms)
λ = 2
λ = 3
λ = 4
(b) RTT Performance
Figure 10: Impact ofλon the throughput and RTT performance of TCP with DRWA in different cellular networks.
λ = 3 gives a good balance between throughput and RTT in four major U.S carriers as well as the largest Korean carrier.
TCP congestion window by advertising an adaptiverwnd,
the bandwidth probing responsibility still lies with the TCP congestion control algorithm at the sender. Therefore, typ-ical throughput loss seen from using delay-based TCP will not appear. Also, due to some unique characteristics of cellu-lar networks, RTT based control can work more effectively. In wired networks, a router may handle hundreds of TCP flows at the same time and they may share the same output buffer. That makes RTT measurement more noisy and delay-based congestion control less reliable. However, in cellular networks, a base station typically has separate buffer space for each user and a mobile user is unlikely to have many simultaneous TCP connections. This makes RTT measure-ment a more reliable signal for network congestion.
4.2
Adaptive Nature of DRWA
DRWA allows a TCP receiver to report a proper receive window size to its sender in every RTT rather than adver-tising a static limit. Due to its adaptive nature, DRWA is able to track the variability of channel conditions. Figure 9
shows the evolution of the receive window size and the cor-responding RTT performance. During this test, we moved the Android phone from a good signal area to a weak signal area (from 0 second to 40 second) and then returned back to the good signal area (from 40 second to 80 second). As shown in Figure 9(a), the receive window size dynamically adjusted by DRWA well demonstrates the signal change in-curred by the movement. This leads to a steadily low RTT while the static setting of untouched Android results in an ever increasing RTT as the signal strength decreases and the RTT blows up in the area of the weakest signal strength.
4.3
Impact of
λon TCP Performance
λ is a key parameter in DRWA. It tunes the operation
region of the algorithm and reflects the trade-off between
throughput and delay. Note that when RT Test/RT Tmin
equals to λ, the advertised receive window will be equal to its previous value, leading to a steady state. Therefore, λreflects the target RTT of DRWA. If we setλto 1, that
0 2 4 6 8 10 12 0
0.2 0.4 0.6 0.8 1
Web Object Fetching Time (s)
P(X
≤
x)
Untouched Android HSPA+ (avg=3.56) With DRWA HSPA+ (avg=2.16)
(a) Web page fetching time
0 200 400 600 800 1000 1200 1400 1600
0 0.2 0.4 0.6 0.8 1
RTT (ms)
P(X
≤
x)
Untouched Android HSPA+ (avg=523.39) With DRWA HSPA+ (avg=305.06)
(b) RTT experienced by the Web browsing TCP flow
Figure 11: Web browsing with background download over AT&T HSPA+: DRWA reduces the RTT experienced by the TCP flows and hence improves Web browsing performance.
0 2 4 6 8 10 12
0 0.2 0.4 0.6 0.8 1
Throughput (Mbps)
P(X
≤
x)
Untouched Android HSPA+ (avg=3.36) With DRWA HSPA+ (avg=4.14) Untouched Android LTE (avg=7.84) With DRWA LTE (avg=10.22)
Figure 12: Throughput improvement brought by DRWA when clients in U.S. download from a server in Korea: Each test lasts for 24 hours. The improvement ratios are 23.21% in AT&T HSPA+ network and 30.36% in Veri-zon LTE network.
no queue is built up. This ideal case only guarantees high throughput if 1) the traffic has constant bit rate, 2) the avail-able bandwidth is also constant and 3) the constant bit rate equals to the constant bandwidth. In practice, Internet traffic is bursty and the channel condition varies over time. Both necessitate the existence of some buffers to absorb the tem-porarily excessive traffic and drain the queue later on when the load becomes lighter or the channel condition becomes better. Otherwise, we cannot fully utilize the link. λ deter-mines how aggressive we want to be to keep the link busy
and how much delay penalty we can tolerate. The largerλ
is, the more aggressive the algorithm is. It will guarantee the throughput of TCP to be saturated all the time but at the same time introduce extra delay. Figure 10 gives the com-parison of performance among different values ofλ. This test combines multiple scenarios ranging from local to re-mote access, good to weak signal. Each has been repeated for over 400 times over the span of 24 hours so as to find the optimal parameter setting. In our current implementa-tion, we setλto 3 which works very well for most cellular networks. However, a better approach may exist, which may make this parameter adaptive. We leave this as our future work.
4.4
Improvement in User Experiences
(a) Experiment Architecture
Samsung Galaxy S2
LG G2x
HTC EVO Shift Samsung
Droid Charge
iPhone
(b) Experiment Phones
Figure 13: Our test environment: We have TCP servers in U.S. and Korea and pairs of smart phones for major cellular carriers.
deter-265ms 347ms 451ms 570ms 677ms 0
1 2 3 4 5
End−to−End Latency of Ping(ms)
Throughput (Mbps)
Untouched Android With DRWA
(a) Comparison in AT&T HSPA+
326ms 433ms 550ms 653ms 798ms 0
0.2 0.4 0.6 0.8 1 1.2 1.4
End−to−End Latency of Ping(ms)
Throughput (Mbps)
Untouched Android With DRWA
(b) Comparison in Verizon EVDO
312ms 448ms 536ms 625ms 754ms 0
0.2 0.4 0.6 0.8 1 1.2 1.4
End−to−End Latency of Ping(ms)
Throughput (Mbps)
Untouched Android With DRWA
(c) Comparison in Sprint EVDO
131ms 219ms 351ms 439ms 533ms 0
5 10 15 20
End−to−End Latency of Ping(ms)
Throughput (Mbps)
Untouched Android With DRWA
(d) Comparison in Verizon LTE
Figure 14: Throughput improvement provided by DRWA for various cellular networks under different network laten-cies: we see significant throughput improvement when the end-to-end latency is long.
265 ms 347 ms 451 ms 570 ms 677 ms AT&T HSPA+ -1.09% 0.12% 5.65% 25.78% 40.77% 326 ms 433 ms 550 ms 653 ms 798 ms Verizon EVDO -2.85% -0.31% 3.58% 28.65% 50.51% 312 ms 448 ms 536 ms 625 ms 754 ms Sprint EVDO 3.54% 5.19% 37.39% 44.62% 51.06% 131 ms 219 ms 351 ms 439 ms 533 ms Verizon LTE -1.27% 38.67% 37.08% 25.64% 30.62%
Table 3: Throughput improvement shown in Figure 14 for difference latency values over various cellular net-work: as the end-to-end latency increases, the through-put improvement ratio becomes higher.
mined by the RTT.
Figure 12 shows the scenario where a mobile user in U.S. downloads from a remote server in Korea. Since the RTT is very long in this scenario, the BDP of the underlying net-work is fairly large. The static setting of tcp rmem max is too small to fill the long, fat pipe and results in through-put degradation. With DRWA, we are able to fully utilize the available bandwidth and achieve 23-30% improvement in throughput.
5.
EXTENSIVE EXPERIMENTS
5.1
Test Environment
We implemented DRWA in Android phones by patching their kernels. It turned out to be fairly simple to implement DRWA in the Linux/Android kernel. It takes merely around 100 lines of code. We downloaded the original kernel source
codes of different Android models from their manufacturers’ website, patched the kernels with DRWA and recompiled them. Finally, the phones were flashed with our customized kernel images. We provided a procfs entry for users to easily turn on or off DRWA.
We did head-to-head comparisons between untouched An-droid phones and AnAn-droid phones with DRWA. Figure 13 gives an overview of our test environment. We have both clients and servers in two places: a university in U.S. and a university in Korea. We evaluate different scenarios where clients download files from nearby servers or remote servers over various cellular networks operated by different carriers. All our servers run Ubuntu 10.04 (with 2.6.35.13 kernel) and use the default TCP congestion control algorithm, CUBIC [10]. The settings of the smart phones used as clients vary depending on the carriers and their networks (see Table 1). The signal strength during out tests is between -75dBm and -87dBm (typically considered as good signal condition in daily life) unless otherwise noted. We developed a sim-ple Android application that downloads files from the des-ignated servers with different traffic patterns. Traces were collected on the server side using tcpdump [1] and analyzed using tcptrace [17]. Internal states of TCP (e.g.,cwnd) are probed with the help of Web100 project.
5.2
Throughput Improvement
0 5 10 15 20 0
0.2 0.4 0.6 0.8 1
Throughput (Mbps)
P(X
≤
x)
Untouched Android HSPA+ (avg=3.83) With DRWA HSPA+ (avg=3.79) Untouched Android LTE (avg=15.78) With DRWA LTE (avg=15.43)
(a) Throughput: Verizon LTE and AT&T HSPA+
0 200 400 600 800 1000
0 0.2 0.4 0.6 0.8 1
RTT (ms)
P(X
≤
x)
Untouched Android HSPA+ (avg=435.37) With DRWA HSPA+ (avg=222.14) Untouched Android LTE (avg=150.78) With DRWA LTE (avg=97.39)
(b) RTT: Verizon LTE and AT&T HSPA+
0 0.5 1 1.5 2
0 0.2 0.4 0.6 0.8 1
Throughput (Mbps)
P(X
≤
x)
Untouched Android V.EVDO (avg=0.91) With DRWA V.EVDO (avg=0.92) Untouched Android S.EVDO (avg=0.87) With DRWA S.EVDO (avg=0.85)
(c) Throughput: Verizon EVDO and Sprint EVDO
200 400 600 800 1000 1200 1400 0
0.2 0.4 0.6 0.8 1
RTT (ms)
P(X
≤
x)
Untouched Android V.EVDO (avg=701.67) With DRWA V.EVDO (avg=360.94) Untouched Android S.EVDO (avg=526.38) With DRWA S.EVDO (avg=399.59)
(d) RTT: Verizon EVDO and Sprint EVDO
Figure 15: RTT improvement in networks with small BDP: DRWA provides huge RTT reduction without throughput loss across different cellular networks. The RTT reduction ratios are 48.97%, 35.41%, 48.56% and 24.09% for AT&T HSPA+, Verizon LTE, Verizon EVDO and Sprint EVDO networks respectively.
0 1 2 3 4 5 6 7 8 9
0 0.2 0.4 0.6 0.8 1
Throughput (Mbps)
P(X
≤
x)
Untouched Android HSPA+ (avg=1.74) With DRWA HSPA+ (avg=1.75) Untouched Android LTE (avg=5.28) With DRWA LTE (avg=5.43)
(a) Throughput: Verizon LTE and AT&T HSPA+
0 500 1000 1500 2000 2500
0 0.2 0.4 0.6 0.8 1
RTT (ms)
P(X
≤
x)
Untouched Android HSPA+ (avg=828.87) With DRWA HSPA+ (avg=552.32) Untouched Android LTE (avg=227.12) With DRWA LTE (avg=147.41)
(b) RTT: Verizon LTE and AT&T HSPA+
Figure 16: We repeat the same tests shown in Figures 15(a) and 15(b) under weak signal strength ranging between -95dBm and -105dBm. In such a condition, throughput and RTT performance are significantly degraded but the performance gain from DRWA is still clearly visible.
different cellular networks operated by various carriers. For each network we ran the test for 24 hours. During the test, we applied netem, the built-in network emulator in Linux [11] on the server side to emulate the scenarios of differ-ent end-to-end latencies. From Table 3, we see that An-droid phones with DRWA significantly improve the through-put in all cellular networks as the end-to-end latency in-creases. The scenario over the Sprint EVDO network with the end-to-end latency of 754 ms shows the largest improve-ment (as high as 51.06%). In LTE networks, the phones with DRWA show throughput improvement up to 38.67% under the latency of 219 ms.
The reason behind the improvement is obvious. When the latency increases, the static values set by the vendors fail to saturate the pipe, resulting in throughput degradation. In contrast, networks with small latencies do not show such degradation. According to our experiences, RTTs between 400 ms and 700 ms are easily observable in cellular
net-works, especially when using services from foreign servers. In the LTE networks, TCP throughput is even more sen-sitive to tcp rmem max setting. The BDP can be dramat-ically increased by a slight RTT increase. Therefore, the static configuration easily becomes far from optimal. How-ever, DRWA is able to keep pace with the increasing BDP without any problem.
5.3
End-to-End Latency Reduction
0 20 40 60 80 100 0
50 100 150 200 250
Time (s)
Congestion Window Size (KBytes)
AT&T HSPA+
(a)cwndin AT&T HSPA+
0 20 40 60 80 100
0 50 100 150
Time (s)
Congestion Window Size (KBytes)
Verizon EVDO
(b)cwndin Verizon EVDO
Figure 17: For 0.5% packet losses applied by netem, AT&T’s HSPA+ network shows frequent RTO events while other cellular networks (e.g., Verizon’s EVDO net-work) do not. A drop ofcwndin the left figure indicates RTO but that in the right figure indicates fast retransmis-sion although they look similar. Intermediate data points during the drop explains the difference.
improvement in RTT brought by DRWA while throughput is preserved.
In Figure 15, we downloaded a file from a local server installed at a university campus in U.S. to Android phones in U.S. to explore the throughput and end-to-end delay formance in small BDP networks. We measured the per-formance for a whole day per each carrier and compared the performance between Android phones with and without DRWA. During the whole day run, each round of the file downloading took three minutes, resulting in over 400 runs within a day. From Figure 15, we can verify that remark-able reduction of RTT up to 48.97% is achieved while the throughput is guaranteed in a similar level (4% difference at maximum). The same tests were repeated under weak signal conditions and the results are shown in Figure 16. In this scenario, the average throughput of the TCP flows is much lower than that in Figure 15(a) while the RTT is much longer. But DRWA can still reduce the RTT with no throughput loss. Another important observation from the experiments is that the current implementation with a static receive win-dow experiences much larger RTT variation than DRWA. As Figures 15(a) and 15(c) show, the RTT values of untouched Android phones are distributed over a much wider range than that of phones with DRWA. The reason is clear be-cause DRWA intentionally enforces the RTT to stay around
the target value ofλ∗RT Tmin. This property of DRWA
will potentially benefit jitter sensitive applications such as live video communications and voice chats.
0.05% 0.1% 0.5% 1% 2%
0 0.5 1 1.5 2 2.5 3 3.5 4 4.5
Loss Ratio
Throughput (Mbps)
Untouched Android HSPA+ With DRWA HSPA+ Untouched Android EVDO With DRWA EVDO
Figure 18: DRWA alleviates TCP throughput degrada-tion in AT&T HSPA+ network: throughput is increased by 6.75%, 50.09% and 54.30% under loss ratio of 0.05%, 0.5% and 2% respectively.
5.4
Loss Recovery
Although buffer-bloated cellular networks rarely have packet losses, other part of the end-to-end TCP connection may still experience them. For instance, according to the large-scale measurement study in [5], the Internet experiences a non-negligible packet loss rate between 1% and 6%. If such packet losses result in RTO, TCP running over an exces-sively long queue will need to pay expensive recovery cost. For an RTO, the TCP sender has to retransmit all of the pack-ets in flight over the network. When there are more queued packets, the amount of discarded packets due to the retrans-missions becomes higher. In general, RTO rarely happens in cellular networks because SACK (selective acknowledge-ment) is enabled in Android phones by default and it typi-cally recovers packet losses before time out happens. How-ever, in some cellular networks, special configurations make RTO happens with high probability even with a single packet loss. The HSPA+ network operated by AT&T is one
ex-ample of such networks. As shown in Figure 17(a), cwnd
of TCP over AT&T’s HSPA+ network shows very frequent RTO operations when we emulate packet losses in the Inter-net using Inter-netem, while other cellular Inter-networks do not show
such cwnd behaviors. Figure 17(b) exemplifies that RTO
does not happen in Verizon’s EVDO network. Instead, fast retransmit recovers the lost packets. Since netem imposes bursty packet losses, the RTO and fast retransmit look
simi-lar, butcwndin Verizon’s EVDO network shows
intermedi-ate data points while falling down, which tells that the drops are not from RTO.
packet loss.
To further explore this issue, we set up a test scenario over the AT&T’s HSPA+ network and Verizon’s EVDO network. We apply random bursty packet losses whose ratios range from 0.05% to 2% using netem on a router connected to our local server in U.S.. This range of packet loss rate is observ-able in the wild Internet [5]. Figure 18 shows the through-put results for different loss ratios with and without DRWA. Since DRWA keeps the queue size smaller, when RTO hap-pens, the amount of packets to be recovered is less. There-fore, Android phones with DRWA experience less through-put degradation comparing to the untouched Android phones for the same loss ratio. Up to 54% of throughput improve-ment is observable when the loss ratio goes beyond 0.5%.
6.
CONCLUSION
In this paper, we thoroughly investigated TCP’s behavior and performance over cellular networks. We reveal that the excessive buffers available in existing cellular networks void the loss-based congestion control algorithm used by most TCP implementations and the naive solution adopted of set-ting a static tcp rmem max is sub-optimal. Built on top of our observations, a dynamic receive window adjustment al-gorithm is proposed. This solution requires modifications only on the receiver side and is backward-compatible as well as incrementally deployable. We ran extensive experiments over various cellular networks (EVDO, HSPA+, LTE, etc.) to evaluate the performance of our proposal and compare it with the current implementation. Experiment results show
that our scheme makes RTT 24.09∼48.97% lower than the
current implementation of TCP while throughput is guaran-teed to be the same in general cases or up to 51.06% higher in a high speed network with long latency. The bufferbloat problem is becoming more and more prevalent in the Inter-net. It is not specific to cellular networks although it might be the most prominent in this environment. A more fun-damental solution to this problem may be needed. Our work provides a good starting point and is an immediately deploy-able solution for smart phone users.
7.
REFERENCES
[1] tcpdump. http://www.tcpdump.org/.
[2] S. Athuraliya, S. Low, V. Li, and Q. Yin. REM: Active Queue Management. IEEE Network, 15:48–53, May 2001.
[3] L. S. Brakmo, S. W. O’Malley, and L. L. Peterson. TCP Vegas: New Techniques for Congestion Detection and Avoidance. In Proceedings of ACM SIGCOMM, 1994.
[4] M. C. Chan and R. Ramjee. TCP/IP Performance over 3G Wireless Links with Rate and Delay Variation. In Proceedings of ACM MobiCom, 2002.
[5] N. Dukkipati, T. Refice, Y. Cheng, J. Chu, T. Herbert, A. Agarwal, A. Jain, and N. Sutin. An Argument for Increasing TCP’s Initial Congestion Window. SIGCOMM Comput. Commun. Rev., 40:26–33, June 2010.
[6] W.-c. Feng, M. Fisk, M. K. Gardner, and E. Weigle. Dynamic Right-Sizing: An Automated, Lightweight, and Scalable Technique for Enhancing Grid
Performance. In Proceedings of the 7th IFIP/IEEE International Workshop on Protocols for High Speed Networks (PIHSN), pages 69–83, 2002.
[7] S. Floyd and T. Henderson. The NewReno
Modification to TCP’s Fast Recovery Algorithm. IETF RFC 2582, April 1999.
[8] S. Floyd and V. Jacobson. Random Early Detection Gateways for Congestion Avoidance. IEEE/ACM Transactions on Networking, 1:397–413, August 1993.
[9] J. Gettys. Bufferbloat: Dark Buffers in the Internet. IEEE Internet Computing, 15(3):96, May-June 2011. [10] S. Ha, I. Rhee, and L. Xu. CUBIC: a New
TCP-friendly High-speed TCP Variant. ACM SIGOPS Operating Systems Review, 42:64–74, July 2008. [11] S. Hemminger. Netem - emulating real networks in the
lab. In Proceedings of the Linux Conference, 2005. [12] J. Huang, Q. Xu, B. Tiwana, Z. M. Mao, M. Zhang,
and P. Bahl. Anatomizing Application Performance Differences on Smartphones. In Proceedings of ACM MobiSys, 2010.
[13] K.-c. Lan and J. Heidemann. A Measurement Study of Correlations of Internet Flow Characteristics.
Computer Networks, 50:46–62, January 2006. [14] Y. Lee. Measured TCP Performance in CDMA 1x
EV-DO Networks. In Proceedings of the Passive and Active Measurement Conference (PAM), 2006. [15] X. Liu, A. Sridharan, S. Machiraju, M. Seshadri, and
H. Zang. Experiences in a 3G Network: Interplay between the Wireless Channel and Applications. In Proceedings of ACM MobiCom, pages 211–222, 2008. [16] M. Mathis, J. Heffner, and R. Reddy. Web100:
Extended TCP Instrumentation for Research,
Education and Diagnosis. AMC SIGCOMM Computer Communications Review, 33:69–79, July 2003. [17] S. Ostermann. tcptrace. http://www.tcptrace.org/. [18] F. Qian, A. Gerber, Z. M. Mao, S. Sen, O. Spatscheck,
and W. Willinger. TCP Revisited: a Fresh Look at TCP in the Wild. In Proceedings of the 9th ACM SIGCOMM IMC, pages 76–89, 2009.
[19] Z. Wang, Z. Qian, Q. Xu, Z. Mao, and M. Zhang. An untold story of middleboxes in cellular networks. In Proceedings of the ACM SIGCOMM, 2011. [20] D. X. Wei, C. Jin, S. H. Low, and S. Hegde. FAST
TCP: Motivation, Architecture, Algorithms, Performance. IEEE/ACM Transactions on Networking, 14:1246–1259, December 2006. [21] L. Xu, K. Harfoush, and I. Rhee. Binary Increase
Congestion Control (BIC) for Fast Long-distance Networks. In Proceedings of IEEE INFOCOM, 2004. [22] P. Yang, W. Luo, L. Xu, J. Deogun, and Y. Lu. TCP
![Figure 1: Over-buffering has been widely observed inthe current Internet [9] but is especially severe in cellularnetworks, resulting in up to several seconds of end-to-enddelay.](https://thumb-us.123doks.com/thumbv2/123dok_us/1507411.1184586/1.612.330.542.204.289/figure-buffering-observed-internet-especially-cellularnetworks-resulting-enddelay.webp)