ISSN(Online): 2319-8753 ISSN (Print): 2347-6710
I
nternational
J
ournal of
I
nnovative
R
esearch in
S
cience,
E
ngineering and
T
echnology
(A High Impact Factor, Monthly, Peer Reviewed Journal)
Visit: www.ijirset.com
Vol. 7, Issue 5, May 2018
Waste Water Quality Analysis
Shubham Gharat, Pratik Ghule, Ashsish Choudhari, Shubham Jadhav, Anurag Kadam, Prof. N. P. Jajoo
B. E Students, Department of Civil Engineering, JSPM Narhe Technical Campus, Pune, India
Department of Civil Engineering, JSPM Narhe Technical Campus, Pune, India
ABSTRACT: The objective of sewage treatment is to produce a disposable effluent without causing harm to the surrounding environment, and also prevent pollution. Industries produce large volumes of wastes that may include a wide variety of chemicals containing most toxic pollutants. Some of the industrial wastes can be treated jointly in municipal wastewater treatment plants, but others must be pretreated at the source. The present paper presents the analysis of the wastewater by finding out the values of various target parameters i.e. pH, alkalinity, hardness, chloride, COD and BOD so that wastewater characteristics of the area can be found out with the purpose of modifying the existing treatment scheme for the wastewater treatment being presently used. The pH of sample collected from Pune Tathawade was lowest and its value was 6.3 i.e. more acidic than all other samples. The pH of sample collected from Pune Karvenagarwas highest and its value was11.5 i.e. more basic than all other samples. Sample collected from TathawadeArea reported least alkalinity of 180 mg/l as CaCO3. Sample collected from Karvenagar reported highest alkalinity of 600 mg/l as CaCO3. The highest total hardness level of 464.5 mg/l as CaCO3 was reported from slaughter house existing on Mathura Rd. area. The lowest total hardness value of 200 mg/l as CaCO3 was reported from Pune Area. The highest values of chloride concentration of 428.3 mg/l were reported from Tathawade area. The lowest chloride concentration of 119.5mg/l was reported from Karvenaagr area. The least BOD5 value of 57 mg/l at 20° C was reported at Tathawade Highest BOD5 value of 85.04 mg/l was reported at Pune area.
KEYWORDS: COD, BOD, PH, Waste Water Quality
I. INTRODUCTION
ISSN(Online): 2319-8753 ISSN (Print): 2347-6710
I
nternational
J
ournal of
I
nnovative
R
esearch in
S
cience,
E
ngineering and
T
echnology
(A High Impact Factor, Monthly, Peer Reviewed Journal)
Visit: www.ijirset.com
Vol. 7, Issue 5, May 2018
Organic or bio-degradable waste, including waste from abattoirs, creameries, and ice cream manufacture, Organic or non biodegradable/difficult-totreat waste (pharmaceutical or pesticide manufacturing), extreme pH waste (from acid/alkali manufacturing, metal plating), Toxic waste (metal plating, cyanide production, pesticide manufacturing, etc.), Solids and Emulsions (paper manufacturing, foodstuffs, lubricating and hydraulic oil manufacturing, etc.), agricultural drainage, direct and diffuse.[5]
1.1 Waste Water Characteristics
The selection and design of treatment plants for (industrial and domestic) wastewater is based on the study of the physical, chemical and biological characteristics of wastewater, the quality that is to be maintained in the environment to which the wastewater is to be discharged or quality that is to be maintained for its reuse and standards for its discharge as specified by CPCB.The important and principal physical characteristics of wastewater are its color, solid contents, its odor and temperature and chemical properties include organic compounds, inorganic compounds, pH, alkalinity, dissolved oxygen. [6]
Color
Color is a qualitative characteristic that can be used to assess general condition of Wastewater. Wastewater that is light brown in color is less than 6 h old, while a light-to- medium grey color is characteristic of wastewaters that have undergone some degree of decomposition or that have been in the collection system for some time. If the color is dark grey or black, the wastewater is typically septic, having undergone extensive bacterial decomposition under anaerobic conditions. [7]
Total Solids
The total solids in a wastewater consist of the insoluble or suspended solids and the soluble compounds dissolved in water. Between 40 and 65 % of the solids in an average wastewater are suspended. Settleable solids, expressed as milliliters per liter, are those that can be removed by sedimentation. Usually about 60 % of the suspended solids in a municipal wastewater are settleable.
Odor
The determination of odor has become increasingly important, as the general public has become more concerned with the proper operation of wastewater treatment facilities. The odor of fresh wastewater is usually not offensive, but a variety of odorous compounds are released when wastewater is decomposed biologically under anaerobic
conditions. The principal odorous compound is hydrogen sulphide (the smell of rotten eggs). Other compounds, such as indol, skatol, cadaverin and mercaptan, formed under anaerobic conditions or present in the effluents of pulp and paper mills (hydrogen sulphide, mercaptan, dimethylsulphide etc.), may also cause a rather offensive odor. Odor is measured by successive dilutions of the sample with odor-free water until the odor is no longer detectable.
Temperature
Temperature is not a critical issue below 37 °C if waste water is to receive a biological treatment. Most industries waste tends to be on the warmer side. It is possible to operate thermophilic biological wastewater treatment systems up to 65 °C with acclimated microbes. Low temperature operations in northern climates can result in very low temperatures and slow reaction rates for both biological treatment systems and chemical treatment system. Increased viscosity of waste waters at low temperatures makes solid separation more difficult. Efforts are generally made to keep operating temperatures between 10 °C and 30 °C.
Organic Compounds
ISSN(Online): 2319-8753 ISSN (Print): 2347-6710
I
nternational
J
ournal of
I
nnovative
R
esearch in
S
cience,
E
ngineering and
T
echnology
(A High Impact Factor, Monthly, Peer Reviewed Journal)
Visit: www.ijirset.com
Vol. 7, Issue 5, May 2018
reflux with concentrated sulphuric acid and potassium dichromate with silver sulphate and mercuric sulphate catalyst is adequate for complete oxidation of all but a few aromatic organic compounds.
Inorganic Compounds
The inorganic compounds in most industrial wastes are the direct result of inorganic compounds in the carriage water. Soft water sources will have lower inorganic compounds than hard water or salt water sources. In a few instances, industrial processes add inorganic compounds to the waste water. While domestic waste water has a balance industrial processes add inorganic compounds to the waste water. While domestic waste waters have balance in organic compounds and inorganic compounds, many process waste waters from industry are deficient in specific inorganic compounds. Biodegradation of organic compounds requires adequate nitrogen, phosphorus, iron and trace salts. Ammonium salts or nitrate salts can provide the nitrogen, while phosphate supplies the phosphorus. Either ferrous or ferric salts or even normal steel corrosion can supply the needed iron. Other trace elements needed for biodegradation are potassium, calcium magnesium, cobalt, molybdenum, chloride and sulphur. Carriage water or demineralised waste waters or corrosion products can supply the needed trace elements for good metabolism. Occasionally, it is necessary to add specific trace elements or nutrient elements.
pH and Alkalinity
Waste water less than ph less than 6 are corrosive in nature and those having pH more than 9 will cause some of the metal ions to precipitate as carbonates or hydroxides.
Dissolved Oxygen
Dissolved Oxygen is present in water which is an essential element for the working of aerobic bacteria in the biological treatment systems. It is important that the waste water have maximum DO level, when these are discharged. Oxygen is a poorly soluble gas in water, having a solubility of 9.1 mg/l at 20°C. DO is minimum when the BOD rates are maximum. Chlorides, sulphates, pH and alkalinity are determined to assess the suitability of reusing treated wastewater and in controlling the various treatment processes. Trace elements, which include some heavy metals, are not determined routinely, but trace elements may be a factor in the biological treatment of wastewater. All living organisms requirevarying amounts of some trace elements, such as iron, copper, zinc and cobalt, for proper growth. Heavy metals can also produce toxic effects; therefore, determination of the amounts of heavy metals is especially important where the further use of treated effluent or sludge is to be evaluated. Many of the metals are also classified as prioritypollutants
1.2 Objectives-
To design the appropriate wastewater treatment plant (WWTP) for specific area. • To monitor and evaluate efficiency of treatment processes in WWTP.
• To study the reuse of treated wastewater (in agriculture or recharge). • To make the Environmental Impact Assessment.
1.3 Measurement Techniques: • Gravimetric
• Electrochemical
• Colorimetry or spectrophotometry • Titration
• Chromatography • Mass Spectrometry
1.4 Scope
ISSN(Online): 2319-8753 ISSN (Print): 2347-6710
I
nternational
J
ournal of
I
nnovative
R
esearch in
S
cience,
E
ngineering and
T
echnology
(A High Impact Factor, Monthly, Peer Reviewed Journal)
Visit: www.ijirset.com
Vol. 7, Issue 5, May 2018
II. REVIEW OF LITERATURE
The current state of research on topics of relevance to the title of the thesis has been compiled in this chapter. This chapter discusses the various surveys on wastewater treatment systems, the techniques and methodologies available in the field of wastewater treatment process. It explains anaerobic wastewater treatment process, agro-food wastewater and a few other methods for the treatment of agro-food wastewater. Moreover, the steps involved in the prediction system, the various methods and techniques used to predict the effluent variables in different kind of wastewater are also discussed in this chapter.
2.1. Survey on Wastewater Treatment System
Wastewaters are waterborne solids and liquids which get discharged into sewers representing the wastes of public life. Wastewater includes dissolved and suspended organic solids which can be biologically decomposable. Wastewater treatment is a process in which the solids in wastewater are partially removed and are partially changed by decomposition from highly complex organic solids in to relatively stable organic solids. The majority of Biological Oxygen Demand (BOD) and Suspended Solids (SS) found in wastewater are removed in the primary and secondary treatments. Though, this level of treatment has proved to be insufficient to provide reusable water for industrial and domestic recycling, additional treatment steps have been added to wastewater treatment plants to provide further removal of organic solids, nutrients and toxic materials.
Advanced wastewater treatment technology has become an active research area which can be coupled with wastewater reduction and water recycling initiatives. Membrane technology has become a dignified separation technology which works with relatively low energy use and well-arranged process conduction without adding of chemicals. AmitSonune and RupaliGhate (2004) have covered all advanced methods of wastewater treatments and the reuse of wastewater. Excess biomass produced during the biological treatment of wastewater requires costly disposal. Euan and Howard (1999) reviewed biomass production during wastewater treatment and identified methods for reducing the quantity of biomass production. Reduction of biomass production during aerobic metabolism must promote the conversion of organic pollutants to respiration products with a simultaneous increase in the aeration requirements. Encouraging further metabolism of assimilated organic carbon will release additional respiration products and reduce the overall biomass production. Suitable physical conditions and strategic process operations may result in reduced biomass production in the environment. The reduced biomass production may result in increase of nitrogen concentration in the effluent. The authors have also discussed that the anaerobic operation improves the need for costly aeration and the low efficiency of anaerobic metabolism results in a low yield of biomass which can be suitable for wastewater treatment. Reusing of wastewater reduces the cost of freshwater supply and wastewater disposal based on economic prospect. Reusing considerable amount of wastewater typically involves regeneration/treatment of the available wastewater to meet the high requirements of water quality. Conversely, the processing cost of reuse of wastewater rises exponentially with contaminant removal efficiency. They have demonstrated the importance of balancing these competing cost factors which are functions of the post-regeneration/post-treatment contaminant concentration. This cost optimization procedure can be used to minimize the total cost of wastewater reuse system with either wastewater regeneration reuse or wastewater treatment reuse.
2.2. Anaerobic Wastewater Treatment Process
There are two kinds of wastewater treatment process namely: Aerobic and Anaerobic. The present research focuses on anaerobic treatment process. This section discusses the wastewater treatment process done using anaerobic digester.
ISSN(Online): 2319-8753 ISSN (Print): 2347-6710
I
nternational
J
ournal of
I
nnovative
R
esearch in
S
cience,
E
ngineering and
T
echnology
(A High Impact Factor, Monthly, Peer Reviewed Journal)
Visit: www.ijirset.com
Vol. 7, Issue 5, May 2018
The attractiveness of biogas technology for large scale applications has been limited essentially due to the slow rate and process instability of anaerobic digestion. Slow rate means large digester volume (consequently greater costs and space requirements) and process stability means lack of assurance for steady energy supply. These two major disadvantages of conventional anaerobic processes has been overcome by high rate anaerobic reactors which employ cell immobilization techniques (Bull et al., 1984).
David et al., (2005) studied the performance of the anaerobic digesters treating waste activated sludge, produced in four large Italian wastewater treatment plants. The anaerobic digesters treating waste activated sludge were determined on a full-scale basis and lab-scale basis. The pre-treatment of waste activated sludge should be adopted to improve its biodegradability and balance the heat of the digesters. Co-digestion of sludge with other organic wastes shall be considered as the best approach, but before that, the capability of the wastewater treatment line facing the increased loads of pollutants which originated from the anaerobic digesters should be verified. Finally, they developed a mathematical model was developed for the prediction of biogas production on the solid retention time applied in the wastewater treatment process.
Anaerobic reactors are gaining popularity in the treatment of various types of wastewater because of their low initial and operational costs, smaller space requirements, high organic removal efficiency and low sludge production.
Joo and Xiyue (2000) developed a fast predicting Neuro-Fuzzy model to calculate the response of high-rate anaerobic systems to different system disturbances based on a conceptual neural fuzzy model developed for anaerobic treatment systems. This model was applied to three laboratory scale systems such as an Anaerobic Fluidized Bed Reactor (AFBR), an Anaerobic Filter (AF), and an Up-flow Anaerobic Sludge Blanket (UASB) reactor. These models were learned well from the training patterns which exhibit good and fast predictions for the performance of the three systems, which subjects to two-fold Organic Loading Rate (OLR) together with two-fold Hydraulic Loading Rate (HLR) overload shock. The authors have also proved that neural fuzzy modeling has great adaptability to the variations of system configuration and operation conditions.
To improve the knowledge of stability and reliability of anaerobic wastewater treatment systems, researchers have studied the effects of operational or environmental variations on the performance of such reactors. Generally, changes in external factors affect anaerobic reactors; however the severity of the effect is proportionate to the magnitude, duration, type and frequency of the imposed changes. The usual responses vary from accumulation of volatile fatty acids, change in biogas production and composition, drop in pH, and decrease in performance and alkalinity and sludge washout. Renato et al., (2006) summarized the types, causes and effects of operational and environmental variations of anaerobic wastewater treatment system. Still, there is lack of some technical and scientific aspects that are necessary for the improvement of the stability and reliability of anaerobic processes.
Diagnosis of phased anaerobic treatment of wastewater is extremely possible. Recently, various reactor configurations and substrates have been applied to two-phase anaerobic process. Shuizhou and Zhou (2005) reviewed applications of two-phase anaerobic degradation for wastewater treatment and summed up the performance of application to treating waste from landfill leachate, sludge and solid, distillery, industries producing/processing pulp and paper, food, coffee, cheese dairy etc. They summarized environmental and operational conditions, reactor configurations and comparisons of two-phase anaerobic digestion with other anaerobic reactors.
The key to successful application of high-rate anaerobic treatment is to un-couple the Hydraulic Retention Time (HRT) and the Solid Retention Time (SRT) in the reactor system. In order to achieve high system loading rates, short HRTs should be used, at the same time maintaining positive net solids (biomass retention). Thus, reactor designs that employ methods of retaining biomass within the reactor have been developed over the past two decades (Tay et al., 2006).
ISSN(Online): 2319-8753 ISSN (Print): 2347-6710
I
nternational
J
ournal of
I
nnovative
R
esearch in
S
cience,
E
ngineering and
T
echnology
(A High Impact Factor, Monthly, Peer Reviewed Journal)
Visit: www.ijirset.com
Vol. 7, Issue 5, May 2018
2.3. Agro- Food Wastewater
Wastewater from agro-food productions is termed as agro-food wastewater. It contains relevant concentration of hardly biodegradable compounds phyto-toxic chemicals which turned out to be a biggest threat to human lives and many other aquatic organisms.
Sewage contributes about 60% of the total pollution load in terms of Biochemical Oxygen Demand (BOD). Total wastewater generation from major water consuming industries such as agro-based industries, refineries, petrochemicals, fertilizers, and chemical industries was estimated to be about 3000 million litres per day in 1997 (TERI, 1998). Agro-industries are the major contributors to the world-wide industrial pollution problem. 65–70% of the organic pollutants released in the water bodies in India are accounted by food and agro-product industries such as distilleries, sugar factories, dairies, fruit canning, meat processing, pulp and paper mills etc.
The wastewater characteristics generated across the world from some specific agro based industries such as synthetic wineries, dairies and fruit juice manufacturing units are discussed further.
2.3.2 Agro Food Wastewater Generation and their Characteristics
The composition and concentration of different agro-food wastewaters vary from low to high strength substrates. The main parameters of the agro-food industrial wastewater are total solids (TS), total nitrogen (TN), total phosphorus (TP), Biological Oxygen Demand (BOD) and Chemical Oxygen Demand (COD) varies for the substrates, thus determining their unique characteristics.
Winery wastewater
Wine is one of the oldest alcoholic beverages in the world, originate from the Black Sea region around 5,000 AD. Worldwide, wine production is currently around 270 million hectolitres per year (Lipnizki et al., 2006). The market is led by the European countries (69%), followed by the USA (18%), Asia (5%), Africa (4%) and Oceania (4%). More than 50% of the wine produced is still (non-sparkling) red wine, while still white wine accounts for about 25%. The remaining quarter is mainly shared between rosé and sparkling wines.
worldwide wine consumption was around 228 million hectolitres per year, distributed among European countries (68%) followed by the USA (20%), Asia (7%), Africa (3%) and Oceania (2%) (OIV, 2005). Wine waste is defined as a high strength organic waste, low in nitrogen and phosphorous with sufficient trace elements for bacterial growth (Toffelmire, 1972). Other compounds include alcohol, hexose sugars (glucose and fructose), organic acids (acetic, lactic, citric, malic, succinic and tartaric), soluble proteins, peptides and tartrates (Moosbrugger et al., 1993).
Cheese-whey wastewater
ISSN(Online): 2319-8753 ISSN (Print): 2347-6710
I
nternational
J
ournal of
I
nnovative
R
esearch in
S
cience,
E
ngineering and
T
echnology
(A High Impact Factor, Monthly, Peer Reviewed Journal)
Visit: www.ijirset.com
Vol. 7, Issue 5, May 2018
Distillery wastewater
There are numerous reports in the literature showing the toxic and the inhibitory effects of these aromatic compounds on anaerobic digestion process (Alvarez and Lettinga, 1990; Britz et al., 1992). Treated effluent contains carboxylic acids, mono- and disaccharides, amines, polyphenolic compounds and pigments, whereas only ethyl alcohol and flavoring volatile compounds are eliminated partly. One litre of red wine on an average contains 0.6 to 11 mg resveratrols (depending on the zone of origin) and its production results in approx. 0.7 L vinasse with a residue of 0.5 to 2.5% by wt., containing most of the antioxidant complexes present in wine (http://www.freepatentsonline.com /20040166179.html). The characteristics of Wine distilleries have Total COD of 12 – 34 (g/L), Total Suspended Solids of 2.4 - 10 (g/L), Volatile Suspended Solids of 1.2 – 5.4 (g/L), Phenol of 0.09 –0.3 (g/L) and pH with 4.5 - 5.2.
2.4 Treatment of Agro-Food Wastewater using Anaerobic Reactors
Bialek et al. (2012) evaluated the performance of two types of reactors (inverted Fluidized Bed (IFB) and Expanded Granular Sludge Bed (EGSB) reactors) which are used for treating simulated dairy wastewater. They obtained more
than 80% of COD and protein removals with an OLR of 167 mg COD L−1 h−1 and a HRT of 24 hours, at 37 °C.
Within the spectrum of high rate anaerobic treatment technologies, the immobilization of the micro organisms in the fixed bed and the formation of the granules in UASB reactor have been recognised as the two most frequently used anaerobic techniques to reduce the HRT during anaerobic digestion of wastewater having low organic matter concentration (Jhung and Choi, 1995).
The advantage of the synthetic packing’s lies in their large open structures and high void volumes (of the order of 95%). The large voidage maximizes the available reaction volume and provides space for the accumulation of non-attached biomass (Malina and Pohland, 1992). The media surface allows the development of an non-attached biofilm. Because of the retained biomass associated with the packing, the process has been found stable against high organic loadings, shock loadings or changes in pH and temperature while conventional suspended anaerobic process has not been found to be stable. After a long starvation period the process recovers quickly.
Rajagopal et al., (2009), developed high-rate Up-Flow Anaerobic Filters (UAFs) packed with low- density polyethylene media for the treatment of wastewater discharged from various agro-food industries with different compositions and COD concentrations. High organic loading rates (OLRs) (12–
27 g COD L−1 d−1) were reported in this study. Low-density polyethylene support (29 mm high; 30–35mm
diameter; density: 0.93 kg m−3; specific area: 320 m2 m−3) was able to retain between 0.7 and 1.6 g dried solids per
support. This study concluded that the low-density polyethylene support is a good colonization matrix to increase the quantity of biomass in the reactor compared to conventional treatment systems.
Rodriguez et al., (2007) studied the feasibility of the denitrification process enhancement, in the Ciudad Real (Spain) WWTP by measuring agro-food wastewater generated nearby the city. These agro-food wastewater were illustrated by a high COD and low nutrient strength.
Shaji and Kamaraj (2002) have found that a high proportion of the biomass (50%) is not strictly attached to the support media, but is rather held in the interstitial spaces of the filters. To accommodate the accumulation of non-attached biomass without plugging of the bed, the early designs of low voidage, rock-packed reactors have been largely replaced by systems that incorporate synthetic packing materials.
ISSN(Online): 2319-8753 ISSN (Print): 2347-6710
I
nternational
J
ournal of
I
nnovative
R
esearch in
S
cience,
E
ngineering and
T
echnology
(A High Impact Factor, Monthly, Peer Reviewed Journal)
Visit: www.ijirset.com
Vol. 7, Issue 5, May 2018
McCarty (1969); Dahab and Young (1982) and Young and Yang (1989). Twenty five varieties of natural materials such as smooth quartzite pebbles, shells, granite stones, and brick ballast have been used for attachment and growth of anaerobic biomass (Van and Kennedy, 1981).
2.6 Data Preprocessing
The raw data of agro-food industries wastewater obtained from the anaerobic digestion must be preprocessed.
Missing Values
A preprocessing task was carried out to substitute the missing input values by the average value obtained for the instances with valid values. When the dataset has minimum number of missing attribute values then we can ignore such exceptions. If the values are high, deleting those instances might allow the essential information to be lost. Very few methods are available in the literature for eliminating or replacing the missing values and some of the significant works are discussed in this section
Average (AVE) method based on a Missing Completely At Random (MCAR) assumption are related to the observation that the missing values are independent of data structure. Regrettably, MCAR observations are less likely in reality since they are commonly correlated with time.
In water treatment plants, it is necessary to obtain flow data for a system over a period of time. In most cases, it is not possible to obtain the parameter of interest in a closed form. Generating data over a period of time within the known range is not possible and it may be extremely time-consuming. Several methods are also available for interpolation or extrapolation to determine the unknown data or missing data within or outside a range of known data points.
Huo et al., (2010) proposed two-time series model-based methods namely Two-directional Exponential Smoothing (TES) and TES with White Noise (TESWN) added methods to replace missing data. The proposed methods outperformed the traditional missing-data-replacement methods like ANO method and AVE method based on MCAR.
III. METHODOLOGY
Sampling Procedures and Techniques:
For sound evaluating of sampling program, the lab inspector must be familiar with the procedures and techniques necessary for accurate sampling of wastewaters. The following discussion details the procedures for sample collection, preservation, transfer, quality control, and data handling.
Wastewater Sample Collection Techniques
Sample collection is an important part of the wastewater monitoring program. Without proper sample collection procedures, the results of such monitoring programs are neither useful nor valid, even with the mostprecise and accurate analytical measurements.
Selection of Representative Sampling Sites
Normally, samples should be collected at the location specified in the plan.
Influent Samples. Document and take these samples at points of high turbulence flow to ensure good mixing. The preferred sampling points for raw wastewater are:
1. Waste flowing from last process in a manufacturing operation 2. Pump wet well (if turbulent)
3. Upstream collection lines, tank, or distribution box following pumping from the wet well or sump 4. Flume throat
5. Aerated grit chamber
ISSN(Online): 2319-8753 ISSN (Print): 2347-6710
I
nternational
J
ournal of
I
nnovative
R
esearch in
S
cience,
E
ngineering and
T
echnology
(A High Impact Factor, Monthly, Peer Reviewed Journal)
Visit: www.ijirset.com
Vol. 7, Issue 5, May 2018
If it is not possible to sample at a preferred point, choose an alternative location and document the basis for choosing that location.
Effluent Samples. Collect these samples at the site the permit specifies or, if the permit does not specify a site then the inspector should select the most representative site after final treatment and downstream from allentering waste streams before they enter the receiving waters. Occasionally, municipal plant permits mayspecify sampling prior to chlorination. For these plants, monitor all parameters at the upstream location except fecal coliforms, pH, and total residual chlorine.
The following general guidelines apply when taking samples: 1. Take samples at a site selected to yield a representative sample.
2. Use a sampling method (grab, composite, continuous) as required in the permit. Some collected are dissolved oxygen, total residual chlorine, oil and grease, coliforms, purgeable organics, sulfides, cyanide, and total phenols. 3. Avoid collecting large nonhomogeneous particles and objects.
4. Collect the sample facing upstream to avoid contamination.
5. Do not rinse sample container with sample when collecting oil and grease and microbiological samples, but fill it directly to within 2.5 to 5 cm from the top.
6. Fill the container completely if the sample is to be analyzed for purgeable organics, oxygen, ammonia, hydrogen sulfide, free chlorine, pH, hardness, sulfite, ammonium, ferrous iron, acidity, or alkalinity.
7. Collect sufficient volume to allow for quality assurance testing. (Table1 provides a guide to numerous sample volumes, but additional volumes may be necessary for quality assurance testing.)
The following general guidelines apply when using automatic samplers:
1. Collect samples where the wastewater is well mixed. Collect the sample near the center of the flow channel at 0.4 to 0.6 depths (mid-depth).
2. Obtain a sufficient volume of sample to perform all required analyses plus any additional amount for quality control. Individual portions of a composite sample should be at least 100 milliliters in order to minimize sampler solids bias. 3. For automatic samplers which use a peristaltic pump, obtain adequate flow rates in the sampler tubing to effectively transport the suspended solids. To avoid solids bias, the velocity of the wastewater in sample tubing should be at least 2 fps and the tubing diameter should be at least 0.25 inch.
4. Time of sample collection begins when the last aliquot is dispensed into the composite sample container. Sample Volume
The volume of samples collected depends on the type and number of analyses needed, as reflected in the parameters to be measured. Obtain the volume of the sample sufficient for all the required analyses plus an additional amount to provide for any split samples or repeat analyses. Table 1 provides a guide to sample volumes required for determining the constituents in wastewater. Consult the laboratory receiving the sample
for any specific volume required. EPA's Methods for Chemical Analysis of Water and Wastes (USEPA 1979b) and Handbook for Sampling and Sample Preservation of Water and Wastewater (USEPA 1982), and the current Environmental Protection Agency (EPA)-approved edition of Standard Methods for the Examinationof Water and Wastewater [American Public Health Association (APHA),
ISSN(Online): 2319-8753 ISSN (Print): 2347-6710
I
nternational
J
ournal of
I
nnovative
R
esearch in
S
cience,
E
ngineering and
T
echnology
(A High Impact Factor, Monthly, Peer Reviewed Journal)
Visit: www.ijirset.com
Vol. 7, Issue 5, May 2018
Sample Containers
The table 2 describes required sample containers, sample preservation, and sample holding time. It is essential that the sample containers be made of chemically resistant material unaffected by the concentrations of the pollutants measured. In addition, sample containers must have a closure that will protect the sample fromcontamination. Collect wastewater samples for chemical analysis in plastic (polyethylene) containers.Exceptions to this general rule are oil and grease samples, pesticides, phenols, polychlorinated biphenyls (PCBs), and other organic pollutant samples. Collect these in properly cleaned glass jars or bottles and sealed. Collect bacteriological samples in properly sterilized plastic or glass containers. Collect samples that contain constituents that will oxidize when exposed to sunlight (such as iron cyanide complexes) in dark containers. Ensure sample containers are clean and uncontaminated. Check analytical procedures to determine if they specify container cleaning procedures. Use pre-cleaned and sterilized disposable containers (e.g., polyethylene containers). If these are not used or if the analytical method does not specify procedures, use the followingprocedures for cleaning sample containers:
1. Wash with hot water and detergent. 2. Rinse with acid (e.g., nitric for metals).
ISSN(Online): 2319-8753 ISSN (Print): 2347-6710
I
nternational
J
ournal of
I
nnovative
R
esearch in
S
cience,
E
ngineering and
T
echnology
(A High Impact Factor, Monthly, Peer Reviewed Journal)
Visit: www.ijirset.com
Vol. 7, Issue 5, May 2018
4. Rinse glass containers with an interference-free, redistilled solvent (such as acetone or methylene chloride for extractable organics).
5. Dry in contaminant-free area
ISSN(Online): 2319-8753 ISSN (Print): 2347-6710
I
nternational
J
ournal of
I
nnovative
R
esearch in
S
cience,
E
ngineering and
T
echnology
(A High Impact Factor, Monthly, Peer Reviewed Journal)
Visit: www.ijirset.com
Vol. 7, Issue 5, May 2018
ISSN(Online): 2319-8753 ISSN (Print): 2347-6710
I
nternational
J
ournal of
I
nnovative
R
esearch in
S
cience,
E
ngineering and
T
echnology
(A High Impact Factor, Monthly, Peer Reviewed Journal)
Visit: www.ijirset.com
Vol. 7, Issue 5, May 2018
Sample labeling:
Identify each sample accurately and completely. Use labels or tags to identify the samples that are moisture resistant and able to withstand field conditions. Use a waterproof pen to complete the labels or tags. A numbered label or tag associated with a field sample data sheet containing detailed information on the sample is preferable to using only a label or tag for information1. The information for each sample should include the following:
. Facility name/location . Sample site location . Sample number
. Name of sample collector . Date and time of collection
. Indication of grab or composite sample with appropriate time and volume information . Identification of parameter to be analyzed
. Preservative used.
Wastewater Sample Preservation and Holding Time:
In most cases, wastewater samples contain one or more unstable pollutants that require immediate (e.g., within 15 minutes) preservation and/or analysis. Provide appropriate chemical preservation before transferring samples to the laboratory. Procedures used to preserve samples include cooling, pH adjustment, and chemical treatment. For some parameters such as cyanide and phenols, add preservatives to sample bottles prior to or immediately following sample collection. For many samples, if preservatives are not appropriately used, bacteria can quickly degrade certain constituents (such as phenols and phosphorus). Other constituents may volatilize (such as volatile organics and sulfides) or may react to form different chemical species (hexavalent chromium, for example). Proper preservation and holding times are essential to ensure sample integrity. Analysis of samples within one day ensures against error from sample deterioration. However, such prompt analysis is not feasible for composite samples in which portions may be stored for as long as 24 hours. Where possible, provide sample preservation during compositing, usually by refrigeration to 4°C (or icing). If using an automatic sampler with ice, replace the ice as necessary to maintain low temperatures. This is a particularlimitation of automatic samplers used during the summer when ice must be frequently replaced. The times listed at the table are the maximum holding times between sample collection and analysis that are allowed for the sample to be considered valid. Typically, the holding time limitations begin upon combinationof the last aliquot in a sample. When use of an automatic sampler makes it impossible to preserve each aliquot, the preservation (chemical) should be done immediately following the composite.
Transfer of Custody and Shipment of Samples:
To ensure the validity of the permit compliance sampling data in court, written records must accurately trace the custody of each sample through all phases of the monitoring program. The primary objective of this chain of-custody is to create an accurate written record that can be used to trace the possession and handling of the sample from the moment of its collection through its analysis and introduction as evidence.
. Use sample seals to protect the sample's integrity from the time of collection to the time it is opened in the laboratory. The seal should indicate the collector's name, the date and time of sample collection, and sampleidentification number. . Pack samples properly to prevent breakage. Seal or lock the shipping container to readily detect any evidence of tampering can be readily detected. Use of tamper proof evidence tape is recommended.
. Place samples on ice or synthetic ice substitute that will maintain sample temperature at 4°C throughout shipment. . Accompany every sample with a sample tag and a chain-of-custody record that has been completed, signed, and dated. The chain-of-custody record should include the names of sample collectors, sample identificationnumbers, date and time of sample collection, location of sample collection, and names and signatures of allpersons handling the sample in the field and in the laboratory.
ISSN(Online): 2319-8753 ISSN (Print): 2347-6710
I
nternational
J
ournal of
I
nnovative
R
esearch in
S
cience,
E
ngineering and
T
echnology
(A High Impact Factor, Monthly, Peer Reviewed Journal)
Visit: www.ijirset.com
Vol. 7, Issue 5, May 2018
. When transferring possession of samples, the transferee must sign and record the date and time on the chainof-custody record (use the currently approved record). In general, make custody transfers for each sample, although samples may be transferred as a group, if desired. Each person who takes custody must fill in the appropriate section of the chain-of-custody record.
Quality Control:
Conduct control checks during the actual sample collection to determine the performance of sample collection techniques. In general, the most common monitoring errors usually are improper sampling methodology, improper preservation, inadequate mixing during compositing and splitting, and excessive sample holding time. In addition, collect and analyze the following samples to check sample collection techniques:
Blanks:
1. Trip Blank. This is a sample vial(s) filled at the laboratory with deionized water. The blank(s) follows the same handling and transport procedures as the samples collected during the event. The blank(s) functions as a check on sample contamination originating from sample transport, shipping and from site conditions.
Note: Expose the trip blank vial(s), to the same environmental conditions (i.e., light, temperature, etc.) of the sample vial(s) but do not open until it is time for analysis.
2. Field Blank/Field Reagent Blank. These are similar to the trip blanks except they are prepared in the field with deionized water exactly as the sample(s) that are collected. Field blanks are used to check for analytical artifacts and/or background introduced by sampling and analytical procedures.
3. Equipment/Rinsate Blank. Collect a blank when using an automatic sampler or other non-dedicated equipment during the sampling process. The blank is a check of the equipment cleanliness. For automatic samplers, prepare blanks prior to collecting samples, by pumping deionized organic free water through the sampler and collecting the discharge purge water in a sample container for analysis for the constituents of concern.
Field Duplicate.Collect this sample simultaneously from the same source at selected stations on a random time frame by grab samples or from two sets of field equipment installed at the site. Duplicate samples check analytical precision as well as evaluate the “representativeness” of the sample aliquot.
Split Samples. These are samples that have been divided into two containers for analysis by separate laboratories. These samples provide an excellent means of identifying discrepancies in the permittee’sanalytical techniques and procedures. When filling split samples from a single composite jug, shake the composited sample well and half fill the EPA sample container, then shake the composite again and fill half of the permittee’s container. Repeat the procedure for each parameter collected. The laboratories performing the sample analyses should also use the following control measures:
Prepare/Reagent Blank. A sample consisting of reagent(s), without the target analyte or sample matrix, introduced into the analytical procedure at the appropriate point and carried through all subsequent steps to determine the contribution of the reagents and of the involved analytical steps to error in the observed value.
Quality Control Sample.This is an uncontaminated sample matrix spiked with known amounts of analytesfrom a source independent from the calibration standards. Use this sample to establish intra laboratory or analyst specific precision and bias or to assess the performance of all or a portion of the measurements’ system.
Matrix Spike/Matrix Spike Duplicate (MS/MSD).This sample is three times the normal volume required for a specific chemical analysis to which a known quantity of analyte has been added prior to all sample preparation. The laboratory utilizes the MS/MSD samples as part of their Quality Assurance/Quality Control Program.
. Use a matrix spike to verify accuracy of the analytical procedures.
. A matrix spike duplicate is a duplicate of a matrix spike sample. It measures the precision of the analysis in terms of relative percent difference.
Data Handling and Reporting:
Verified analytical results are normally entered into a laboratory data management system of some type. The system should contain the sampling data, including:
ISSN(Online): 2319-8753 ISSN (Print): 2347-6710
I
nternational
J
ournal of
I
nnovative
R
esearch in
S
cience,
E
ngineering and
T
echnology
(A High Impact Factor, Monthly, Peer Reviewed Journal)
Visit: www.ijirset.com
Vol. 7, Issue 5, May 2018
3. Names of analysts,
4. Analytical methods/techniques used, and 5. Analytical results.
Data are then reported to the project officer for inclusion into the compliance report. Sample Types Two types of sample techniques are used: grab and composite.
Grab Samples: Grab samples are individual samples collected over a period of time not exceeding 15 minutes and are representative of conditions at the time the sample is collected.
The sample volume depends on the type and number of analyses to be performed. The collection of a grab sample is appropriate when a sample is needed to:
1. Sample an effluent that does not discharge on a continuous basis
2. Provide information about instantaneous concentrations of pollutants at a specific time 3. Allow collection of a variable sample volume
4. Corroborate composite samples
5. Monitor parameters not amenable to compositing (e.g., pH, temperature, dissolved oxygen, chlorine,
purgeable organics, oil and grease, coliform bacteria. Volatile organics, sulfides, phenols, and phosphorus samples can be composited. If you composite use special handling procedures.
Composite Samples: Collect these samples over time, either by continuous sampling or by mixing discrete samples, and represent the average characteristics of the waste stream during the compositing period use.
Composite samples are used when:
1. Average pollutant concentration during the compositing period is determined 2. Mass per unit time loadings is calculated
3. Wastewater characteristics are highly variable.
Various methods for compositing samples are available, select one based on either time or flow proportioning.
Table 3 lists the advantages and disadvantages of various methods. The permit may specify which type of composite sample to use. Collect composite samples either manually or with automatic samplers. Inspectorsshould consider variability in waste stream flow rate and parameter concentrations carefully when choosingcompositing methods, sampling equipment (tubing and containers), and quality assurance procedures.
The compositing methods are as follows:
1. Time Composite Sample: This method requires discrete sample aliquots collected in one container at constant time intervals. This method is appropriate when the flow of the sampled stream is constant (flow ratedoes not vary more than 10 percent of the average flow rate) or when flow monitoring equipment is not available.
2. Flow-Proportional Composite Sample: There are two methods used for this type of sample. One method collects a constant sample volume at varying time intervals proportional to stream flow (e.g., 200 milliliters sample collected for every 5,000 gallons of flow). In the other method, collect the sample by increasing the volume of each aliquot as the flow increases, while maintaining a constant time interval between the aliquots.
ISSN(Online): 2319-8753 ISSN (Print): 2347-6710
I
nternational
J
ournal of
I
nnovative
R
esearch in
S
cience,
E
ngineering and
T
echnology
(A High Impact Factor, Monthly, Peer Reviewed Journal)
Visit: www.ijirset.com
Vol. 7, Issue 5, May 2018
IV. EXPERIMENTAL RESULT
EXPERIMENTAL SECTION
Wastewater samples were collected from different locations in the vicinity of different industries at Aligarh. The collected wastewater samples were analyzed for pH, alkalinity, hardness, chlorides, BOD5, COD.[8] Locations from where wastewater was collected and the type of industries in that area:
ISSN(Online): 2319-8753 ISSN (Print): 2347-6710
I
nternational
J
ournal of
I
nnovative
R
esearch in
S
cience,
E
ngineering and
T
echnology
(A High Impact Factor, Monthly, Peer Reviewed Journal)
Visit: www.ijirset.com
Vol. 7, Issue 5, May 2018
Graph 2: Graphical Representation of Observed Values of Alkaliniy
ISSN(Online): 2319-8753 ISSN (Print): 2347-6710
I
nternational
J
ournal of
I
nnovative
R
esearch in
S
cience,
E
ngineering and
T
echnology
(A High Impact Factor, Monthly, Peer Reviewed Journal)
Visit: www.ijirset.com
Vol. 7, Issue 5, May 2018
Graph 4: Graphical Representation of Observed Values of Chlorides
Graph 5: Graphical Representation of Observed Values of BOD5
ISSN(Online): 2319-8753 ISSN (Print): 2347-6710
I
nternational
J
ournal of
I
nnovative
R
esearch in
S
cience,
E
ngineering and
T
echnology
(A High Impact Factor, Monthly, Peer Reviewed Journal)
Visit: www.ijirset.com
Vol. 7, Issue 5, May 2018
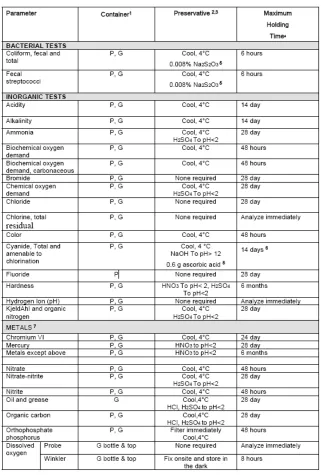
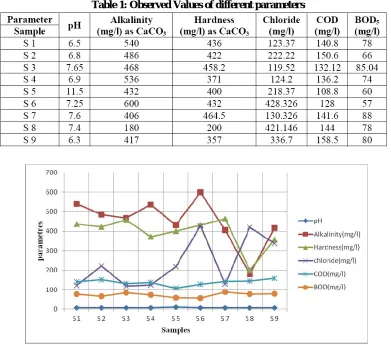
Table 1: Observed Values of different parameters
ISSN(Online): 2319-8753 ISSN (Print): 2347-6710
I
nternational
J
ournal of
I
nnovative
R
esearch in
S
cience,
E
ngineering and
T
echnology
(A High Impact Factor, Monthly, Peer Reviewed Journal)
Visit: www.ijirset.com
Vol. 7, Issue 5, May 2018
BOD5 to COD Ratio
V. CONCLUSION
The final result of sewage treatment is to produce a disposable effluent without causing harm to the surrounding environment, and also prevent pollution. Industries produce large volumes of wastes that may include a wide variety of chemicals containing most toxic pollutants. Some of the industrial wastes can be treated jointly in municipal wastewater treatment plants, but others must be pretreated at the source. The present paper presents the analysis of the wastewater by finding out the values of various target parameters i.e. pH, alkalinity, hardness, chloride, COD and BOD so that wastewater characteristics of the area can be found out with the purpose of modifying the existing treatment scheme for the wastewater treatment being presently used. The pH of sample collected from Pune Tathawade was lowest and its value was 6.3 i.e. more acidic than all other samples. The pH of sample collected from Pune Karvenagar was highest and its value was 11.5 i.e. more basic than all other samples. Sample collected from Tathawade Area reported least alkalinity of 180 mg/l as CaCO3. Sample collected from Karvenagar reported highest alkalinity of 600 mg/l as CaCO3. The highest total hardness level of 464.5 mg/l as CaCO3 was reported from slaughter house existing on Mathura Rd. area. The lowest total hardness value of 200 mg/l as CaCO3 was reported from Pune Area. The highest values of chloride concentration of 428.3 mg/l were reported from Tathawade area. The lowest chloride concentration of 119.5mg/l was reported from Karvenaagr area. The least BOD5 value of 57 mg/l at 20° C was reported at Tathawade Highest BOD5 value of 85.04 mg/l was reported at Pune area.
REFERENCES
[1] Gulp R.L., Gulp G. L., Advanced Waste-water Treatment, Van Nostrand Reinhold Company, New York, 1971. [2] Fair G. M., Geyer J. C., Okun D, A., Water and Wastewater Engineering, vol. II, Wiley, New York, 1968. [3] Metcalf & Eddy, Inc., Wastewater Engineering: Treatment, Disposal and Reuse, 3rd ed., Tata McGraw-Hill, New Delhi, 1998.
[4] Peavy M.S., Rowe D. R. and Tchobanoglous G., Environmental Engineering McGraw-Hill, Singapore, 1985. [5] Pollution Control Acts, Rules and Notification Issued Thereunder, vol. I, Central Pollution Control Board, Delhi,
1998.
[6] Roa M. N., Datta A. K., Wastewater Treatment, 2nd ed., oxford & IBH, New Delhi, 1987.
[7] Sawyer C. N., McCarty P. L., Chemistry for Environmental Engineering, 3rd ed., McGraw-Hill, Singapore, 1989.
[8] Standard Methods for the Examination of Water and Wastewater, 17th ed., American Public Health Association, American water works Association & Water Pollution Control Federation, 1989.
[9] DattatrayaBharti(1), Isub Ali Sayyad(2),G. G. Gaikwad(3), D. R. Taikar(3) and J. Dhore(4) “PHYSICO-CHEMICAL CHARACTERISTICS OF BORE WELL WATER QUALITY IN NAGPUR REGION (SOUTH ZONE)” J. Chem. Pharm. Res., 2011, 3(2):922-927
ISSN(Online): 2319-8753 ISSN (Print): 2347-6710
I
nternational
J
ournal of
I
nnovative
R
esearch in
S
cience,
E
ngineering and
T
echnology
(A High Impact Factor, Monthly, Peer Reviewed Journal)
Visit: www.ijirset.com
Vol. 7, Issue 5, May 2018
[11] ARUNABH MISHRA* and VASISHTA BHATT “PHYSICO-CHEMICAL AND MICROBIOLOGICAL ANALYSIS OF UNDER GROUND WATER IN V.V NAGAR AND NEAR BY PLACES OF ANAND DISTRICT,GUJARAT, INDIA”ISSN: 0973-4945; CODEN ECJHAO E-Journal of Chemistry Vol. 5, No.3, pp. 487-492, July 2008