Viterbi Based Alignment between Text Images and their Transcripts
∗Alejandro H. Toselli, Ver´onica Romero and Enrique Vidal Institut Tecnol`ogic d’Inform`atica
Universitat Polit`ecnica de Val`encia Cam´ı de Vera s/n
46071 - Val`encia, Spain
[ahector,vromero,evidal]@iti.upv.es
Abstract
An alignment method based on the Viterbi algorithm is proposed to find mappings be-tween word images of a given handwrit-ten document and their respective (ASCII) words on its transcription. The approach takes advantage of the underlying segmen-tation made by Viterbi decoding in hand-written text recognition based on Hidden Markov Models (HMMs). Two HMMs modelling schemes are evaluated: one using 78-HMMs (one HMM per character class) and other using a unique HMM to model all the characters and another to model blank spaces. According to various metrics used to measure the quality of the alignments, en-couraging results are obtained.
1 Introduction
Recently, many on-line digital libraries have been publishing large quantities of digitized ancient hand-written documents, which allows the general pub-lic to access this kind of cultural heritage resources. This is a new, comfortable way of consulting and querying this material. The Biblioteca Valenciana Digital(BiValDi)1is an example of one such digital
library, which provides an interesting collection of handwritten documents.
∗
This work has been supported by the EC (FEDER), the Spanish MEC under grant TIN2006-15694-C02-01, and by the
Conseller´ıa d’Empresa, Universitat i Ci`encia - Generalitat Va-lencianaunder contract GV06/252.
1http://bv2.gva.es
Several of these handwritten documents include both, the handwritten material and its proper tran-scription (in ASCII format). This fact has moti-vated the development of methodologies to align these documents and their transcripts; i.e. to gen-erate a mapping between each word image on a doc-ument page with its respective ASCII word on its transcript. This word by word alignment would al-low users to easily find the place of a word in the manuscript when reading the corresponding tran-script. For example, one could display both the handwritten page and the transcript and whenever the mouse is held over a word in the transcript, the corresponding word in the handwritten image would be outlined using a box. In a similar way, whenever the mouse is held over a word in the handwritten im-age, the corresponding word in the transcript would be highlighted (see figure 1). This kind of alignment can help paleography experts to quickly locate im-age text while reading a transcript, with useful ap-plications to editing, indexing, etc. In the opposite direction, the alignment can also be useful for people trying to read the image text directly, when arriving to complex or damaged parts of the document.
Creating such alignments is challenging since the transcript is an ASCII text file while the manuscript page is an image. Some recent works address this problem by relying on a previous explicit image-processing based word pre-segmentation of the page image, before attempting the transcription align-ments. For example, in (Kornfield et al., 2004), the set of previously segmented word images and their corresponding transcriptions are transformed into two different times series, which are aligned
Figure 1: Screen-shot of the alignment prototype interface displaying an outlined word (using a box) in the manuscript (left) and the corresponding highlighted word in the transcript (right).
using dynamic time warping(DTW). In this same direction, (Huang and Srihari, 2006), in addition to the word pre-segmentation, attempt a (rough) recog-nition of the word images. The resulting word string is then aligned with the transcription using dynamic programming.
The alignment method presented here (hencefor-ward called Viterbi alignment), relies on the Viterbi decoding approach to handwritten text recogni-tion (HTR) based on Hidden Markov Models (HMMs) (Bazzi et al., 1999; Toselli et al., 2004). These techniques are based on methods originally introduced for speech recognition (Jelinek, 1998). In such HTR systems, the alignment is actually a byproduct of the proper recognition process, i.e. an implicit segmentation of each text image line is ob-tained where each segment successively corresponds
to one recognized word. In our case, word recogni-tion is not actually needed, as we do already have the correct transcription. Therefore, to obtain the segmentations for thegivenword sequences, the so-called “forced-recognition” approach is employed (see section 2.2). This idea has been previously ex-plored in (Zimmermann and Bunke, 2002).
as-0.3
0.7 0.8
0.2
0.9 0.1
0.8 0.2
[image:3.612.79.535.51.342.2]0.7 0.3
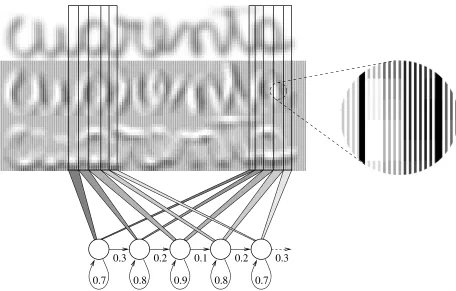
Figure 2: Example of 5-states HMM modeling (feature vectors sequences) of instances of the character “a” within the Spanish word “cuarenta” (forty). The states are shared among all instances of characters of the same class. The zones modelled by each state show graphically subsequences of feature vectors (see details in the magnifying-glass view) compounded by stacking the normalized grey level and its both derivatives features.
signments produced between word images and tran-scriptions (see section 4).
The remainder of this paper is organized as fol-lows. First, the alignment framework is introduced and formalized in section 2. Then, an implemented prototype is described in section 3. The alignment evaluation metrics are presented in section 4. The experiments and results are commented in section 5. Finally, some conclusions are drawn in section 6.
2 HMM-based HTR and Viterbi alignment
HMM-based handwritten text recognition is briefly outlined in this section, followed by a more detailed presentation of the Viterbi alignment approach.
2.1 HMM HTR Basics
The traditional handwritten text recognition problem can be formulated as the problem of finding a most likely word sequence wˆ = hw1, w2, . . . , wni, for
a given handwritten sentence (or line) image rep-resented by a feature vector sequence x = xp
1 =
hx1, x2, . . . , xpi, that is:
ˆ
w= arg max
w
P r(w|x)
= arg max w
P r(x|w)·P r(w) (1)
where P r(x|w) is usually approximated by
concatenated character Hidden Markov Models (HMMs) (Jelinek, 1998; Bazzi et al., 1999), whereas P r(w) is approximated typically by an
b0 b3 b4 b5 b6 bn=7
x1
w1 w3 w4 w5 w6
xp
wn=7
b1 b2
[image:4.612.74.539.66.213.2]w2
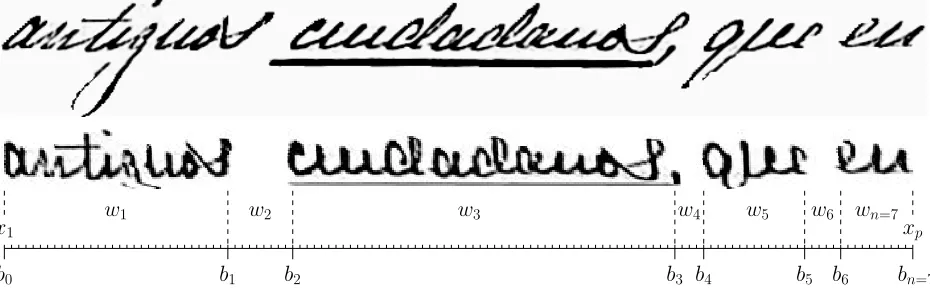
Figure 3: Example of segmented text line image along with its resulting deslanted and size-normalized image. Moreover, the alignment marks (b0. . . b8) which delimit each of the words (including word-spaces)
over the text image feature vectors sequencex.
character “a”. The process to obtain feature vector sequences from text images as well as the training of HMMs are explained in section 3.
HMMs as well as n-grams models can be rep-resented by stochastic finite state networks (SFN), which are integrated into a single global SFN by re-placing each word character of the n-gram model by the corresponding HMM. The search involved in the equation (1) to decode the input feature vectors se-quencexinto the more likely output word sequence
ˆ
w, is performed over this global SFN. This search
problem is adequately solved by the Viterbi algo-rithm (Jelinek, 1998).
2.2 Viterbi Alignment
As a byproduct of the Viterbi solution to (1), the feature vectors subsequences ofxaligned with each
of the recognized wordsw1, w2, . . . , wn can be ob-tained. These implicit subsequences can be visual-ized into the equation (1) as follows:
ˆ
w= arg max
w
X
b
P r(x,b|w)·P r(w) (2)
where b is an alignment; that is, an ordered
se-quence of n+ 1 markshb0, b1, . . . , bni, used to de-marcate the subsequences belonging to each recog-nized word. The marksb0 andbnalways point out to the first and last components ofx(see figure 3).
Now, approximating the sum in (2) by the domi-nant term:
ˆ
w≈arg max
w
max b P r(
x,b|w)·P r(w) (3)
where bˆ is the optimal alignment. In our case,
we are not really interested in proper text recogni-tion because the transcriprecogni-tion is known beforehand. Letw˜ be the given transcription. Now, P r(w) in
equation 3 is zero for all w except w˜, for which
P r( ˜w) = 1. Therefore,
ˆ
b= arg max
b
P r(x,b|w˜) (4)
which can be expanded to,
ˆ
b= arg max
b
P r(x, b1|w˜)P r(x, b2|b1,w˜). . .
. . . P r(x, bn|b1b2. . . bn−1,w˜) (5)
Assuming independence of each bi mark from b1b2. . . bi−1 and assuming that each subsequence xbi
bi−1 depends only ofw˜i, equation (5) can be
rewrit-ten as,
ˆ
b= arg max
b
P r(xb1
b0|w˜1). . . P r(x
bn
bn−1|w˜n) (6)
This simpler Viterbi search problem is known as “forced recognition”.
3 Overview of the Alignment Prototype
Document image preprocessing encompasses the following steps: first, skew correction is carried out on each document page image; then background removal and noise reduction is performed by ap-plying a bi-dimensional median filter (Kavalliera-tou and Stamatatos, 2006) on the whole page im-age. Next, a text line extraction process based on local minimums of the horizontal projection profile of page image, divides the page into separate line images (Marti and Bunke, 2001). In addition con-nected components has been used to solve the situ-ations where local minimum values are greater than zero, making impossible to obtain a clear text line separation. Finally, slant correction and non-linear size normalization are applied (Toselli et al., 2004; Romero et al., 2006) on each extracted line image. An example of extracted text line image is shown in the top panel of figure 3, along with the result-ing deslanted and size-normalized image. Note how non-linear normalization leads to reduced sizes of ascenders and descenders, as well as to a thiner un-derline of the word “ciudadanos”.
As our alignment prototype is based on Hid-den Markov Models (HMMs), each preprocessed line image is represented as a sequence of feature vectors. To do this, the feature extraction mod-ule applies a grid to divide line image into N×
M squared cells. In this work, N = 40 is cho-sen empirically (using the corpus described further on) and M must satisfy the condition M/N = original image aspect ratio. From each cell, three features are calculated: normalized gray level, hor-izontal gray level derivative and vertical gray level derivative. The way these three features are deter-mined is described in (Toselli et al., 2004). Columns of cells or frames are processed from left to right and a feature vector is constructed for each frame by stacking the three features computed in its con-stituent cells.
Hence, at the end of this process, a sequence of M 120-dimensional feature vectors (40 normalized gray-level components, 40 horizontal and 40 vertical derivatives components) is obtained. An example of feature vectors sequence, representing an image of the Spanish word“cuarenta”(forty) is shown in fig-ure 2.
As it was explained in section 2.1, characters are modeled by continuous density left-to-right HMMs
with 6 states and 64 Gaussian mixture components per state. This topology (number of HMM states and Gaussian densities per state) was determined by tun-ing empirically the system on the corpus described in section 5.1. Once a HMM “topology” has been adopted, the model parameters can be easily trained from images of continuously handwritten text ( with-out any kind of segmentation) accompanied by the transcription of these images into the correspond-ing sequence of characters. This traincorrespond-ing process is carried out using a well known instance of the EM algorithm calledforward-backward or Baum-Welch re-estimation(Jelinek, 1998).
The last phase in the alignment process is the gen-eration of the mapping proper by means of Viterbi “forced recognition”, as discussed in section 2.2.
4 Alignment Evaluation Metrics
Two kinds of measures have been adopted to evalu-ate the quality of alignments. On the one hand, the average value and standard deviation (henceforward called MEAN-STD) of the absolute differences be-tween the system-proposed word alignment marks and their corresponding (correct) references. This gives us an idea of the geometrical accuracy of the alignments obtained. On the other hand, the align-ment error rate (AER), which measures the amount of erroneous assignments produced between word images and transcriptions.
Given a reference mark sequence r = hr0, r1, . . . , rni along with an associated to-kens sequence w = hw1, w2, . . . , wni, and a
segmentation marks sequenceb = hb0, b1, . . . , bni (withr0=b0 ∧rn=bn), we define the MEAN-STD and AER metrics as follows:
MEAN-STD:The average value and standard devi-ation of absolute differences between reference and proposed alignment marks, are given by:
µ=
Pn−1
i=1 di n−1 σ=
s
Pn−1
i=1(di−µ)2 n−1 (7)
w1 w2 w3 w4 w5 w6 wn=7
r0 r3 r4 r5 r6 r7
x1 xp
r1 r2
b7
b1 b2 b3 b4 b5 b6
b0
m7
m5
m3
m1
Figure 4: Example of AER computation. In this case N = 4 (only no word-space are considered:
w1, w3, w5, w7) and w5 is erroneously aligned with the subsequence xbb6
5 (m5 ∈/ (b4, b5)). The resulting
AER is 25%.
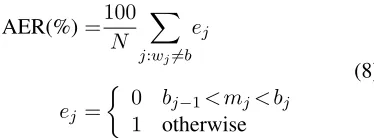
AER:Defined as:
AER(%)=100 N
X
j:wj6=b ej
ej =
½
0 bj−1< mj< bj 1 otherwise
(8)
wherebstands for the blank-space token,N < nis the number of real words (i.e., tokens which are not b, andmj = (rj−1+rj)/2.
A good alignment will have aµvalue close to 0 and smallσ. Thus, MEAN-STD gives us an idea of how accurate are the automatically computed ment marks. On the other hand, AER assesses align-ments at a higher level; that is, it measures mis-matches between word-images and ASCII transcrip-tions (tokens), excluding word-space tokens. This is illustrated in figure 4, where the AER would be 25%.
5 Experiments
In order to test the effectiveness of the presented alignment approach, different experiments were car-ried out. The corpus used, as well as the experiments carried out and the obtained results, are reported in the following subsections.
5.1 Corpus description
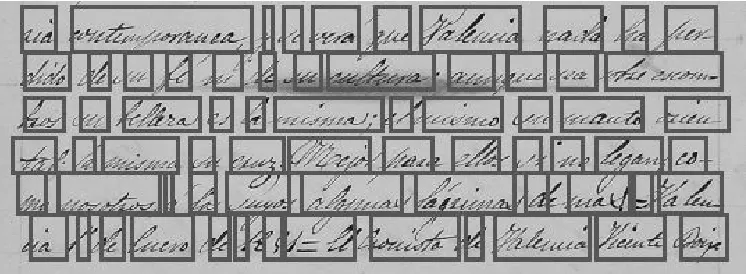
The corpus was compiled from the legacy handwrit-ing document identified as Cristo-Salvador, which was kindly provided by the Biblioteca Valenciana Digital (BIVALDI). It is composed of 53 text page images, scanned at 300dpi and written by only one writer. Some of these page images are shown in the figure 5.
As has been explained in section 3, the page im-ages have been preprocessed and divided into lines, resulting in a data-set of 1,172 text line images. In this phase, around 4% of the automatically ex-tracted line-separation marks were manually cor-rected. The transcriptions corresponding to each line image are also available, containing 10,911 running words with a vocabulary of 3,408 different words.
[image:6.612.72.543.53.175.2]To test the quality of the computed alignments, 12 pages were randomly chosen from the whole corpus pages to be used as references. For these pages the true locations of alignment marks were set manually. Table 1 summarized the basic statistics of this cor-pus and its reference pages.
Number of: References Total Lexicon
pages 12 53 –
text lines 312 1,172 – words 2,955 10,911 3,408 characters 16,893 62,159 78
Table 1: Basic statistics of the database
5.2 Experiments and Results
[image:6.612.109.296.260.329.2]com-Figure 5: Examples page images of the corpus “Cristo-Salvador”,which show backgrounds of big variations and uneven illumination, spots due to the humidity, marks resulting from the ink that goes through the paper (called bleed-through), etc.
ponents per state.
As has been explained in section 4, two different measures have been adopted to evaluate the quality of the obtained alignments: the MEAN-STD and the AER. Table 2 shows the different alignment evalu-ation results obtained for the different schemes of HMM modeling.
78-HMMs 2-HMMs AER (%) 7.20 25.98
µ(mm) 1.15 2.95
σ(mm) 3.90 6.56
Table 2: Alignment evaluation results 78-HMMs and 2-HMMs.
From the results we can see that using the 78 HMMs scheme the best AER is obtained (7.20%). Moreover, the relative low values ofµandσ(in mil-limeters) show that the quality of the obtained align-ments (marks) is quite acceptable, that is they are very close to their respective references. This is il-lustrated on the left histogram of figure 6.
The two typical alignment errors are known as over-segmentation and under-segmentation
respec-tively. The over-segmentation error is when one word image is separated into two or more fragments. The under-segmentation error occurs when two or more images are grouped together and returned as one word. Figure 7 shows some of them.
6 Remarks and Conclusions
Given a manuscript and its transcription, we propose an alignment method to map every word image on the manuscript with its respective ASCII word on the transcript. This method takes advantage of the implicit alignment made by Viterbi decoding used in text recognition with HMMs.
The results reported in the last section should be considered preliminary.
Current work is under way to apply this align-ment approach to the whole pages, which represents a more general case where the most corpora do not have transcriptions set at line level.
References
[image:7.612.178.434.54.305.2]0 2 4 6 8 10 12
0 1 2 3 4 5 6
F
requency
(%)
|Segi−Refi|(mm)
mean
0 1 2 3 4 5 6
0 1 2 3 4 5 6
F
requency
(%)
|Segi−Refi|(mm)
[image:8.612.84.530.60.191.2]mean
Figure 6:|ri−bi|distribution histograms for 78-HMMs (left) and 2-HMMs (right) modelling schemes.
Figure 7: Word alignment for 6 lines of a particularly noisy part of the corpus. The four last words on the second line as well as the last line illustrate some of over-segmentation and under-segmentation error types.
Arabic. IEEE Trans. on PAMI, 21(6):495–504.
Chen Huang and Sargur N. Srihari. 2006. Mapping Tran-scripts to Handwritten Text. In Suvisoft Ltd., editor,
Tenth International Workshop on Frontiers in Hand-writing Recognition, pages 15–20, La Baule, France, October.
F. Jelinek. 1998. Statistical Methods for Speech Recog-nition. MIT Press.
Ergina Kavallieratou and Efstathios Stamatatos. 2006. Improving the quality of degraded document images. InDIAL ’06: Proceedings of the Second International Conference on Document Image Analysis for Libraries (DIAL’06), pages 340–349, Washington, DC, USA. IEEE Computer Society.
E. M. Kornfield, R. Manmatha, and J. Allan. 2004. Text Alignment with Handwritten Documents. InFirst In-ternational Workshop on Document Image Analysis for Libraries (DIAL), pages 195–209, Palo Alto, CA, USA, January.
U.-V. Marti and H. Bunke. 2001. Using a Statistical Lan-guage Model to improve the preformance of an HMM-Based Cursive Handwriting Recognition System. Int.
Journal of Pattern Recognition and Artificial In telli-gence, 15(1):65–90.
V. Romero, M. Pastor, A. H. Toselli, and E. Vidal. 2006. Criteria for handwritten off-line text size normaliza-tion. In Procc. of The Sixth IASTED international Conference on Visualization, Imaging, and Image Pro-cessing (VIIP 06), Palma de Mallorca, Spain, August.
A. H. Toselli, A. Juan, D. Keysers, J. Gonzlez, I. Sal-vador, H. Ney, E. Vidal, and F. Casacuberta. 2004. Integrated Handwriting Recognition and Interpretation using Finite-State Models. Int. Journal of Pattern Recognition and Artificial Intelligence, 18(4):519– 539, June.
[image:8.612.120.493.228.365.2]