DOI: http://dx.doi.org/10.26483/ijarcs.v8i8.4679
Volume 8, No. 8, September-October 2017
International Journal of Advanced Research in Computer Science
RESEARCH PAPER
Available Online at www.ijarcs.info
ISSN No. 0976-5697
CLASSIFICATION OF EEG DATA SET FOR UPPER LIMB MOTOR CONTROL
Tejinder Kaur
Department of Computer Science and Engineering Baba Banda Singh Bahadur Engineering College
Fatehgarh Sahib, India
Prof. Birinder Singh
Department of Computer Science and Engineering Baba Banda Singh Bahadur Engineering College
Fatehgarh Sahib, India
Abstract: Brain-computer interface is a technique which acquires electrical signals from the brain and converts them into corresponding control commands for the external devices. It allows people to interact with machines independent of muscles and enable the paralyzed people to communicate with their environment. In the proposed work the EEG data is collected from 10 different subjects during three basic operations of left/right hand which are i)without any movement with open eye, ii) imagination of opening and closing of left/right hand fist, iii)opening and closing of left/right fist. Research shows that most of the variations in the EEG signals were observed over the sensory motor region. The proposed work is to compare three EEG recordings of hand movement.
Keywords: Brain Computer Interface (BCI); Motor Control; Electroencephalogram (EEG); Amyotrophic Lateral Sclerosis(ALS); Electrocorticogram (ECoG).
I. INTRODUCTION
There are some diseases which lead the patient in the locked-in syndrome. In this condition, the person is cognitively intact but the body is paralyzed. Amyotrophic lateral sclerosis(ALS) is one example of such types of disease or a person can be paralyzed due to some accident like a road accident, radiation accident etc. The main cause of ALS is unknown and this disease does not have any cure. Here the word paralyzed means that person has lost any voluntary control over the muscles, but his or her mind is as active as ours. The patient cannot move their legs, arms or faces. They totally depend upon the artificial respirator. In that state, the patient can communicate effectively with their environment with the help of a device that can read the electrical signals from the brain and can convert them into the corresponding control signals. Such devices are called Brain Computer Interface.
Back in the 60s controlling some electrical devices with the brain waves was considered as the pure science fiction. In 1929, the German Scientist Hans Berger recorded the brain activity from the human scalp, but at that time the technology required for measuring and processing the brain signals are too limited. The BCI is firstly portrayed by Dr. Grey Walter in 1964. He connected the electrodes directly to the motor areas of the patient. The patient was undergoing surgery for other reasons. Then the patient was asked to press a button to advance a slide projector and Dr. Walter was recording the brain activity correspondingly. He found that he had to introduce a delay from the detection of the brain activity until the slide projector advanced because the slide projector would otherwise advance before the patient pressed the button. Unfortunately, Dr. Walter did not publish their work beside of it, he presented a talk about it to a group named the Oster Society in London [6].Later on, the BCI research is developed for many more years.
The natural form of control or conversation needed nerves and movement of muscles. This mechanism begins with the user’s intent. A complex process is prompted by this intent which includes some of the brain areas. As the result of this process, some signals are generated from brain which is used in BCI. A straightforward conversation link between a
human or animal brain and an exterior equipment is called Brain-Computer Interface. It is also known as Brain-Machine Interface or Direct Neural Interface. Basically, Brain Computer Interface is an artificial system that bypasses the body’s normal efferent pathways, which are the neuromuscular output channels. BCI measures brain activity correlated with the user’s intent and converts the recorded brain activity into the corresponding control signals [4]. These converted signals are further used for BCI applications. The translation of electrical brain signals into the signals used by the BCI applications is done by the computer which usually involves signal processing and pattern recognition. Since the measured activity or signals emerge directly from the brain and not originates from the muscles or peripheral devices, the system is called a Brain–Computer Interface.
able to learn to discriminate between different patterns of brain activity carefully. Neuroprostheses is an example of such machine which does not only receive output from the nervous system but also provide input. The BCI user should able perform a different mental activity in order to produce distinct brain signals. The major phases of BCI are:
1. Data Acquisition
2. Signal Processing & Classification 3. Computer Interface
4. Application
A. Early History
In 1875, Richard Caton recorded EEG signals in animals from the cortical surface. Later on, Hans Berger who is a German neuroscientist record the electrical signals from the human brain first time in 1929 using EEG [12]. Alpha Waves are recorded by Berger for the first time. E. Adrian and B. Matthew does an interpretation of the potential waves of the brain within the cortex region [9]. E. Adrian and K. Yamagiwa discovered the location of the EEG signals are varied on the head and the standardized position of electrodes over the head is defined [10]. R. Stanley, D. A. Daniel et al. [15] uses reciprocity theorem to determine sensitivity of EEG signals which helps to find the location and orientation of signal source in the Brain. Later on, in 1970, EEG activities are further explored by the Defence Advanced Research Projects Agency of USA, before the EEG was only used for exploring the brain function and clinical diagnosis.
B. Advancement
D. K. Mejdi, C. Nidhal et al. [7] develop a drowsiness monitoring system which helps to reduce road accidents by estimating the drowsiness level of the driver by the means of EEG (Electroencephalography) signals records. A.Wafa, A. Dalal et al. [3] develop a BCI-based smart home system, which allows a person who suffers from quadriplegia to open/close doors using brain signals only. This further reduces their need for caregivers. Q. Shiyuan, L. Zhijun et al. [14] presents a teleoperation control for an exoskeleton robotic system which is based on the visual feedback and brain-machine interface. The proposed algorithm decodes the EEG signals and then generates control signals for the exoskeleton robot using features extracted from neural activity. A. P. Z. Mohammad, P. Manoranjan proposed a seizure prediction method based on a patient-specific approach by extracting undulated global and local features of preictal and interictal periods of EEG signals [2].
According to Ayurveda, Brahmi a kind of herb, used as the treatment of brain and nervous system disorders, such as epilepsy, neuropathic pain, and helping people to stay calm. W.Piyawan, S. Phakkharawat research to study the results of the consumption of the Brahmi extract whether it affected the human brainwaves and spatial ability. The results were analyzed, after the eight weeks which shows that the volunteers who consumed the Brahmi every day, showed significantly and statistically improving scores of spatial ability test and their brainwaves had also changed. W.Piyawan, S. Phakkharawat et al. [20] makes a conclusion, that the there will be the significant and statistical improvement of the spatial ability by consumption of the Brahmi extract of 300 mg per day for eight weeks.
II. TYPES OF BRAIN COMPUTER INTERFACE
The basic purpose of BCI is to catch the electrical signals that pass between neurons in the brain and convert these signals to the signal that can be sensed by external devices. BCI measures the activities of the brain, then do some computations on it and finally produce the control signals which mirror the user’s intent. To understand how BCI will work, one has to understand how the activities of the brain can be measured. There are several types of brain-computer interfaces which are listed below.
A. Invasive Brain-Computer Interface
The Invasive Brain Computer Interface is mostly used to provide the functionality to paralyzed people. With the help of Invasive BCI one can restore the vision by connecting the brain with external cameras and also restore the use of limbs by using brain-controlled robotic arms and legs. Invasive BCI, requires surgery to implant the mandatory sensors. Invasive BCI requires surgery to implant the mandatory sensors. The method used in the invasive BCI is neurosurgery. The surgery comprises the opening of the skull through a surgical procedure and cutting the membranes which cover the brain. On the surface of the cortex, the electrodes are placed the signals from recorded from these electrodes are known as intracorticalsignals.
Invasive Brain Computer Interface is a type of BCI in which the devices are embedded directly into the brain. Invasive Brain Computer Interface has the highest quality signals. The invasive devices rest in grey matter but these devices are prone to scar tissue build-up, due to which the signals become weaker or can lose when the body reacts to a foreign object in the brain. William Dobell, one of the first scientist who works with the brain-computer interface to restore the sight. Jerry, a man who is blinded in adulthood, William inserted single array BCI containing 68 electrodes into Jerry’s visual cortex and succeeded to restore his vision.
Invasive BCI and Semi-invasive methods have some advantages over non-invasive methods. However, these advantages come with the serious drawback of requiring surgery. Financial Ethical and some other considerations make neurosurgery impractical except for some users who need a BCI to communicate. Even then, some of these users may prefer noninvasive BCI meets their needs. It is also unclear intracortical recordings can provide stable and safe recording over years. Long-term stability may be especially problematic in the case of intracortical recordings. The tissue reactions can be caused by the electrodes which are implanted into cortical tissue which can lead to deteriorating signal quality or even complete electrode failure. Invasive BCIs is difficult because of the cost and risk of neurosurgery.
B. Partially Invasive Brain Computer Interface
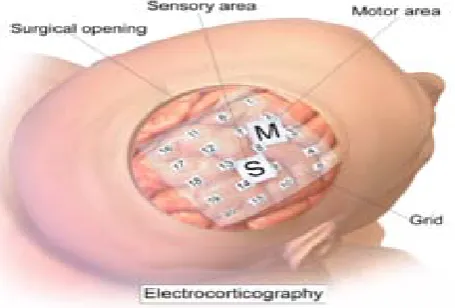
Partially Invasive BCI requires surgery to implant the mandatory sensors. This is a special type of surgery namely, the craniotomy. The surgery comprises the opening of the skull through a surgical procedure and cutting the membranes which cover the brain. On the surface of the cortex, the electrodes are placed, the signals from these electrodes are recorded. The technique which is used to record the electrical signals using invasive BCI is called electrocortciogram(ECoG). ECoG wore the similar technology as electroencephalography, in the case of the non-invasive brain-computer interface. Electrocorticogram(ECoG) technologies were first trade-in humans in 2004.
Figure 1. Electrocorticography (EEG)
ECoG does not damage any neurons because no electrodes penetrate the brain. The ECoG records the integrated activity of a much larger number of neurons that are in the proximity of the ECoG electrodes. However, any invasive technique has better spatial resolution than the EEG. It is also unclear in the case of Partially-invasive brain-computer interface whether it can provide safe and stable recording over years.
C. Non-Invasive Brain Computer Interface
The third type of brain-computer interface is non-invasive brain-computer interface. It has the least signal clarity but it is recognized as very safest when compared to other types of BCI. The non-invasive BCIs device is able to restore the partial movement and give a patient the ability to move muscle implants. Most of the BCIs are dependent upon the electrical measures of the brain activities.
A Non-Invasive technique is one in which the electrodes are placed directly on the desired part of the brain. The devices or sensors are mounted on the headbands or caps which read brain signals. The non-invasive BCI approach record signals less effectively because electrodes are placed over the cap, not on the desired part of the brain.
Electroencephalography (EEG) is very effective method of recoding electrical signals from the scalp.
Electroencephalography(EEG) indicate that electrical activity of the brain is recorded from the scalp with the help of electrodes. It is capable of providing a good temporal resolution. It is moveable, low-cost and easy to use. The types of equipments used in electroencephalography(EEG) are lightweight, inexpensive. A non-invasive BCI based on electroencephalography(EEG) consist of a cap on which electrodes are placed, cables which broadcast the recorded
[image:3.595.56.284.208.362.2]signals from the brain to the signal amplifier, this bio-signal amplifier is a device which convert electrical brain signals from analog to digital format and a computer that operate on the data and controls and run the BCI applications.
Figure 2. A Typical EEG based BCI
However, the EEG is not without disadvantages: The spatial (topographic) resolution and the frequency range are limited. The EEG is susceptible to so-called artifacts, which are contaminations in the EEG caused by other electrical activities. Examples are bioelectrical activities caused by eye movements or eye blinks (electrooculographic activity, EOG) and from muscles (electromyographic activity, EMG) close to the recording sites. External electromagnetic sources such as the power line can also contaminate the EEG. Furthermore, although the EEG is not very technically demanding, the setup procedure can be cumbersome. To achieve adequate signal quality, the skin areas that are contacted by the electrodes have to be carefully prepared with special abrasive electrode gel. Because the gel is required, these electrodes are also called wet electrodes.
The number of electrodes required by current BCI systems ranges from only a few to more than 100 electrodes. Most groups try to minimize the number of electrodes to reduce setup time and hassle. Since electrode gel can dry out and be wearing the EEG cap with electrodes is not convenient or fashionable, the setting up procedure usually has to be repeated before each session of BCI use. From a practical viewpoint, this is one of largest drawbacks of EEG-based BCIs. A possible solution is a technology called dry electrodes. Dry electrodes do not require skin preparations not electrode gel. This technology is currently being researched, but a practical solution that can provide signal quality comparable to wet electrodes is not in sight
at the moment.
III. MOTOR MOVEMENTS
efferent output. Efferent means conveying impulses from the central to the peripheral nervous system and further to an effector (muscle). Afferent, in contrast, describes communication in the other direction, from the sensory receptors to the central nervous system.
C. Maria, C. F. Claudia et al. [5], presents the performance of a Linear Discriminant Analysis Classifier that used EEG data from 3 different subsets of the signal, which was gathered during the execution of 4 upper limb movements. However, the results are promising and further experiments are required to obtain better classification accuracy and to generalize these conclusions.
For motion control, the motor (efferent) pathway is essential. The sensory (afferent) pathway is particularly important for learning motor skills and dexterous tasks, such as typing or playing a musical instrument. Moving a limb or even contracting a single muscle changes brain activity in the cortex[20]. In fact, already the preparation of movement or the imagination of movement also change the so-called sensorimotor rhythms. Sensorimotor rhythms (SMR) refer to oscillations in brain activity recorded from somatosensory and motor areas. Brain oscillations are typically categorized according to specific frequency bands which are named after Greek letters (delta: < 4 Hz, theta: 4–7 Hz, alpha: 8–12 Hz, beta: 12–30 Hz, gamma: > 30 Hz). Alpha activity recorded from sensorimotor areas is also called mu activity. The decrease of oscillatory activity in a specific frequency band is called event-related desynchronization (ERD). Correspondingly, the increase of oscillatory activity in a specific frequency band is called event-related synchronization (ERS). ERD/ERS patterns can be volitionally produced by motor imagery, which is the imagination of movement without actually performing the movement. The frequency bands that are most important for motor imagery are mu and beta in EEG signals. S. Kubra, A. Onder et al. [18], proposed a novel Fast Walsh Hadamard Transform based feature extraction method for classification of EEG signals recorded during right/left hand movement imagery. It does not only provide well-discriminative attributes but also the computational time of extracting the features from a single EEG trial is fast. The obtained satisfactory results proved that this method can be a successful alternative to the existing feature extraction methods. A. M. Javier, M. Luis et al.[1] shows that a decoder can be constructed for the attempt to move the paretic arm of chronic stroke patient, with the help of EEG activity of healthy motor cortex.
Invasive BCIs often also use gamma activity, which is hard to detect with electrodes mounted on the head. ERD/ERS patterns follow a homuncular organization. ERD/ERS patterns produced by motor imagery are similar in their topography and spectral behavior to the patterns elicited by actual movements. And since these patterns originate from motor and somatosensory areas, which are directly connected to the normal neuromuscular output pathways, motor imagery is a particularly suitable mental strategy for BCIs. The way how motor imagery must be performed to best use a BCI can be different. For example, some BCIs can tell if the users are thinking of moving your left hand, right hand, or feet. This can lead to a BCI that allows 3 signals, which might be mapped on to commands to move left, right, and select. G. S. Soumya, A. Sumeet et al. [7] record the imaginary movement of the subject like thinking to move tongue, foot, left or right hand and try to explore the variations that occur in EEG signals and
to find out the regions in the brain where these variations are mostly pronounced. The results show that the positions or regions where these variations are pronounced are not fixed but it varies from person to person.
Another type of motor imagery BCI relies on more abstract, subject-specific types of movements. Over the course of several training sessions with a BCI, people can learn and develop their own motor imagery strategy. In a cursor movement task, for instance, people learn which types of imagined movements are best for BCI control, and reliably move a cursor up or down. Some subjects can learn to move a cursor in two or even three dimensions with further training. O. Urra, A. Casals et al.[12] investigate whether visual feedback can modify upper limb control structure. After performing the experiment the result shows that visual feedback can modify the control structure towards the optimized motor patterns but the magnitude of the improvement varied from person to person. S. Aiqin, F. Binghui, et al. [16], planned for the characters of EEG signal due to motor imagery. And an online control system for upper limb prosthesis based on motor imagery EEG is realized, which consists of the brain-computer interface (BCI) unit, the motion controller and the objective. The results provide a new idea for designing the online robot control system based on EEG, which can further promote the development and application of EEG control technology in the field of rehabilitative and service robot.
IV. DATA ACQUISITION
There are various techniques to acquire data from the subject. In BCI the data can be collected in many ways but the non-invasive way to acquire data is widely used. The data set contains the multiple recordings from different subjects. Data is collected for the hand movements which are:
• Steady state with eyes open: When the subject is not making any movement but only the eyes of the subject are blinking.
• Imaginary movement of opening and closing of left/right fist: When the subject is thinking to make movement in the left/right fist.
• Opening and closing of left/right fist: When the subject is actually performing the movement that is opening and closing of left or right fist.
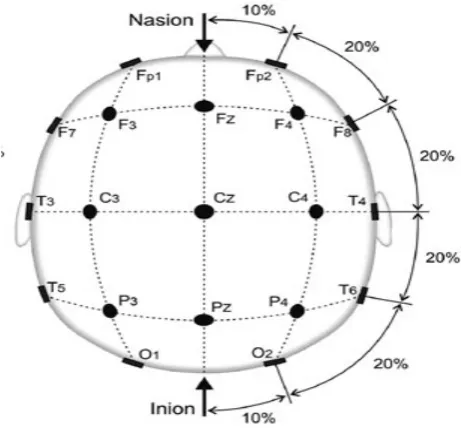
Electroencephalography(EEG) data is collected by placing various channels over the head. To get the consistent recordings from the brain the electrodes are placed over the specific area of the brain. Mostly scientist rely on the standard system to place the electrode accurately. This standard system is known as the 10-20 system. This standard system is widely used in the clinical EEG recordings, Electroencephalography and Brain Computer Interface research.
The study shows that the most prominent regions in the brain are the regions where the variations in the electrical signals occur. The positions where the variations occur are not fixed but they vary from person to person.
Figure 3. Standard 10-20 System
The label letters indicate the brain region where the electrodes are placed. O- occipital, P- parietal, T-temporal, C-central, F- frontal, Fp- pre-frontal. The electrode C3 record the motor movements from the right hand and the electrode C4 record the motor movement from the left hand. The electrode Cz record the motor movements from feet. But it is not possible to distinguish between the left and right feet. Because Electroencephalography(EEG) records the electrical signals from the scalp which have the weak signal strength and also the origins of the left and right feet movements are very close to each other.
V. EEG DATA PREPROCESSING
Electroencephalography (EEG) is a non-invasive technique for recording electrical cerebral activity from the human brain. EEG is a very important tool to investigate neurological disorder such as tumor, sleep disorder. But it comes with some of the disadvantages. As the signals are recorded from the scalp so the Electroencephalography recordings are easily susceptible to the artifacts. The signals which are not originated from the cerebral are called artifacts like; eye blink artifact, muscle activity, eye movement, pulse etc. Signals are corrupted by these types artifacts. Among all the artifacts the eye blink artifacts the most prominent. There are several techniques for the removal of the eye blink artifact such as Principal Component Analysis, Independent Component Analysis, Linear Regression Analysis, Wavelet Transform, Canonical Correlation Analysis. The EEG data should be preprocessed before using it for feature extraction. X. Ran, D. Lei, et al. [21], presents study, to investigate the topic using noninvasive human EEG. Several classifiers were chosen to explore their capability in capturing the spectral PC features to decode individual finger movements pair wisely from one hand using noninvasive EEG, aiming to investigate the efficacy of these spectral features in a decoding task. The
data acquired using EEG can be used to classify the left-right hand movement[19].
VI. RESULT A. Mean
It refers to the central tendency of data. It is calculated by dividing the sum of all the data items by the total number of data items.
(1)
x= data items
[image:5.595.309.564.147.346.2]n=Total number of data items
Figure 4. Mean Result for Left Hand
Figure 5. Mean Result for Right Hand
B. Root Mean Square
The RMS value can be defined as the continuously varying function this variation is in the term of instantaneous values square. To find the RMS value of given data firstly find the square of data and then the arithmetic mean of data. It is also known as the quadratic mean.
(2)
Where,
[image:5.595.307.564.387.531.2]Figure 6. Result of RMS value for Left Hand
Figure 7. Result of RMS value for Right Hand
C. Covariance
It performs analysis on two random variables for the joint variability in the other words the covariance is the measure of two random variables joint variability. It shows the linear relationship between two random variables.it can be of two types.
i) Positive covariance:
If the two random variable shows the similar behavior as the greatervalue of one variable is correspond to the greater value of another variable and the lesser value of one variable is correspond to the lesser value of another variable.
ii) Negative covariance:
It is opposite to the positive covariance in which greater value of one variable correspond to the lesser value of the another variable and same hold for the lesser value of one variable.
(3)
Where,
x = Independent Variable y = Dependent Variable n = Total number of data items
Figure 8. Covariance Result for Left Hand
[image:6.595.301.560.56.185.2]
Figure 9. Covariance Result for Right Hand
D. Variance
It is the central quantity in the field of statistics. It mainly finds out how far the data is scattered out from the mean.
(4)
[image:6.595.46.555.225.360.2]µ = mean of data items n = total number of data items
[image:6.595.307.568.514.668.2]Figure 11. Variance Result for Right Hand
E. Standard Deviation
It can be calculated by squaring the variance. It shows the dispersion of data set values. A low standard deviation value indicates that the resultant value are closer to the expected value a high value of standard deviation indicates that resultant values are spread out over a wide range. Unlike the variance, the standard deviation is expressed in the same unit as of the data. It is commonly used to measure the confidence in the statistical conclusion.
(5)
µ = mean of data items n = total number of data items
[image:7.595.38.289.373.582.2]
Figure 12. Result of Standard deviation for Left Hand
[image:7.595.40.298.613.751.2]
Figure 13. Result of Standard deviation for Right Hand
T-test is used to compare two population and check whether there is any significance or the reliable difference between the means of two population.by simply looking at the means it may show a difference but it is not sure that it is a reliable difference. T-test is the inferential statistics which allows making inference about the population beyond the data given. For this two hypothesis are assumed.
i) Null-hypothesis:
Null-hypothesis assume that there is no difference between the variance of two groups or we can say that two groups are same. If the calculated t-value is less then the critical t-value we reject the null hypothesis and conclude that there is no difference between the groups.
(6)
ii) Alternate- hypothesis:
In Alternate-hypothesis we assume that the two groups are not same, there is difference between the variance of two groups. If the calculated t-value is less than the critical t-t-value we accept the alternative hypothesis and conclude that there is a significance difference between the groups.
(7)
• t-value:
In the t-test, t-value plays a very important role. It is probability, which indicates that t-value is fallen under a certain range. The t-value is very useful in the t-test because it is used to determine if there is any significant difference between two populations or it is just by chance. In this work t value is check at the confidence level of 90%. The t- value is calculated by the following formula.
(8)
(9)
Where
= mean of sample 1 = mean of sample 2
= total number of EEG recordings in sample 1 = total number of EEG recordings in sample 2 = variance of sample 1
= variance of sample 2
(10)
(11)
Where = sample 1 = sample 2
Table I. Result of T- Test for left Hand
Left Hand
Steady and Imaginary movement
Steady and actual movement
Imaginary and actual movement
H-Value 0 0 1
Calculated T-Value
1.964 2.978 0.529
Table II. Result of T- Test for Right Hand
Right Hand
Steady and Imaginary movement
Steady and actual movement
Imaginary and actual movement
H-Value 0 0 1
Calculated T-Value
2.056 1.743 1.281
The above table shows the result of t-test at Confidance level of 90% and Critical t-value = 1.645
VII. CONCLUSION
Brain computer Interface is a technique which enable the paralyzed people to communicate with their environment. It records the electrical signals from the brain and converts them into the corresponding control command for the external attached devices. Every movement of the body generates corresponding electrical signals even if someone is thinking. This paper tries to explore the variation with three different activities of the hand. Which are a steady state of hand, an imaginary movement for opening and closing of left or right fist and opening and closing of left and right fist. The EEG recordings are taken from hand movement. Various parameters are applied on the EEG recordings and the result shows that there is specific difference between the steady state of hand as compared to the imaginary movement or actual movement of hand while the imaginary movement and the actual movement of the hand are similar to each other.
VIII. ACKNOWLEDGEMENT
I would like to thank Dr. BALJIT SINGH KHEHRA (Head of Computer Science and Engineering Department) for his valuable advice and for providing necessary infrastructure for the research work and helping me to write this paper. I would also like to thank my guide Prof. BIRINDER SINGH for his constant support and valuable suggestions.
REFERENCES
[1] A. M. Javier, M. Luis, B. Niels, M. Javier, “Decoding Upper Limb Movement Attempt from EEG Measurements of the Contralesional Motor Cortex in Chronic Stroke Patients”, IEEE Transaction on biomedical engineering, Vol. 20, No. 20, pp. 1-13, July 2015.
[2] A.P. Z. Mohammad, P. Manoranjan, “Seizure Prediction Using Undulated Global and Local Features”, Vol. 64,
[3] A. Wafa, A. dalal, A. Amenah, “Smart home: toward daily use of BCI-based systems”, 2017 International Conference on Informatics, Health & Technology (ICIHT), pp.1-5, 2017.
[4] B. Benjamin, D. Guido, “The Berlin Brain–Computer Interface: EEG-Based Communication Without Subject Training”, IEEE transactions on neural system and rehabilitation engineering, vol. 14, no. 2, pp. 147-152, 2006.
[5] C. C. Ricardo, C. Maria, C. F. Claudia, “Classification of Executed Upper Limb Movements by Means of EEG”, Electrical Engineering Department Centro Universitário da FEI São Bernardo do Campo, Brazil, pp. 415-421. 2013.
[6] D.C. Dennett, Consciousness explained, Back Bay Books, Lippincott Williams & Wilkins, 1992.
[7] D. K. Mejdi, C. Nidhal, W. Ali, A. M. Adel, “Towards an automatic drowsiness detectionsystem by evaluating the alpha band of EEG signals”, Applied Machine Intelligence and Informatics (SAMI), pp. 000371 – 000376, 2017.
[8] E. Abbas, G. Mahdi, “EEG Signals can be used to detect the voluntary hand neural network movements by using an enhanced resource-allocating”, Proceedings of the 23rd Annual EMBS International Conference, October 25-28, Istanbul, Turkey, pp. 721-724, 2001.
[9] E. Adrian and B. Matthews, “The interpretation of potential waves in the cortex,” Journal of Physiology, vol. 81, pp. 440-471, 1934.
[10] E. Adrian and K. Yamagiwa, “The origin of the Berger rhythm,” Brain, vol. 58, p. 323–351, 1935.
[11] G. S. Soumya, A. Sumeet, “Classification and Analysis of EEG signals for Imagined Motor Movements”, Department of Electrical Engineering Indian Institute of Technology Delhi, India, pp. 1-7, 2015.
[12] H. Berger, “Uber das Elecrtenkphalogramm des Menchen,” Arch Psychiat Nervernkr, vol. 87, pp. 527-570, 1929.
[13] O. Urra, A. Casals, R. Jane, “The Impact of Visual Feedback on the Motor Control of the Upper-Limb”, BarcelonaTech and Institute for Bioengineering of Catalonia, pp. 3945-3948, 2015.
[14] Q. Shiyuan, L. Zhijun, H. Wei, Z. Longbin,Y.Chenguang, S. Chun-Yi, “Brain–Machine Interface and Visual Compressive Sensing-Based Teleoperation Control of an Exoskeleton Robot”, IEEE Transactions on Fuzzy Systems, Vol. 25,
[15] R. Stanley, D. A. Daniel,
205, 1969.
[16] S. Aiqin, F. Binghui, J. Chaochuan, “Motor imagery EEG-based online control system for upper artificial limb”, International Conference on Transportation, Mechanical, and Electrical Engineering (TMEE), Changchun, China, pp. 1646- 1649, December 16-18, 2011.
Electroencephalography”
[18] S. Kubra, A. Onder, O. Mehmet, “Classification of EEG Signals Recorded During Right/Left Hand Movement Imagery Using Fast Walsh Hadamard Transform Based Features”, Department of Electrical and Electronics Engineering Karadeniz Technical University Trabzon, Turkey, pp. 413-416, 2016.
[19] W.Fei, K. Kijun, W. Shiguang, Z. Yuzhong, W. Chengdong, “ EEG Based Automatic Left-right hand Movement Classification” , 24th Chinese Control and Decision Conference (CCDC), pp. 1469-1472, 2012.
[20] W.Piyawan, S. Phakkharawat, “Effect of Brahmi extract on human brainwaves”, 2017 International Conference on Digital Arts, Media and Technology (ICDAMT), pp. 364 – 368,2017
[21] X. Ran, D. Lei, “Classification of Finger Pairs from One Hand Based on Spectral Features in Human EEG”, Center for Biomedical Engineering, University of Oklahoma, Norman, pp. 1263-1266, 2014.
[22] Y.Yutao, Z. Xiaodong, “Study on Pattern Recognition of EEG Based on Imagination and Hand Movement” , Proceedings of the IEEE International Conference on Robotics and Biomimetics, Guilin, China, pp. 1307- 1311, December 19 -23, 2009.