Retrieval of Photos From Twitter Database Using
Clustering Algorithms
1
M.Vadivukarassi, 2N. Puviarasan, 3P. Aruna
Department of Computer Science and Engineering, Annamalai University, Chidambaram, India, Department of Computer Science and Engineering, Annamalai University, Chidambaram, India, Department of Computer Science and Engineering, Annamalai University, Chidambaram, India,
Abstract—The main objective of this paper is to retrieve the photos from the Twitter photo database using
different clustering algorithms. It is the novel approach of feature extraction technique which is based on combination of SIFT descriptor, color histogram and tamura texture features. The extracted features are then clustered using different clustering algorithms such as k-means, spectral and Self Organizing Map. The clusters are used to retrieve photos relevant to the input query. In this work, real-time Twitter photos are downloaded and saved in the photo database. This research work discusses a comparative analysis of various feature extraction techniques with different clustering algorithms for photo retrieval. The experimental results of this work shows that the performance of SOM clustering algorithms with proposed combination of Color Histogram, Tamura, SIFT (proposed CH_T_SIFT) feature extraction method gives better accuracy compared to other existing methods.
Keywords—color histogram, k-means , spectral, SIFT, SOM, tamura texture
I. INTRODUCTION
Twitter photo retrieval is the fast growing and challenging research area which focuses at developing new techniques that support effective searching and browsing of large digital social media photos. It is a fast growing research area situated at the intersection of databases, information retrieval and computer vision. Meanwhile, the next important phase today is focused on clustering techniques. Clustering algorithms can offer superior organization of multidimensional data for effective retrieval process. Clustering algorithms allow a nearest neighbor search to be efficiently performed and hence, the Twitter photo retrieval is rapidly gaining more attention among the researchers in the field of data mining, information retrieval and multimedia databases.
II. RELATEDWORKS
They introduced color SIFT approach for the purpose of combining both color and local object features descriptor contrasting to the common existing methods (gray SIFT). The evaluation results show high performance of color SIFTS when compared with gray SIFT descriptors in terms of processing time and accuracy rate [1]. A content primarily based image retrieval (CBIR) system is proposed and exploitation of local color and texture options of chosen image sub-blocks and world color and form options of the image. The image sub-blocks are roughly known by segmenting the image into partitions of different configuration, finding the sting density in every partition
exploitation edge thresholding, morphological dilation and finding the corner density in every partition [2]. The advantage of content-based image retrieval system, as well as key technologies is introduced. Compare to the shortcoming that only certain one feature is used in the traditional system, this work introduces a method that combines color, texture and shape for image retrieval and shows its advantage [3].
A self-organising map (SOM) algorithm is proposed as a solution to a new multi-goal path planning problem for active perception and data collection tasks. They optimize paths for a multi-robot team that aims to maximally observe a set of nodes in the environment. The selected nodes are observed by visiting associated viewpoint regions defined by a sensor model. The key problem characteristics are that the viewpoint regions are overlapping polygonal continuous regions, each node has an observation reward, and the robots are constrained by travel budgets. The SOM algorithm jointly selects and allocates nodes to the robots and finds favourable sequences of sensing locations [6].
III. PROPOSEDWORK
The main goal of this paper is to collect the photos from the social media such as Twitter and saved it in the Twitter photo database. Then the features of the photos are extracted and the results are displayed according to the human expectations based on clustering algorithm. The block diagram of the proposed photo retrieval method is shown in Fig.1. There are three modules employed in the proposed work. They are Twitter photo database collection, feature extraction methods and photo clustering. This research work addresses the effective and efficient photo retrieval by presenting a novel indexing and retrieval methodology that integrates SIFT, color histogram, tamura texture information and proposed feature extraction techniques such as proposed CH_SIFT (combination of Color Histogram and SIFT features), proposed CH_T_SIFT (combination of Color Histogram, Tamura textures and SIFT features) are used for the indexing and retrieval using different clustering algorithms. In order to further improve the retrieval efficiency, a different clustering technique is employed and compared to significantly save query processing time without compromising the retrieval precision.
Fig.1. Block diagram of the proposed work
A. Photo database collection from Twitter
Photo database is a collection of photos, typically associated with the activities of one or more related organizations. It focuses on the organization of photos and its metadata in an efficient manner. Fig 2 displays the sample photos in the database.
Fig. 2. Sample input photos
The first part of our proposed work deals with collecting photos from social media website. Here, Twitter is used as the social media website for collecting the photos based on the keyword. For example ‗fire‘ is the keyword given to download the fire related photos in Twitter website. The downloaded photos are saved separately in the database.
B. Feature Extraction methods
The second module of the work deals with feature extraction. Feature extraction involves reducing the amount of resources required to describe a large set of data. The analysis with a large number of variables generally requires a large amount of memory and computation power and it may cause a classification algorithm to over fit the training samples and generalize poorly to the new samples. This is a general term for methods of constructing combinations of the variables to get around these problems while still describing the data with sufficient accuracy. Color histograms, Tamura texture and SIFT are the feature extraction methods used to extract the salient features of the photos.
1. Color Histogram
process is called color quantization. The final step is to obtain the color histogram using bin values.
2. Tamura(T) Features
Texture analysis aims in finding a unique way of representing the underlying characteristics of textures and represent them in some simpler but unique form, so that they can be used for robust, accurate classification and segmentation of objects. In this paper, Tamura features are formulated to obtain statistical texture features. Tamura features are an approach that explores texture representation from a different angle since it is motivated by the psychological studies on human visual perception of textures. There are 6 kinds tamura features: coarseness, contrast, directionality, line likeness, regularity and roughness. They are explained as follows:
a)Coarseness
Contrast is used to measure the photo quality in the narrow sense. This feature refers to the difference in intensity between neighboring pixels. A texture of high contrast has large difference in intensity between neighboring pixels whereas a texture of low contrast has small difference. the fourth moment of the photo.
c)Directionality
This feature refers to the shape of texture primitives and their placement rule. A directional texture has one or more recognizable orientation of primitives. Directionality (𝑓𝑑𝑖𝑟) is calculated as follows:
This feature is used to find the shape of texture primitives. A line-like texture has straight or wave-like primitives whose orientation may not be fixed. It is a directional features. matrix of points at a distance d.
e)Regularity
This refers to the variations of the texture-primitive placement. A regular texture consists of identical and similar primitives which are regularly or almost regularly arranged whereas an irregular texture consists of various primitives which are irregularly or randomly arranged. Regularity (𝑓𝑟𝑒𝑔) 𝑖𝑠 𝑐𝑎𝑙𝑐𝑢𝑙𝑎𝑡𝑒𝑑 𝑎𝑠
𝑓𝑟𝑒𝑔 = 1 − 𝑟(𝜎𝑐𝑟𝑠 + 𝜎𝑐𝑜𝑛 + 𝜎𝑑𝑖𝑟 + 𝜎𝑙𝑖𝑛) (5)
Where 𝑟a normalizing is factor and 𝜎𝑥𝑥𝑥𝑥 means the standard deviation of𝑓𝑥𝑥𝑥.
f) Roughness
This refers to tactile variations of physical surface. A rough texture contains angular primitives, while a smooth texture contains rounded blurred primitives. Roughness (𝑓𝑟𝑔 ) is calculated as
𝑓𝑟𝑔 = 𝑓𝑐𝑟𝑠 + 𝑓𝑐𝑜𝑛 (6) After, above 6 tamura parameters are computed. Then, the proposed feature extraction technique SIFT descriptor, color histogram and tamura features are combined.
3. SIFT
Scale-invariant feature transform (SIFT) is an existing algorithm in computer vision to detect and describe local features in photos. SIFT detects and uses a much larger number of features from the photos, which reduces the contribution of errors caused by these local variations in the average error of all feature matching errors [8]. The steps of the SIFT algorithm is explained below.
Step 1: SIFT octaves are generated by constructing a scale space using, which are equivalent to laplacian of Gaussians and it can be calculated using the formula,
Step 3: Then, key points of objects are first extracted with Taylor expansion from a set of reference photos and stored in a database. A photo is recognized by individually comparing each feature from the new photo to this database and finding candidate matching features based on Euclidean distance of their feature vectors. From the full set of matches, subsets of key points that agree on the object and its location, scale and orientation in the new photo are identified to filter out good matches.
Step 4: Finally the probability that a particular set of features indicates the presence of an object is computed, given the accuracy of fit and number of probable false matches.
4. Proposed CH_SIFT (Combination color histogram and SIFT features)
In this proposed work, the combinations of color histogram and SIFT features were used to extract the features of the photos. So it is called as proposed CH_SIFT. Here, color histogram and SIFT are used to extract the features of the photos individually and these extracted features are combined together by finding the average to produce the proposed CH_SIFT features.
5. Proposed CH_T_SIFT (Combination color histogram, tamura textures and SIFT features)
In this proposed work, the combinations of color histogram, tamura texture and SIFT features were used to extract the features of the photos. So it is called as proposed CH_T_SIFT. Here, color histogram, tamura and SIFT are used to extract the features of the photos individually and these extracted features are combined together by finding the average to produce the proposed CH_T_SIFT features.
C. Photo Clustering
The next module in the proposed work is photo clustering. The clustering techniques are used to cluster individual pixels into groups that exhibit homogeneous properties, so that photo within each cluster is similar in content. Clustering algorithms provide a useful tool to explore data structures. In this research work, three different clustering algorithms are used for photo retrieval. To select the suitable clustering algorithm for photo retrieval, spectral clustering, K-means and self-organizing map (SOM) are applied to cluster the extracted features.
1. Spectral clustering
The spectral clustering methods are easy to implement and reasonably fast especially for sparse data sets up to several thousands. It treats the photo clustering as a graph
partitioning problem without making any assumption on the form of the photo clusters. It makes use of spectral-graph structure of an affinity matrix to partition data into disjoint meaningful groups. It requires robust and appropriate affinity graphs as input in order to form clusters with desired structures. Constructing such affinity graphs is an on trivial task due to the ambiguity and uncertainty inherent in the raw data [9]. The algorithm 1 shows the steps involved in spectral clustering.
2. K-Means Clustering
K-means clustering is one of the clustering techniques. It partitions a collection of data into a K number group of data [10]. Here, let P(x, y) be an input pixels to cluster and ck be the cluster centers. It classifies a given set of data into K number of disjoint cluster. K-means algorithm consists of two separate phases. In the first phase it calculates the K centroid. Once the clustering is done it recalculates the new centroid of each cluster and based on that centroid, a new Euclidean distance is calculated between each centre and data point. The centroid for each cluster is the point to using Self-organizing neural networks. SOM operates in two modules: i) Training builds the map using input. ii) Mapping automatically classifies a new input vector. The
𝑐𝑘= 1
𝑘 𝑦𝜖 𝑐𝑘 𝑥𝜖 𝑐𝑘𝑃(𝑥, 𝑦)
Algorithm 2:K-means clustering algorithm
Input: Number of clusters K and the data set
Output: Centroid of each of the k clusters
Method:
Step 1: Initialize number of cluster k and centre.
Step 2: For each extracted feature in the proposed combination method,
Step 3: Calculate the Euclidean distance between the centre and each pixel of an photo using the relation given below.
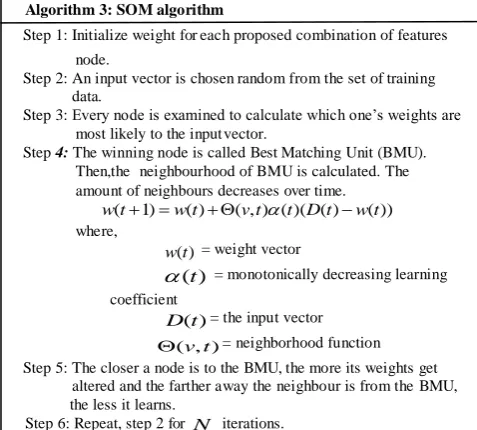
algorithm 3 shows the steps involved in SOM clustering algorithm.
The procedure for placing a vector from data space onto the map is to find the node with the closest weight vector to the data space vector. Initially the weights and learning rate are initialized. The input data to be clustered are presented to the network. Once the input vectors are given, based on the initial weights, the winning node called Best Matching Unit (BMU) is calculated either by Euclidean distance method or sum of products method. Based on the best matching unit selection, the weights are updated for that particular BMU using competitive learning rule.
D. Performance measure
Performance is measured with three factors: Precision, Recall and Accuracy. Precision is ratio of the number of relevant photo retrieved and total number of photo retrieved. Precision is denoted by P.
𝑃𝑟𝑒𝑐𝑖𝑠𝑖𝑜𝑛 =𝑁𝑢𝑚𝑏𝑒𝑟 𝑜𝑓 𝑅𝑒𝑙𝑒𝑣𝑎𝑛𝑡 𝑝𝑜𝑡𝑜 𝑟𝑒𝑡𝑟𝑖𝑒𝑣𝑒𝑑
𝑇𝑜𝑡𝑎𝑙 𝑛𝑢𝑚𝑏𝑒𝑟 𝑜𝑓 𝑝𝑜𝑡𝑜 𝑟𝑒𝑡𝑟𝑖𝑒𝑣𝑒𝑑 𝑋100 (10)
Second factor, recall is ratio of number of relevant photo retrieved and total number of photo retrieved.
𝑅𝑒𝑐𝑎𝑙𝑙 = mean of recall and its inverse.
𝐴𝑐𝑐𝑢𝑟𝑎𝑐𝑦 𝐴 =𝑃𝑟𝑒𝑐𝑖𝑠𝑖𝑜𝑛 +𝑅𝑒𝑐𝑎𝑙𝑙
2 (12)
IV. RESULTANDDISCUSSION
In this research work, 100 photos are collected from social media websites Twitter related to keywords such as ―rain‖, ―cyclone‖, ―fire‖, ―rainbow‖ and ―tree‖ individually in Chennai, Tamilnadu, India in the month of December 2016. The downloaded photos are saved in the photo database. Here, various feature extraction methods were used and implemented. In this proposed work, the two proposed method CH_SIFT and CH_T_SIFT are used and compared their performance measures with the existing feature extraction methods. Experiments are conducted on exclusive color histogram (CH), tamura (T) features, SIFT features, proposed CH_SIFT and proposed CH_T_SIFT respectively. Here, various feature extraction methods and clustering algorithms are implemented for retrieval of relevant photos based on the query. In this work, experiments are conducted on the proposed feature extraction methods and three different clustering algorithms to cluster the similar extracted features of the photos. To evaluate performance of the proposed system different categories of photos are used.
Table 1 shows that the precision and recall values for the proposed CH_SIFT feature extraction method with all 3 clustering algorithms, it is found that self-organizing map gives better performance than other spectral and K-means clustering algorithms. Similarly in Table 2 displays the precision and recall values for the proposed CH_T_SIFT feature extraction method with all 3 clustering algorithms respectively. In Table 3 the average precision values for exclusive color histogram, tamura, SIFT feature, proposed CH_SIFT and proposed CH_T_SIFT feature extraction method with SOM clustering algorithms are 76.3%, 66.7%, 80.3%, 85.9% and 87.7% respectively. From Table 3, it found to be that SOM with proposed CH_T_SIFT contains better precision values compared with other methods.
TABLE 1. PRECISION AND RECALL VALUES FOR EACH CATEGORY USING PROPOSED CH_SIFT FEATURE EXTRACTION METHOD WITH CLUSTERING ALGORITHMS
Step 1:Initialize weight for each proposed combination of features
node.
Step 2:An input vector is chosen random from the set of training data.
Step 3:Every node is examined to calculate which one‘s weights are
most likely to the input vector.
Fire 89.2 79.4 80.1 69.6 91.9 82.6
Rainbow 77.6 69.1 69.9 60.2 90.1 80.4
Tree 89.5 78.7 84.7 74.5 95.4 84.5
TABLE 2. PRECISION AND RECALL VALUES FOR EACH CATEGORY USING PROPOSED CH_T_SIFT FEATURE EXTRACTION METHOD WITH CLUSTERING ALGORITHMS
Collected Photos
Spectral K-means SOM
Precision (%)
Recall (%)
Precision (%)
Recall (%)
Precision (%)
Recall (%)
Rain 86.7 76.4 71.8 63.3 77.0 67.9
Cyclone 75.9 66.9 65.5 58.6 79.3 69.9
Fire 92.5 81.6 82.7 70.5 93.3 83.2
Rainbow 80.5 71.0 71.6 63.1 92.5 81.6
Tree 91.7 80.9 86.7 76.4 96.5 85.1
TABLE 3. AVERAGE PRECISION VALUES FOR ALL FEATURE EXTRACTION METHODS WITH DIFFERENT CLUSTERING ALGORITHMS
TABLE 4. AVERAGE RECALL VALUES FOR ALL FEATURE EXTRACTION METHODS WITH DIFFERENT CLUSTERING ALGORITHMS.
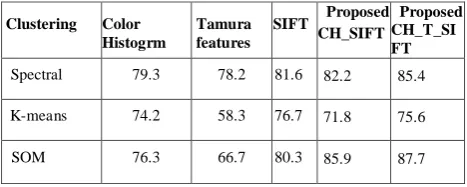
Similarly, in Table 4 the average recall values for exclusive color histogram, tamura, SIFT , proposed CH_SIFT and proposed CH_T_SIFT feature extraction method with SOM clustering algorithms are 70.5%, 59.2%, 74.1%, 76.1% and 77.5% respectively. From Table 4, it found to be that SOM with proposed CH_T_SIFT contains better recall values compared with other methods. From the Table 3 & Table 4, it is inferred that the proposed CH_T_SIFT feature extraction with SOM clustering gives better performance than exclusive of feature extraction methods.
Fig.3. Accuracy values for feature extraction methods
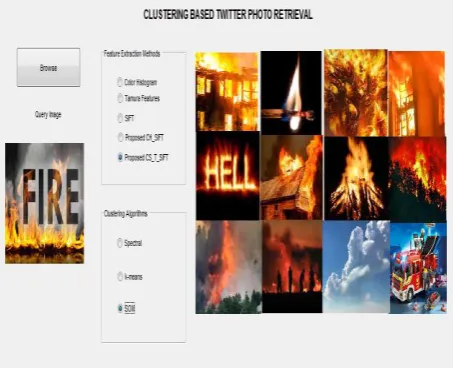
From Fig.3, it is observed that the accuracy of the proposed CH_T_SIFT and proposed CH_SIFT feature extraction method with SOM clustering method are 82.6% and 81% respectively and gives better results than exclusive color histogram, tamura features and SIFT descriptors separately. On comparing both proposed feature extraction methods, proposed CH_T_SIFT performs better compared with propose CH_SIFT feature extraction method with SOM clustering method. Fig.4 shows the GUI of the photo retrieval system for the proposed methods.
Clustering HistograColor m
Tamura
features SIFT
Proposed CH_SIFT
Proposed CH_T_SI FT
Spectral 67.9 67.0 84.5 73.2 75.4
K-means 68.4 51.8 70.8 64.6 66.4
SOM 70.5 59.2 74.1 76.1 77.5
Clustering Color
Histogrm
Tamura features
SIFT Proposed
CH_SIFT
Proposed CH_T_SI FT
Spectral 79.3 78.2 81.6 82.2 85.4
K-means 74.2 58.3 76.7 71.8 75.6
Fig 4 GUI representation of the retrieval system
V. CONCLUSION
In this work, clustering retrieval of photos using proposed feature extraction method was implemented. The proposed feature extraction such as CH_SIFT and CH_T_SIFT shows the novelty in this research work. Here, the proposed feature extraction method implemented by using spectral, SOM and K-means clustering algorithms. All 5 feature extraction techniques are applied to 3 clustering algorithms, totally 15 combinations of photo retrieval is done. The experiments results show that the accuracy values of the proposed CH_T_SIFT feature extraction is better than proposed CH_SIFT and also the exclusive histogram, tamura features and SIFT features separately. Among the three clustering algorithms, it is observed that self-organizing map gives high performance than spectral clustering and K-means clustering algorithms.
ACKNOWLEDGMENT
I would like to thank University Grants Commission (UGC) of Indian Government for supporting my research work financially.
REFERENCES
[1] Iyad Abu Doush, and Sahar AL-Btoush, ―Currency recognition using a smartphone: Comparison between color SIFT and gray scale SIFT algorithms‖, Journal of King Saud University – Computer and Information Sciences, Vol.29, No.4, pp.484-492, 2016.
[2] Ayisha Begam, and Nazeer, K., ‖Content Based Image Retrieval on Image Sub-blocks‖, International Journal of Advance Research, Vol.1, Issue 1,pp.1-10, 2013.
[3] Guoyang Duan,Y.Y., and Jing Yahng, ―Content-based image retrieval research‖, Physics Procedia, Vol.22, pp.471–477, 2011.
[4] Aboli W.Hole, and Prabhakar L.Ramteke, ―Design and Implementation of Content Based Image Retrieval Using Data Mining and Image Processing Techniques‖, International Journal of Advance Research in Computer Science and Management Studies, Volume 3, Issue 3, pp.219-224, 2015.
[5] Dingding Wang, Chris Ding, and Tao Li, ― K-Subspace Clustering‖, Springer, pp.506–521, 2009.
[6] Graeme Best, Jan Faigl and Robert Fitch, ―Multi-Robot Path Planning for Budgeted Active Perception with Self-Organising Maps‖, International Conference on Intelligent Robots and Systems, 2016. [7] P. Mohanaiah, P. Sathyanarayana, L. GuruKumar, ―Image Texture
Feature Extraction Using GLCMApproach‖, International Journal of Scientific and Research Publications, Volume 3, Issue 5, ISSN 2250-3153, 2013.
[8] M.Vadivukarassi, N. Nanthini, N. Puviarasan, P. Aruna, ― Clustering of Images from Social Media Websites using Combination of Histogram and SIFT Features‖, International Journal on Recent and Innovation Trends in Computing and Communication, vol.5, ISSN: 2321-8169, 2017.
[9] Hsin-Chien Huang, Yung-Yu Chuang, Chu-Song Chen, ―Affinity Aggregation for Spectral Clustering‖, proceedings of institute of electrical and electronics engineers, vol.12, pp.978-1-4673-1228-8, 2012.