Efficient Analysis of Measuring Usability Metric based on
Cognitive Model through Examine the Students Task
Performance
Dr. D.Kalpanadevi
Assistant ProfessorDepartment of Computer Applications
Ayya Nadar Janaki Ammal College Sivakasi, Tamil Nadu, India [email protected]
Abstract— In this paper focuses on the software quality be proved based on ISO/IEC 9126-4 Metrics in usability metrics which can measures the efficiency, effectiveness and user satisfaction when operated by the user. Two main approaches are those based on psychological models of user behavior towards goals exemplified by GOMs and those based on linguistic models that attempt to evaluate the complexity of tasks by constructing a production system comprising a set of production rules along with a computational engine that interprets that production. This is the basic methodology for creating the design tool for conducting the test based on experimental method by usability criteria.
Keywords—Keystroke-Level Model (KLM) and cognitive complexity theory, Usability Metrics. 1. INTRODUCTION
Human Computer Interface (HCI) system is designed by the tasks based on cognitive model using KLM model and Cognitive Complexity Theory. The test plan constructs the numerical ability of mathematical solving problems, logical reasoning, and perceptual speed taken from graduate students‘ while pursuing college education. In addition, the brain dominance questionnaire is also included in the test plan for identifying the brain hemisphere of the student for further analysis. The development of interface design provides the evaluation of the students‘ cognitive skill and performance can be analysed by the formation of usability metrics. An evaluation can be performed in the laboratory with end user to examine the exact task performance to be determined in the test plan.
2.ORIGINOFPROBLEM
According to Aspiring Mind‘s National Employability reports, in the survey of 2013 for all colleges across India, 60,000 students‘ received a graduate degree i.e., three year Bachelors Degree, but 84 % of graduates were found lacking cognitive Skill level. [8]
According to Nasscom‘s report [5][6][9][10], our education system is still lagging behind while industry grows very fast. Every year, 37 lakhs graduate but only 25% of them are employable in the IT-BPO sector.
In this research focus on educational environment, due to the lack of specialized skill level for graduate students‘ causes unemployment. According to the National Skills Development Council (NSDC), a new job created by 2022, will come from several sectors in India [11] such as construction [12] and plumbing, automotive and transportation, retail and healthcare, education etc.
3.SCOPEOFRESEARCH
Usability testing method can suggest measuring the usability criteria of the task performance of student based on Evaluation in Analytic method.
Apart from an academic performance, the research is aims to identify the students‘ skills in various levels by examining in the laboratory through user interface design, which determines the exact task in the test plan. There are three problem-solving abilities of numerical, logical reasoning and perceptual speed. In addition, brain dominant hemisphere questionnaires can be used for measuring the skill level of students with 15 multiple choice questions for each type of ability and the running time of the questions has 45 minute duration for the test plan. When the user interacts with the system, the performance can be measured based on the cognitive model with usability metric based on evaluation of analytic method under Key Stroke Level Model. The end result of the students‘ task performance can be stored in the database with respect to the time taken to perform a task in an optimal way by cognitive complexity theory.
4. DESIGNING A USER INTERFACE BASED ON COGNITIVEMODEL
Figure 1. Frame Work of Research Architecture
A. Students Learn the Instruction
After registering the student details, an instruction is given before the test session starts, when the user presses the start button, session can be started.
B. Session Start
Set time as 45 minutes to start and each second reduced leads to end task in order to attend the test, specifically to measure the time task and result scoring for analyzing the cognitive skill of the students and all collecting performance of each task of ability (Numerical, Logical and Perceptual Speed) and also brain dominant hemisphere questionnaire data maintain in the database.
C. Maintain Data in Database
To examining the students‘ skill factor who answers the exact task in the test plan, the responses of all data can be stored in data base
D. Cognitive Model
In cognitive model, scope of knowledge is accumulated information, problem solving schemas, performance skills, expertise, problem representation ability by the categorization of Numerical Ability, Logical Reasoning and Perceptual Speed as referred to in figure 2.
[image:2.595.319.559.143.473.2].
Figure 2 Cognitive Skill Analyses
In this research, an evaluation of analytic method such as KLM model and Cognitive complexity theory [1][2][3][4][7] is combined and implemented for analyzing the performance of task under usability criteria.
Figure 3 Implementation of Evaluation of Analytic Method and Task Analysis in HCI based on Usability Metrics
When the students starts the test session, the time can be counted down to each second and it can be reduced from the starting time as 45:00 minutes. The cognitive complexity of production rule system, If....Then rule represents the task of each click, when the students responds to questions one by one or in random. An execution time can be calculated whatever they taken time to answer the question which is measured by running time simultaneously.
By conducting laboratory test which relates to Brain Dominant, Logical Reasoning, and Numerical Ability and Perceptual Speed accuracy based on the cognitive model.
Figure 3 represents an implementation of cognitive model of evaluation of analytic method used to analyze the performance task with respect to usability criteria. To examine the performance task of students‘ abilities completed task, time taken to complete test, time taken for each task which can be taken as test of numerical ability, Logical reasoning and perceptual speed.
Figure 4 represents the implementation of production rule system for predict an exact time of each task of students. When the variable of sec is greater than 0, then the system wait for student respond to click start button for set time function initialise the total time 45:00 minutes. Otherwise,
Examine the result and Maintained in Log data Performance Test
Generat e Cognitive
Complexity theory and KLM
Measures performance
against
Structur es
Determi ne User needs
analysis
Request Usability Criteria
Target to Test Plan
Acceptance Usability Criteria
Task Analysis by Analytic Method
Evaluation Goal by Analytic Method
[image:2.595.43.267.673.776.2]the set time can be count down from 45:00 minutes to 0:00 minutes respectively.
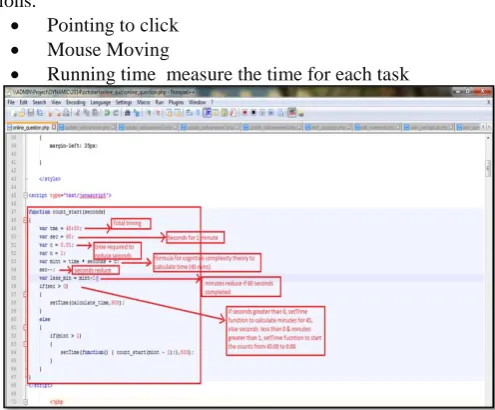
Production rules are IF- THEN condition- action pairs. A production system comprises a set of production rules along with a computational engine that interprets that production. The training time of completion for each minute can be counted as follows
mint= time * seconds + c; where c represents the time required to reduce each second.
From the running time of each second, the countdown starts and keeps decreasing. It can accurately predict the time taken by a skilled user to execute a task based on a set of composite actions.
Pointing to click
Mouse Moving
[image:3.595.49.297.214.419.2] Running time measure the time for each task
Figure 4 Cognitive complexity theory: IF- THEN rule for calculating the training time taken
The exact time taken for each task can be measured by the target time of Point mouse to target, Select or release target mouse, measure the time taken for respond to solve the question which can be represented as ―time_val‖. Then finally, the overall time of exact time for completing the task is calculated and represented as ―overall_time‖. The required function is used to measure the exact task of the all questions attended by the students. The sample code can be denoted as given below:
<script type="text/javascript">
function update_qus_answer(radioval,bdid) {
var mouse_pointer = 0.10; var select_mouse = 0.01; var hands_mouse = 0.04; running_time = 45.00;
var userid = '<?php echo $userid_val;?>';
time_val =
document.getElementById('timer').value;
overall_time = mouse_pointer + hands_mouse + select_mouse + time_val;
}
The time interval between each question can be calculated accurately by using the formula given below:
Task time= End time – Start Time
A. Sample Pseudo code in java script
<script type="text/javascript"> function countdown(minutes) {
var seconds = 60; var mins = minutes function tick() {
var counter = document.getElementById("timer"); var current_minutes = mins-1
seconds--;
counter.innerHTML =
current_minutes.toString() + "." + (seconds < 10 ? "0" : "") + String(seconds);
//document.getElementById("timer") = counter.innerHTML;
if( seconds > 0 ) { setTimeout (tick, 1000); } else {
if (mins > 1){
// countdown (mins-1);
setTimeout (function () { countdown(mins - 1); }, 1000);
} } } tick(); }
countdown(45);
From the pseudo code, illustrate the time period which can construct the rule by evaluation of analytic method for analyzing the performance task of the students, collected quantitatively. Set time as 45 minutes to start and each second reduced leads to end task in order to attend the test. When the time moves from 45 minutes to 0 minutes the session time out message can be displayed.
5. EVALUATIONOFUSABILITYMETRICS
E. Efficiency
1. Time spent in errors
No time spent in errors
2. Frequency of help and documentation use
Direction of instruction provided in the each Scenario was satisfactory for the attendance.
3. Number of repetition of failed commands
No number of failed commands in test.
4. Number of regressive behaviors
Regressive Behaviors number is observed as thirty five.
5. Number of times the user is disrupted from a work task
Average number of times the user is disrupted from a work task is These problems were generally because of the hardware performance and solved in less than in a minutes.
6. Number of times or average number of users need to work around a problem
Duration of the test performed by the students and average problem solving time is reported between 0.26 seconds and 1 minutes.
7. Number of times user loses control of the system
In the local host, to navigate the system for conducting the test, no software control problems were reported.
F. Effectiveness
1. Ratio of success to failures
No reason for failure of completed procedure
2. Percent of task completed per unit time
the ratio of effective users‘ work time to all users‘ work time by given below the formula.
U N
m t
ij ij
j=1i=1
p=
*100%
U N
t
ij
j=1i=1
(0*12.31) 1*13.5) (1*4.21) (0*11.6) (1*13.5) (1*4.43) ... (1*8.14) (1*9.35) (1*9.11) *100 12.31 13.5 4.21 11.6 13.5 4.43 ...11.59 13.5 2.04
p
35359.94 *100 38081.63
92.85% p
p
3. Percent or number of errors
Students completed the test without any encountering
any errors.
[image:4.595.50.282.66.508.2]4. Percent or number of competitors better than it
[image:4.595.312.564.94.536.2]Figure 5 Terminology and System information The above Figure 5 represents the terminology and system information about the use of terms throughout the system; Terminology is intuitive; Position of messages on screen, prompts input and error messages can be analyzed 100% statistically.
Figure 6 Learning to Operate the system by Students The above figure 6 represents the analysis of the students learning to operate the system as 100% easy and performing task in a straight forward manner is 19.5% and 80.5% denotes never performing tasks in a straight forward manner.
5. The number of commands used
Eight Commands were used to complete the test procedure
1. Go to local host and Navigate to site.
2. Click the category of Institution – Arts and Science graduate students School/Arts and Science/ Engineering)
3. Fill the information form required the students back ground details.
4. Click the submit button for start the test 5. Read the instruction of the test plan, then
Select to start.
6. Fill the answer of each task 7. Click the submit button
8. Click the comment of feedback and send submit button
6. Number of runs of successes and of failures
All commands are well performed in his work by conducting the test activity. All commands performed
by
the user depends on the hardware performance.
7. Number of times interface misleads the user
No interface misleads were encountered by the user during the test in the laboratory.
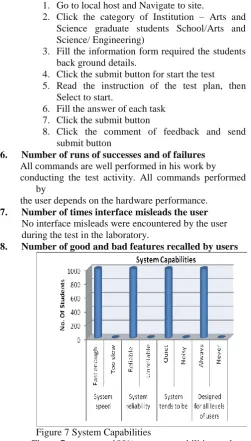
[image:4.595.65.291.554.703.2]8. Number of good and bad features recalled by users
Figure 7 System Capabilities
Figure 7 represents 100% system capabilities such as system speed, reliability, tends to be either quiet or noisy and designed for all level of users.
Figure 8 Screen Information
Figure 8 represents that 97.5% students found it easy to read the characters and 100% were very clear about the organization of information and sequence of screens.
[image:4.595.346.569.569.743.2]The link of School and Engineering category are unused commands on home page.
G. Satisfaction
1. Percent of Favorable or unfavouarble user comments
81.1% of the test attendants commented in favor, and 18.9% comments are unfavorable.
2. Number of user Preferring your system
81.1% of students commented favourably about the test.
3. Number of times user expresses frustration of satisfaction
96.5 % students were satisfied with the test. However, 35% of students expressed their frustation due to unsatisfied properties of hardware problems.
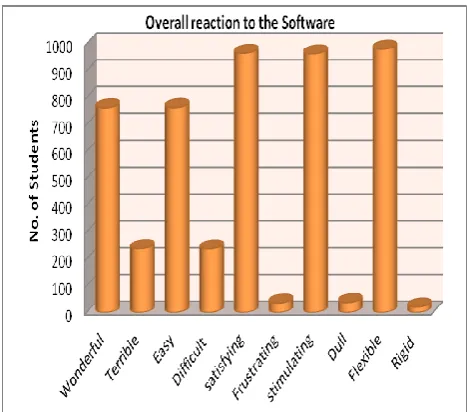
[image:5.595.36.273.344.550.2]Figure 9 represents the overall reaction to the software collected from the students; 76.2% students commented wonderful, 76.3% students commented easy to work, 96.5 % were satisfied with the usage of software, 96.3% students reacted that it is stimulating to learn, 98% students denote that it is flexible.
Figure 9 Over all Reaction to the software
6. CONCLUSION
In this chapter, the Human computer Interface system gives better performance through the student task performance based on Usability metrics.
Keystroke Level model in GOMS can be implemented for analyzing the cognitive process of students through computer interfaces. It can measure the goal factor of evaluation by user interaction when the question is answered.
Usability testing can be processed by employing usability metrics for evaluation, under the terms of effectiveness, efficiency of task and test satisfaction.
Relative time based- efficiency of a product including time spent by user is 92.85%.
The user satisfaction measures 81.1% of the test attendants commented in favor, and 18.9% comments are unfavorable.
Finally, the software quality be proved based on ISO/IEC 9126-4 Metrics in usability metrics which can measures the efficiency, effectiveness and user satisfaction when operated by the user.
REFERENCES
[1] Anderson, J.R.,‗The Architecture of Cognition‘, Harvard University Press, Cambridge (1983).
[2] Stuart K. Card, Thomas P. Moran & Allen Newell. (Ed.). (1986). The psychology of human– computer interaction, Lawrence Erlbaum Associates publishing. [3] David H. Jonassen, ―Analysis of Task Procedures‖,
Copyright _@ 1986.
[4] Gagne, R. (1962). Military training and principles of learning. American Psychologist, 17, 263-276.
[5] http://www.thehindu.com/news/cities/Delhi/nearly-47-
per-cent-graduates-in-india-unemployable-says-report/article4850167.ece JUNE 26, 2013 10:21 IST July 31, 2013.
[6] http://www.thehindu.com/education/careers/lack-of-skills-is-a-greater-concern/article19307096.ece Ashoke Joshi JULY 19, 2017 13:21 IST
[7] https://usabilitygeek.com
[8] https://www.thenational.ae/uae/government/pratibha-patil-lauds-brand-india-education-1.553262.
[9] https://timesofindia.indiatimes.com/india/Height-of- joblessness-23-lakh-applications-for-368-peon-jobs-in-UP/articleshow/48984692.cms
[10] https://timesofindia.indiatimes.com/city/nagpur/Only-
25-graduates-employable-Nasscom/articleshow/7937126.cms
[11] http://businessworld.in/article/Construction-Industry-To- Create-32-Million-New-Jobs-By-2022/05-04-2017-115789/
![Figure 2 Cognitive Skill Analyses In this research, an evaluation of analytic method such as KLM model and Cognitive complexity theory [1][2][3][4][7] is combined and implemented for analyzing the performance of task under usability criteria](https://thumb-us.123doks.com/thumbv2/123dok_us/749671.1086027/2.595.319.559.143.473/cognitive-analyses-evaluation-cognitive-complexity-implemented-performance-usability.webp)