FOR SELECTED
METALS
BY THE
ATOMIC
BEAM NEI'HOD
Thesis
byJohn Kailin Link
In Partial Fulfillment of the Requirements
For the Degree of
Doctor of Philosophy
Califor~a Institute of Technology
Pasadena, California
ACKNO\'l'LEDG EN.ENT 5
This experiment was part or a continuing project on the measurement of absolute r-v3lues using the atomic beam method under the direction of Professor Robert B. King. I wish to acknmvlede;e my appreciation for his generous
advice and encouragement.
Mr. George M. Lawrence we.s responsible for the design of most of the new apparatus used in this work. Working closely with him has been a valuable educational exper-ience for me.
The able assistance or
Mr.
Robert C. Ashenrelter in design and construction or electronic equipment has been valuable in the development of the new apparatus.I '"'ish to thank my i·:ife, Ruth Link, for her steadfast work in the measurement of equivalent widths.
Frevious experimental work has demonstrated that the use of an atomic beam apparatus in the measurement of absolute f-values is a valuable method from which reliable experimental results can be obtained. Changes and improvements were made in the apparatus, increasing its sensitivity and reliability; these modifications are described.
A discussion of the validity of certain assumptions in the atomic beam theory is presented. A discussion is also presented of checks made on the reliability of the experiil.ental measurements.
Absolute f-value measur ements were m~de on the stronger resonance lines of Cr I, Ga I, In I, Tl I, Pd I, and Sn I. The results of these measurements are presented and com-pared with those of other investigators.
Fart Title
~ INTRODUCTION
II. OUTLINE OF THEORY
III.. EXPERI.NENTAL ANALYSIS AND TECHNIQUES A. Discussion of the Validity of the
Beam Assumptions B. Optical System
c.
Vacuum SystemD. Crucibles and Furnace Tubes E. Microbalance
F. Photomultiplier Detector G. Temperature Measurements H. Discussion of Errors IV. EXPERI¥£NTAL RESULTS
A. Chromium I B. Gallium I
c.
Indium I D. Tin IE. Thallium I F. Palladium I
· V.. DISCUSSION
A. Absolute f-Values B. Relative f-Values
C. Limitations of the Apparatus and Suggested Improvements
D. Suggestions for Further Research
Table Title
I. Chromium I Data II. Gallium I Data
III. Indium I Data
IY.
Tin I Datav.
Thallium I Data VI. Palladium I DataVII. Absolute f-Values
Vlll_. Relative f-Values
LIST OF FIGURES
Figure Title
I. Experimental Configuration II. ~~crobalance Output Tracings
III. Hyperfine Structure Indium I, ~4101.76 IV. Photomultiplier Scanner Output Tracings
v.
Curve of Growth Chromium I, AJ578.69 VI. Impluse Force vs. Deposit RatePage 51 55 59 62 66
69
76 80
Page
13
29
38
39
48I. INTRODUCTION
The determination of transition probabilities, or f-values, for atomic electrons has been of interest to physicists even before the development of modern quantum theory.
The theoretical computation of these transition prob-abilities is severely limited by its dependency upon
accurate wave functions for the initial and final electronic states. Accurate wave functions for atoms with more than one electron are very difficult to determine.
A number of techniques have been employed in the
measurerrent of absolute f-values (l,2) Emission f-values
obtained from arcs are unreliable because of the lack of
precise knowledge of the temperature and emitting atom density within the arc plasma. Self-reversal of the emis-sion lines constitutes an additional source of error.
Physicists at the National Bureau of Standards (3 ) have
investigated 25,000 lines in the arc spectra of seventy elements. Absolute and relative f-values obtained by
other methods were used for calibration.
The measurement of the lifetime of an excited elec-tronic state is a valuable experimental method for
deter-mining absolute f-values 1t the relative f-values of all
The determination of f-v~lues by the analysis of
spectr~l lines for~ed in absor~tion has certain advantages over the use of emission lines: the condition of atoms in the absorbinE [~S is relatively simple to describe theoretically as well as to control experiment~lly.
Irofessor R. E. King and his co-workers have determined, throush use of the Kins furnuce, relative f-values for most of t ile elements between tit.s.nium and nickel on the
periodic table. Absorption lines were formed when li~~t from a continuous source v1as sent t hrouch monatomic vapour of the element being studied
(
6
,7)
If the vapour pressure of the element is known as a function of temperature, and i f the absorbing vapour is in t Lerrr.al equilibrium, i t is t hen possible to rne:...sure absolute f-v tlues. Quartz cells have been used to confine metal
v
a~our
s
in such a state ofequilibrilli~(B).
This techniquehas been unreli:J.cle, however, since much of the vapour
pressure data were in ere or by at least fifty pre cent ( 9 '10 ). The relative f-v~lues for lines of an element can
be determined by measuring tr·.e anomalous dispersion of its vapour in the i r:Jmediate vicinity of e:;.ch absorption line. This method has been widely used in the Soviet Union (11,12,13). If the vapour is maint~ined in a st~te of
t hermal equilibrium, the relative f-values can be converted to an absolute scale by using vapour pressure data.
The atomic beam met hod "'as first introduced by Kop-(14,15)
have done much work on improving the techniques and in
verifying the reliability of the method:
~.
H. Davia (l6)P. M. Routly, and G. D. Bell (l?) under the supervision
of Professor King. Their work has resulted in the
pub-lication of absolute f-values for Cu I, Fe I, ¥ill I, and Pb I (18, 19,20) •
The experiment described in t his thesis used an atomic
beam apparatus. A small, chemically pure sample of the
metal being studied was placed in a crucible with which
it ~ould not react chemically. The metal was he~ted to
a temperature at which its vapour pressure was
approx-imately .02 Torr. A sm~ll precentage of the atoms in the
crucible effused from an orifice in the side, forming an
atomic beam. The beam was fan-shaped because of knife
edges w:.ich defined its opening ant;le. The ~tomic beam
entered a vacuum chamber in which the pressure was between
3xlo-6 and 5xlo-7 Torr.
Quartz windows on either side of the vacuum chamber
allowed light, from a high pressure mercury dischare:e
lamp, to pass tl~ough the atomic beam in a form
approx-imating a flat horizontal sheet. The absorption line thus
formed was scanned with a high resolution, high gain,
photomultiplier scanner placed in the camera holder of a
22 foot Rowland mounting spectrograph. The output of t he
scanner after filtering, amplificat ion, and zero shifting
was traced on a strip chart recorder. The equivalent width
measuring the area under the line profile traced upon the
strip chart .
While the absorption line was being scanned, a second strip chart recorder was continuously m~king the r ate at which atoms in the atomic beam were deposited onto a
microbalance pan. That part of the atomic beam which impinged upon the microbalance pan was determined by a
circular aperture directly above the opening in the crucible.
The temperature at the inside of the crucible was measured with an optical pyrometer. From a knowledge of the
geom-etry, the temperature inside the crucible, and the r ate
at r:hich the aton;ic beam deposited onto the microbalance pan, i t was possible to compute the actual density of absorbing atoms integrated along the path of the l iLht
beam. After determining the above quantities , the f-value of the line beins studied could then be calculated by
relating the equivalent width to the concentration of
absorbing atoms.
The work of G. D. Bell (l?) showed that the
assump-tiona involved in determining ato:J.ic beam densities from
beam geometry, crucible temperature, and de~osit rate on the microbalance pan were justified; on the other Land, this work indicated a need for a more sensitlve and a c-curate determination of both equivalent widths and deposit rates. A considerable amount of time was spent, therefore,
A brief discussion of t he newly developed apparatus
wi ll follow. Results are given for 25 accessible
res-onance lines of Cr I, Sn I, Pd I, Ga I, In I, and Tl I;
comparisons are t hen made ~ith t he work of other
invest-i gators. Ho\'lever, a reswne wi/ l l first be presented
out-lining the theory necess~~ry to define the quantities used
II..
OUTLI
NE
OF T
HEOR
Y
The general theory for the formation of absorption
l ines in a monatomic gas is well understood. Useful
refer-ences are Unsold {l) and Aller ( 22
>.
Davis (16) hasdeveloped the modifications necessary for the analysis of
lines formed in absorption from an atomic beam.
The equivalent width of a line is a useful parameter
in describing its strength:
J )., •
10 is the continuum intensity in the absence of absorption, and
IA
is the intensity as a function of waveleneth in the presence of absorption. As defined here, the equivalentwidth is t he equivalent amount of the continuum, in wave length units, which is totally absorbed in the formation
of the line.
Line formation theory st~tes, for the case of pure
doppler broadening {~A.,/4).
0
<<}, \thereAA,.
is the natural width of the line and ~~~is the doppler width), thatH(k·
NrL)
A AD
(1)
where f is the f-value for the line, N is the density of absorbing atoms in the light path, L is the optical path length, and K is a constant for a given line. This relation is known as the curve of growth and can be obtained
first term in the series makes the major contribution; the relation then becomes l inear.
In developing the theory for the atomic beam the fol-lowing assumptions are made:
1. The pressure in the vacuum system is low enough so that less than one percent of the atoms in the beam will collide with residual gas molecules in travelling the three inch distance betv1een the crucible orifice and
the microbalance pan.
2. The atoms of metal vapour reach thermal
equili-brium inside the crucible. The presence of the hole in the crucible does not significantly effect this equilibrium condition; in other words, the mean free path of atoms in the crucible is large compared to the size of the orifice.
3.
The crucible orifice is small enough to becon-sidered a point source when viewed from a distance of
1.5
inches or more.
4.
The changes in weight of the microbalance panare due only to the deposit of atoms from the atomic beam.
All incident atoms stick to the pan.
Davis (l6) obtained the following expression as the
explicit form which equation 1 takes in the atomic beam
case:
•
(2)
/
appropriate to the velocity distribution in the atomic
beam, and C is proportional to NfL/'(T of the atomic beam. The quantities in equation 2 are defined as follows:
(3)
~.is
the wavelength of the line in units of lo-5 em, Tis the crucible temperature in degrees Kelvin, M is the
mass of the element in atomic mass units, and "( is the
half angle of the atomic beam. If the quantities in
~
equation
3
are expressed in these units, then4 }.,
will bein milliangstroms.
Continuing with a definition of the quantities in equation 2,
,
C=
fGQT•
~
where Q
=
8.
33xlo-3 •
~ i>'fr~
;
(4)
(5)
Z is the distance, in inches, above the crucible orifice
at which the light beam passes tr.rough the atomic beam;
b is the vertical distance from the crucible orifice to
t he circular aperture, defining that part of the atomic beam which strikes the microbalance pan; and
f
is the'
radius of this circular aperture. G is the rate at vthich
atoms capable of absorbing a photon of the wavelength of
~
the spectral line deposit on the microbalance pan. G is
distribution of atoms over the lo.,, lying energy levels of I
the atom. Accordingly, G
=
(B.F.)G where- 1::;
8~
c
ifr
••
•
f
~·~-#
B.F.
=
(6)The quantity gi is 2Jtl for the lov:er state of the tran-sition, and Ei is its energy. The sum extends over all
low lyinr states vrh1ch have an appreciable population at the temperature of the crucible.
A complication arises when the line under investi-gation has hyperfine structure comronents separated by
more than
.5
mA0 (23).
If the separation of the components is smaller than the effective doppler widthof
the line, the blending of the components is quite complicated, and the equivalent width should be kept small (\16
/.o~ <.~) so that the line is on the linear part of the curve of gro,.,th \vherefil
c.
( 7)\Vhen the splitting of the byperfine structure comfonents is greater than or equal to tLe effective doppler width of the line, but unresolved by the spectrograph, the compon-ents are blended and each component follows a separate curve of growth:.
¥/€);
,1) x~
components. These theoretical relative intensities can be obtained from the tables of \vh1te and Eliason ( 24)
i f the nuclear spin and J values for the upper and lower terms are knovm.
In practice)
V.j11'>.·.)..,_t
for the unresolved line, the relative values of the Ci, and tabulated values for thecurve of gro\·Tth :function for a sinele component are known
and the theoretical curve of growth for the unresolved line, relating
Vf/A
~g).,..,.
to Ctot al• is desired. A series of Ctotal values covering the range of experimental inter-est were selected. Each Ctotal was then expressed as a sum of Ci, C.total=
f
Ci, \vhere the Ci have the correct relative values for the line being studied. For each Ci,The composite curve of growth was a graph of 0 totai against
'vJejiJ
~P)T.t~)
\'/here\Jt)
2_
~,·
J1'
p T.f.J"
.d
XD
•
Using the quantities defined above, the absolute f-value for the line was then obtained from the equation:
(8)
A final relation, derived by Davis(l6 ), for the impulse force received by the microbalance pan upon open-ing the shutter is very useful in analyzopen-ing the meanopen-ing of
--the tracings from --the automatically balancing microbalance:
F
=
trG• F is the impulse force in micrograms and tr isthe time necessary to deposit a mass with weight equal to
F. The recovery {tr) can be computed from the following
III. EXPERIMENTAL ANALYSIS AND TECHNI';UES
The experimental methods used to measure absolute f-values will be described in some detail in the following eight sections. Aspects of the experimental apparatus
which ere not fully described have already been discussed
[image:17.549.56.479.93.711.2]in detail by Davis (l6 ) and Bell (l7).
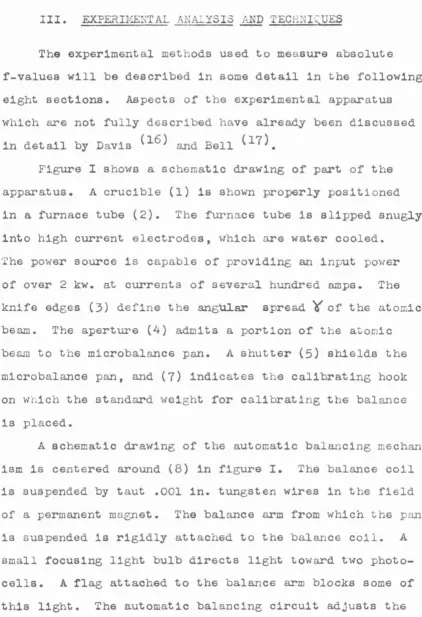
Figure I shO\V'S a schematic drawing of part of the
apparatus. A crucible (1) is shown properly positioned in a furnace tube (2). The furnace tube is slipped snugly into high current electrodes, \-rhich are water cooled.
The power source is capable of providin6 an input power of over 2 kw. at currents of several hundred amps. The
knife edges
(3)
define the angUlar spread ¥of the atomicbeam. The aperture (4) admits a portion of the atomic
beam to the microbalance pan. A shutter (5) shields the
microbalance pan, and (7) indicates t he calibrating hook
on woich the standard weight for calibrating the balance
is placed.
A schematic drawing of the automatic balancing me chan-ism is centered around (8) in figure I. The balance coil
is suspended by taut .001 in. tungsten wires in the field
of a permanent magnet. The balance arm from which the pan
is suspended is rigidly attached to the balance coil . A
small focusing light bulb directs light to'fTard t\'IO
10
I
ti
Iter
FIG
.
I
E
XPt:RI
MENTAL
CONFIGURATION
Photo-
cells
Current
I t-' VI I
Slit
current tr.cr-ough the balance coil until t he output signals from the t\·;o photocells are equ;:ll.
The temperature of the crucible orifice is measured
with an optical pyrooE:ter by vie\·rint: throu[h the window (9).
A rot:::.t..s.ble qu£..rtz disc underneath the window J:rotects 1t
from foc;:c;ing by the atoLic bei..llil.
The hit;h pressure mercury discharse light source is
locate~ at (10) . The li5ht from the lamp is iQaced at
A. Discussion of the Validity of ~ Atomic Beam Assumptions
The geometrical distribution of the atomic beam v1as checked by Bell
(17)
and found to agree, to within experi-mental error, with that predicted by assuming effusiveflow from a point source.
The velocity distribution of the atoms in the atomic beam can be calculated from the temperature of the vapour inside the crucible using kinetic theory for effusive flo\·t, provided the mean free path of the atoms inside the crucible is long compared to the dimensions of the orifice. To
determine the validity of the assumption of effusive flow, mean free paths (~) were computed for the temperatures
used in vapourizing chromium. Vapour pressures for chromium were taken from the tables given by Stull and Sinke
(25)
.
The extreme values are reported here:
T •
1963
°K
T
=
1700 °K
A=
0.8 mm.A=
26
mm.G :
1.2
/gm/sec G=
.o45
~gm/sec/i.'he diameter of the crucible orifice was about 1 mm. The mean free paths of all the other elements studiedJexcept tin and indium,fell within the range given above.
For tin and indium,lines from excited states with f-values less than
.05
were studied. The beam densities \~hich were necessary to produce measurable absorption lines led to mean free paths of less than .3 mm. inside thediameter orifices were used. To check on the effect of
these short mean free paths on the measured f-values
speci3.1 crucibles 1tlith orifices .11 in. in diameter were
used in repeating the measurements on two f'-values of t~n and two f-values of indium. The repeated f-values agreed
with those obtained using scandard crucibles to less tuan
5%·
The mean free paths i nside tbe special crucibles wereah1ays greater than
3
mm.ihus, t he restrictions imposed by the assumption of
effusive flovt do not seem to have been violated in tue
B. Optical System
A high pressure mercury discharge lamp was used as a
light source. It had a high intensity output and lifetime
of about 50 hours, while operating with an input power of
1.1 kw., as lonG as a steo.dy flO\'/ of coolins water v:as
main-tained to carry off the he:?..t generated. Both t he capillary·,
which contained the mercury, n..nd the outer water jacket of
the lamp \'lere made of quartz to allow t ransmission of light
with wavelength shorter t han 3000 A0• During operati on of
the lamp, t he pressure i nside t he capillary rose to several
hundred atmospheres. The mercury emission lines were, t he
re-fore, extremely pressure broadened. The lamp output was a
useful source from 2650 A0 to at least 7000 A0 • Below 2650
A0 the self absorption of the mercury 2536 A0 line
drasti-cally reduced the light output. Near the mercury emission
lines the continuum intensity varied at least a factor of ten.
The mercury lamp '~·as placed in a horizontal position,
and a quartz lena \'lith 15 em. focal length \vas used to oring
the line image of the capillary to focus in t he center of
the atomic beam. A 30 em. focal length quartz lens then
focused t his image on the entrance slit of the spectroe;raph.
This simple optical system was designed by G. M. Lawrence
to admit a maximum amount of l i5ht to the spectrosraph by
filling both the length and breadth of t he entrance slit.
Both lenses were mounted on precision lens mounts, \'lhich
Licht Has admitted lnt.o t.he vacuum system throuzh
optical q_uo..rtz ·.·indoi'ls se::led to the main vacuum ch<.Jmbcr
by me~s of 0-rlnss.
The lo.rce Ro·,.;land mount ln.=; spectroe;ra.ph, loc;..Lt ed in
Bridge Lubor~tory, was used for t his experiment. The 21
foot :rc..tins used in the thesis work. of both Bell and Davis
h3.d been replaced bec::use of the l~se o.r.count of sc.:~.ttered
lisht it proC..uc.::d. The sratinc, used for the Vlork reported
in t nis t Les is had a r c.dius of curvature of 6u50 mm. , 600
rulincs per m.'n. , and a ruled area 5 em. by 12 em. All work
was done in second order, whore the dispersion was 1.252
The foll0\·rin0 simple test \·r:::.s r.1c.de for the presence of
SCEtt tered lisht by the DE:\-,' sro.t ing. The chromium A3578
line was scanned six times, usinc the second order of the
spectrosrc.ph, with a Corning glass filter blockins out o.l l
licht of v:avelensth lon.:.::er than 3900 A0 • The filter was
re-moved, and the line was scal.ned six more times. This \•ras
possible because the EHI 9526B photomultiplier was
1nsensi-o
tive to the first order light of 7150 A , and the mercury
dlsch::rge lamp emits virtually no third order l it.:ht of
vrave-lencth 23oO A0 • The crucible ten:perature \·las constant
dur-inc these scans. The resultino f-values, calculated for
the cr~o~ium A3578 line, did not differ sicnificently from
each other, thus indicating that the presence of scattered
A Corning glass filter, 11
Red Purple Corex-A", \vas
used to separate orders of the spectrograph in the wave
-len3th region between 2700 A 0 and 3650 A 0• For the v
lave-- 0 0 n
length region 3o50 A to 5000 A , a Corning glass Furnace
C. Vacuum System
The vacuum system Has originally designed to attain
a pressure 10\·T enout;h tho.t less than 1~ of the atoms in the atomic beam would suffer collisions with the residual
gas in the system. The distance between the crucible orifice and the microbalance pan was
7
em. Usin5 kinetictheory, the followins expression has been derived for the
fraction, o( , of atoms in the atomic oearn suffering
col-lisions in traveling a distance Z (in em.) at a residual
gas pressure P (in lo-
3
Torr):o< •
ZP/6 .5 • For Z=
7
em., this expression becomes~= l . l P . ~hus , at pressuresbelO\i lo-5 'l'orr, less than 1% of the atoms in the atomic
beam \vill collide with residual e;as atoms in traveling from the crucible to the microbalance pan.
Observatlon of ti1e instantaneous we1gi:1t of t he
micro-balance pan under conditions of atomic beam deposition
indicc.:.ted t : ... at gettering, adsorption, and liberation of gas by the pan could very adversely effect t he accuracy of the de~osit rate determinations. The conical alumi num foil pans used throughout this vtork had a total surface
area of approximately 20 cm2• Deposit raLes observed during the measurement process ranged from .02 to 2 microzr arns
per second. 7he follo>ving expression was obtained from
kinetic theory for R, the rate of mass incidence in micro -2
grams per em per second, as a function of pressure ror
\
where F is expressed in 10-6 Torr. For the pans used in
this experiment the expression becomes R • .32P • At a
residual gas pressure of lo-9 Torr, the mass incidence
rate becomes .0003 ~gm/sec., which is about 1.% of the
low-est observed atomic beam deposit rates. At the gas pres
-sure of 10-6 Torr, comrr.only obtained during actual atomic
beam deposition, R was therefore about -3~gm/sec.
The composition of the residual gas in the vacuum
system at 10-6 Torr probably differed quite drastically
from that of air. Nitrosen and cracked pump oil fragments
such as methane and carbon monoxide were the main
compon-ents. The chemical reactions that could occur betv1een
these residual gas com~onents and fresh, chemically active,
deposits on the microbal~nce surface are quite complicated.
The metals studied in this thesis are not very active
chemically and there was no evidence of such reactions.
The nature of the experirr.ental work being done with
the vacuum system required that i t be readily demountable
to allow for frequent refilli nc of the crucible and
measure-ment of the quantities determining the atomic beam ~eometry.
The system designed by Davis (l6) and Routly bad 0-ring
seals and many ports to provide easy access to the inside
of the system. The pumping system consisted of a 4 in.
Kinney fractionating oil diffusion pump backed by a tvro
stage
5
cu. ft./min. Kinney mechanical pump. This pumping2
-6
To improve the ultimate vacuum attainable, a large liquid
nitrogen cold trap vrith a lifetime of about 4 hours vras
placed in the baffle valve above the tt~oat of the
dif-fusion pump. This loc:::.tion
~\'as
chosen to reduce \ s much as possible the back-streaming of diffusion pump oil into the vacuum system. The ultimate pressure of the systemwith the cold trap v1as :~.bout lo-7 Torr.
Viton, a fluorine-carbon compound vlith elastic proP-erties, makes 0-rL,gs which are superior to those In<.;.de of buna rubber because of viton's lower vapour pressure and
ability to withstand temperatures of 100 °0. The vacuum
system bad 30 buna rubber 0-rings seals, which were
re-placed with seals made of viton.
The vacuum pressure gauge installed by Bell wc..s a
CVC Phillips gauce cap~.ble of measuring pressure accurately dovm to lo-
6
Torr. A Veeco non-burnout ionization gauge with a linear output and a sensitivity of 100 ~amps perlo-3 Torr at 10 mA grid current was added to the system,
-6
providing accur.:o.te pressure reading below 10 Torr.
i'lith the vi ton 0-ring,s, the lo..,.,.est pressure attained in the main vacuum chamber was 2xlo-7 Torr. An atteiJpt
was made to drive off absorbed gas and thereby speed
pump-do~~ time by heating tbe outside walls of the vacuum
chamber to 90 °0. This was soon abandoned because the
heat caused the v1ton 0-rings to take on a permanent set
and the ultimate pressure was not lowered. The pump-down
was about 24 hours.
The ultimate attainable pressure of the pumping
system was ct.eclred. by putting the Veeco Gauge directly
on the input port leading to the diffusion pump and
pw:ping on the closed ; ort. The pressure t hus ~easured was not significantly lower tbun that at tained while p~ping on the entire vacuum c~arnber. Therefore, i t
was concluded t hat the pump itself \-las the limiting factor and not out-sassing of the chamber or leaks through the
0-riq~s.
The pressure v:bile the furnu.ce was operating '•l<..~.S
usually a factor of ten above t he mini~um at tainable pressure Hben t he furnace H:..lS cold. This v1c.s especially
true with pal laC.ium, which required crucible temper atures
of about 1850 °C and, therefore, furnace tube temper atures
of over 2000 °C. The rise in pressure while t he furn~ce
vlc..s hot 'das at t r ibuted to out-e;assing of t he inside of the system because of exposure to be~t and radiation from the
furn~ce. In prir.ciple, t his out-gassing should stop i f
the furnace were maintained at elevated temper atures for a period of hours; however, such a long out-gassing period would exhaust the su:rply of rr:et al in t he crucible. It was found that maint~ining t he furnace for several hours at a t er::perature just below that at vThicb the element in the crucible att ained an appreciable vapour pressure helped
to r eC.uce the pressure at the higher temperature used to
D. Crucibles ~nd Furn~ce Tubes
Graphite, because of its excellent ther~al shock
resistance, Has used for vapourizing any elerr:ent \vi th
'trhich 1 t C:id not react c C.emi cally. The gra:r:;rJ.i te cruel bles
used for tl-_is work Here r:J:ichined fron1 pure spectroscopic
srapni te rods. Tr ... ey \·rere 1. 3 in. lon3, had an outer
dic.:.;-LetGr o:f:' .352 in. , and a v:c.ll thickness of .018 in.
SnuSLy fitting caps were mac~ined for the open ends, and
holes \,•ith . 045 in. di.:;.meters '.'lere drilled in the sides
in order to allo\·.r for:!Jation of the .::~t .:.;::.ic beam. The
crucibles were r.1aC.e v:ith little 11
ears" t o hold them a.J·:ay
fro~ t~e furn~ce tubes , :.1.nd to t~us prevent an excess
an:ount of current from f-:JSsins throush the cr ucible.
Gr.:..pLite furnace tubes ·.·.ere used with the grapbite
crucibles. These ·,·,ere 3.5 in. long, with an outer diameter of .453 in. , and a ~~11 thickness of .033 in. A hole .150
in. in diwr.eter 'l'fas C.rilled. in their sides. This hole i·:as
~ads just larce enouzh so that i t would not interfere ~ith
tl:e ato::dc be:1.11. It '·" s felt t h1.t Z'::?.vin£ t he hole as srr.::-..11
~ts poss:ble ·,.,·as desir··""ble in order to reduce t he cooling of
the area of the crucible nee:.r the hole , and to thus r educe the ~r::ount of 1:.etal vapour condensing there • . Deposition
of xet~l around the orifice caused variations i n t he
observed deposit rates.
graphite containers. Bell (l7) found that stabilized
zirconium oxide had the necessary chemical inertness to
contain molten metals in the iron group. Zirconia, however, does not have the excellent thermal shock resistance of
graphite; and after beins used once to produce an atomic beam, a crucible would be too cracked for reuse.
The zirconia crucibles used for t his work were
obtain-ed from the Leco Company in St. Joseph, l·:ichisan. These were 1 in. in length and were closed at one end. The
outer diameter was .375 in. c.nd the wall thickness was
.094 in. The Leco Comp~ny did not supply plugs for the open ends, so a technique ~as devised to produce them. Stabilized zirconium oxide was mixed with polystyrene
cen:ent diluted with benzene to form a thick paste. The paste was then packed into molds, which were drilled out
of .250 in. brass sheet. After allowing the benzene to evaporate, the full mold was heated with a cool acetylene
torch so that the polystyrene would burn out. Using a hotter torch, the \·:hole mold was heated until the br ass
mel ted <:'.nd rolled free of t.ae zirconia plue:. Finally, the plug was sintered by heating i t to white heat with the hottest part of the acetylene flame. This technique
pro-duced impervious plugs, which closed the open ends of t he
crucibles very effectively.
The holes from which the atomic beam was formed were
ground in the aides of the zirconia crucibles with a soft
At first, grupLite tubes were used with the zirconia
crucibles, but i t was found that large amounts of gas
evolved upon re~ching furn~ce temperatures in excess of
1800 °C. This was attributed to a reaction between the
zirconia and the graphite, which liberated oxysen. Next,
furnace t~bes rolled out of .003 in. molybdenum were tried,
but i t was found that they developed hot spots and burned
out at temperatures above about 1700 °C. It \·tas finally
found that .005 in. tantalum made very satisfactory tubes,
\·rhich neither burned out nor evolved gas. The tantalum tubes \vere 4 in. in length with .310 in. diameter holes
punched in the sides for the passage of the atomic beam.
The larger holes in the side of the tentalum tubes were
necessary to allow clearance for the atomic beam.
Unfor-tunately, this meant that the area arolli!d the crucible
opening was differenti~lly cooled because of radiation
losses, thus causing some deposition of metal arow1d the
orifice. A chemical reaction between the zirconia
cruc-ibles and the tantalum he.:..!.ting tubes \vas observed, \·.rhich
prod.uced a •::ec:.kening of the t3.ntalum at points of contact.
This was eliminated by wrapping the bottom half of the
crucible with a patch of tantalum .005 in. thick, in
order to prevent any direct contact betvreen the crucible
and the furnace tube.
A set of concentric radiation shields, spot welded
radiation shields were isolated from each other and the
ft:.rn:..:.ce tube, both t herrr.ally and electrically, by means
of annular sp~cers cut from ~unrtz tubing of the appropriate
size. It was found that t he triple radi~tion shield cut
the input po~!er necessary to reach temperatures above
1600 °C in the crucible by at least a factor of t~o.
A test run was maG.e with an empty zirconia crucible
in a tantalum furn~ce tube in order to determine the high
-est attainable crucible temperature. At about 2200
°c
thezirconia melted and reacted with the furnace tube causing
E. The Microbal~nce
The automatic~lly h~lancing microbalance used in t his
experiment was desie-n, .. :Jy G. N. Lmvrence (2l) and R. C. Asbenfel ter. The sens:.. vi vi ty of the balance was about .4 ~m. , and i t had a dynamic r~nge of
5
mgm. The balanceHas calibrated by weighing a standard 1 msm.rider i~ vacuo. This calibration \vas assumed to hold for rr:uch
smaller changes in wei£ht because the autom~tic balancing mechanism always brousht the balance to rest in the same
position. For the experi~ental work reported in t his
thesi~deposit rates on the balance pan were in the range
from .03 to
1.5
~gm./sec. The aperture Vlhich allov;ed theato~ic beam to deposit on the microbalance pan was
.576
in. in diameter. For ele~ents with f-values below
.05,
[image:33.556.54.477.118.690.2]where high beam densities 1-:ere needed, a plug ,,.i th a •
376
in. hole in its center was placed over the larger aperture.Figure II sho\vS two trc::.cings of actual microcc..l ance strip chart recordings. i'!it h the shutter under the
micro-balc..nce closed, the balance reads a const&nt weight. Upon
opening the shutter C!l1 Up\<r3..I'd impulse, due to the c..rri vc.l
of the aton:ic berun, mukes the pan seem lighter. Deposition of mass is marked by a stec.dy increase in the \veight of
the pan. The recorder tracin5 should be ne~ly a straight line for a constant deposit rate. Runs where the deFosit
r ate was clearly not const.s.nt Here rejected. Three obvious
Fl
oure
li.
b
close ehu1ter
~II:.'
~
slopeclo
si
_
ng
Impulse 2.~gm
. 0 31 ~S!!!!.. sec
25
,..M9m
open shutter ~~
Figure
n
a
~
closing i mpul
oa
l~gm
?
slope . 23~Sl!!l.
sec 1 baso .t"iino shifted open ...("shutter
100 _,.M-9m
recovery 6:
'I
time Ga aec ~---4 min \. r---4 min \. 7 7 (increasing time
crucible temperature, forrr.ation or disappearance of deposits
about the crucible orifice, end exhaustion of the material
inside the crucible.
Figure II b shows a deposit r ate of about .03 ~-/sec.
The non-linearity of the trc.cint: is due to the 10\of deposi t
rz::te, ·,·:hich is at the lo er limit of the useful range of the balance. The noise level in the balance is sho•;~n by
the irregularity in the tr·Jcins in Figure II b when the
shutter was closed. Fi£ure II a shows how the recovery
time, t r
=
17.5~, can be re~d off the output ch~t asa horizontal distance betv1een points on the time scale
when the microbalance records equal weishts.
Pans for the balance '.vere made from • 00025 in. thick
alucinum foil. A quarter sector of a
1.6
in. r adius disccut from the foil was shaped around a conical form and
spot vrelded into a conical pan. Conical p:..;.ns ·.·rere used because a larce fr&ction of the atoms which bounced off
the pan surfelce on the first encounter would have to hit
the r:;a.n at least once more before escaping. Therefore,
the fr~ction of ato~s finally sticking to the conical pan
\vould be rr:uch higher than the fraction sticking after a
single encounter.
As much as 100
j"f55D·
of gas \vere observed to lea.ve a pan \<then i t Has first exposed to radi~tion from the furnace.A sreall six volt tungsten lieht bulb was placed near the
balance pan to he~t i t and drive off this absorbed gas.
[image:35.547.51.479.115.710.2]absorbed some g:....s, though at a much slower rate than un-heated pans. The rate of e;as absorption \·:as found to be hishest riEht after a fresh l~yer of metal atoms h~d been deposited
on
the pan. ,_:...ted pans app~ently accumulated a thin surface layer of gas atoms on top of the fresh deposit.·~;hen the shutter was opened ag.:1in this small amou.."1t of absorbed 3as, eenerally less than 2~., was driven off by exposure to the furnace in less than ten seconds.
Part IV section A contains a discussion of gas absor~tion observed on fresh chromium de~osits.
The rapid evolution of gas made i t difficult to obtain an accurate impulse force measurement vrhen the shutter was opened. It vJas found that the impulse force measurement, obtained when the shutter was closed, was more reliable because of the absence of this effect.
The motion of the residual gas in the vacuum chamber tov12..rd the input port of the diffusion pump produced a noticable wind at pressures above 10-S Torr. The pan vTould appear to get heavier \·lhen t he shutter, C.irectly beneath i t , was opened.
IVhen the region around the furnace was evolving gas because of a sudden increase in furnace temperature, an upward wind was often observed. This wind made the mi cro-balance pan appear lic::hter upon opening of the shutter.
appear as an increase in pm1 weight \·Ti th the shutter
closed, \vhich could not be reversed by heating of the pan.
1.'lhen the supply of metal in the crucible \vas running
out, the deposit rate at constant crucible temperature was
observed to fall off gradu~lly. A formula to correct the
observed deposit rate for the effect of decrea.sing impulse
will now be derived.
Let \/0 be the weight of the pan before the shutter is
opened. At the time t1 the shutter is opened and mass is
allowed to deposit on the pan until a time t2 when the
shutter is closed. The following equations can be written
for the apparent weight of the pa.n at the t'\o!O t illieS t
1 and
t,
t2: ·..:1
=
W0 - F1 and 1·12=
':10 - F2+
l
t;(1)J
T.
The observed1",
deposit rate, Gobs, is then ( W2-'.v1 )/( t 1-t2). Using the
F. The Photomultiplier Detector
Bell {l?) states
th
~
t
the photographic process isuseful for the study of ~bsorption lines with equivalent
widths greater than 2 mA0 • i'{ork was undertal{en to design
a photomultiplier detector which could be used for lines
as smal l as .4 mA0 in equivalent width.
The grating used for this work was mounted in a 21
ft. 10 in. Ro'dland spectrocraph and had a ruled area 12
em. by 5 em. with 600 rulings per
mm
.
Using a n.:!.I'roH line emission source, the entr~nce slit of the spectrosraphHas closed until maximum sharpness of the imaGe \vas
ob-tained, and further narrowine_: of the slit merely decreased
the output light intensity. This entrance slit wi dth, at
wi:~ich maximum resolution was obtu.ined, vias found to be
30 microns. The dispersion of the spectrogr aph was 1.25
mA0/micron in the second order. The magnification at
3000
A
0 of the image of the entrance slit was 1.06. Thusmonocr~omatic li ght at 3000 A0 should appear to have a
spread of at least
50
mA0 at the image plane of the grating.In practice, Vfhen doppler broadened absorption lines \vith
full widths at half maximum o:f
8
mA0 were imaced by thespectrograph, they v1ere spread over a region o:f at least
100 mA0 •
This smearins of the doppler profiles of the absorp
-tion lines by the spectrograph meant th~t the ch~nse in
line of .4 mA0 equi val6nt '"iC.th \vou:d be less th<ln
1%,
even at the center of the line. If this 1% change in con-tinuum intensity were detected by a photomultiplier whose output, when displ.:::.yec on .:::. meter or chart re;corder, \vas.:::.djusted to read continuum intensity as full scale, i t
would be im;ossible to me::sure the
1%
ch.:::.nce to an accuracy of5%.
'dith a continuum '•lhose intensity was constant to.01%, this problem could be solved by subtr.:::.cting & con-stant reference voltace from the continuum signal und dis-playing the difference vo:t .:::.c_e as full sca.le on a chGrt recorder. Using a difference sicn.:::.l equ~l to
5%
of the continuum SiGnal, the chai~.::·es in continuum bec.:.use of a1%
absorption line could then be measured to an accuracyof
5ro.
Unfortunately, the hish pressure mercury dischurge lamp used as a continuum source for ti1is ex1~eriment ·.-1as not stable as a function of tirre. Rapid variation in continuum intensity, of :.:.t least1%,
were very coillt":on.Also, the lamp output intensity decreased slov:ly as a fUnction of time becc.use of deposition of cooling \vater salts on the quartz \·rater jacket.
La• . .;rence' s thesis ( 21) A subtraction which allowed
10% of the continuum sign:_l to be displayed full sc :1le on a strip ch·~t recorder w~s used for most the work reported
here.
One technique of ec:_ui v:L::.ent v;id.th me ~.surement Hhich
1·i3.S considered employed a st:_tione!.ry slit, •,.;ide enough to cover the whole wave::.ensth interval into w~ich the spectre-srn.ph spre.:..d an absorption line. A shutter in the vacuum ch.::.mber, just above t he cruc:..ble orifice, vras used to b~ock
t Le at o;:ic oec:.m. l·:casurement of the difference in l ie:ht intensity, co:::ine; tr.rouch the >·:ide slit, vrith the atomic
be:un sr.utter open ~nd closed c.:.llo·::ed calculation of the
ec:.uivalent width of the line, provided the width of the
slit ,., as l:n o•:.rn •
Difficulties in positionins t ee slit accurately and lack of kno1·1ledc:;e of the exact Hidth of the spectrn.l reGion
over •:;hich the absorpt~on line vtas spread by the s:r,:ectro-.:::;:r.:::.ph meant that 2. minimum slit Hidth of 160 mA0 \vas neces-s:J.ry. E.ov:ever , the cban3e in sisnal from this Vlide s l i t
would be onJ.y .25% because of the presence of a line of
equivalent '.o:idth .4 rr:A0 • The noise limitations in the
pt.otocultiplier detector ·{1ere such, that even using the sub-traction technique) t l':is small chance in sisna.l could not be meas~ed to the desired accuracy of 10%.
The technic_ue which v:u.s adopted involved the use of
absorption line. Details of the design of the const~nt
velocity driving mechanism are .siven by G.
1-~.
Lawrence (2l ) .The use of this narroH exit s :at r esulted. in at leu.st a
factor of two increase i:o the vari&tion of t he continuum
sie;nal o.t the peak of a 2_ine :-:.s compared Hith the vari3.tion
when a wide slit ~·1as used. The scanninc; speed used Has
.
0025
in./min.(79.5
mA0/min. in second order). Variouschecks made on the constancy of this speed indicated that
i t \·las alvmys within less t hat
5.%
of the nominal value.Because the t\·Jo slits of the photoiDultiplier vrere
separated by only
6
A0 , i t was possible to study absorptionlines v:hich '.-Jere on the '.-Iinss of the pressure broadened
mercury emission lines where the continuum intensity vras
vo.ryins rapidly as a function of wavelength. In this case
t he photomultiplier has a definite advant at:,e over pho
to-sr aphic pl~tes because o.ccurate calibration of plates is
very difficult i f the continuum is varying rapidly.
Equivalent widths were obtained from the out~ut
tracings of the photomultiplier by drawing in a b~se line
representing the continuum sicnal in the absence of
absorp-tion and t hen measuring t he area under the line profile
t hus determined. '/lith the constant velocity scanner met~od,
equivalent widths as sm·..tll as .4 mA0 ,.,.ere measured with a
standard deviation of about
15%
.
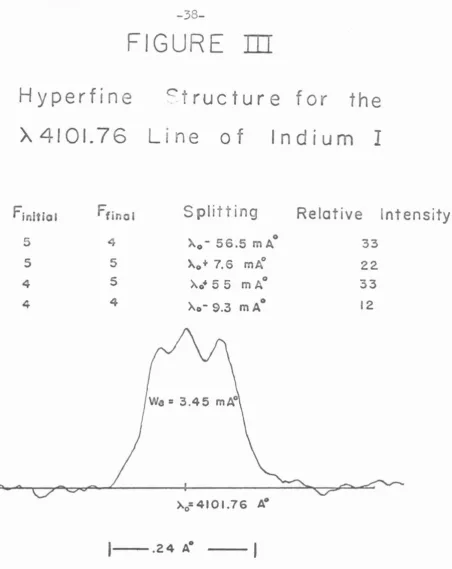
Fi(3ure III sho•.vs an actual tracing of t he indium I
which are separated by about 50 mA0 , are partially resolved.
Figure IV sho;:s two tracinss of an c.bsorption line
too ..,;eak to enable 1 ts equivalent v:idth to be measured accurately. T~is line i8 so so~ll that its profile is
FIGURE
ill
Hyperfine
<?tructure for the
A4101.76
Line of
Indium
I
Finitiol Ffino I
Spli
tt
ing
Relative Intensity
5
4 ~o- 56.5 mA 0 335
5
~.·7.6
mA0 22.4
5
>.o+5 5 mA
033
4 4 ~o- 9.3 m A 0 12.
FIGURE
ISl
Photomultiplier
Scanner
Output
Tracings
•
W8
=
.30 mAJ
j
-~/"'>o...~L\-~..-~~0-0..~
c/" .-. V.t..~ V'
~-t-.12
A-1
scanninot
d iroctionG. Temper e.ture ~-:easurements
Crucible te~peratures for all e~ements except t hallium were measured by lookinc into t he orifice of the crucible with an optical pyrometer. Corrections were made for the absorption of radi~tion by the \·.rindo·.·:s throu3h which the orifice 'vas vieued. These corrections are discussed in detail in Bell's thesis (l7).
The platinum to platinum 10% rhodium thermocouple
used to measure temperatures for th;,:.l lium ',\·as checked against the optical pyrometer at t emperatures bet,·:een 900 and 1150 °C. They vrere found to .::tgree to Hithin about 10 °C through-out t :::is temperature r ange. /~s wi ll be shown in the next section, the experimentally determined f-v.::tlues depended only on the square root of the absolute temperature for lines arising from the ground state. An error of 10 °K will therefore not appreciably effect the calcul::ted f
H. Discussion of Errors
All experimental results, r eported in the following
t ables, have been :.:.sted with their standard deviations
from the mean. The stand rd deviations r ange from a low
of about
5%
to a hie:;h of 13%. If the errors were purelyrandom, the stand:rd deviations could each be divided by
the factor Vn-1, uhere n uoul d be t he tote.l mmber of
determinations m2.de of the f-value in question, to get
an estimate of the error in t he mean. Because of
undeter-mined systematic errors, hovrever, this procedure \'I'Ould be
of l i t tle value.
The fo11oviii13 fornmla was used in calculation of
f-I
values from experimentally determined quantities: f
=
QCT/G.I
For 1tl
6
/4'A
0<.4,
that is, on the linear part of t he curve ofgrouth, t his becomes:.
f
=
constant [vf:
Q
(T
l •
f, 1\ ' ( •6
.
g, F.j
Estimates of the systematic errors in the above
quanti-ties will now be given.
We: The electronic circuits involved in translating
photomultiplier current into a tracing on the chart recorder
were accurate to 1%. The calibration of the planimeter
used to measure areas under line profiles \·las accurate to
.3%. The speed with which the line was scanned \vas perhaps
the major source of error. Attempts to measure i t
wr~ch could measure a speed of .0025 in./min. with an
accuracy of
1%. A
reason<lble estim:Jte of the scanningspeed error \"/ould. be 1;'(, for a given setting of the
scan-ner. This systemat::·.: ... rror vrould probably have varied
for different positions of the drive screw and
spectro-meter camera.
G: The electronics of the automatic microbalance
and the strip chart recorder were accurate to at le<1st
1%.
The vacuum calibration of the balance, using standard
.1%
1 mgm. riders, was accurate to
.5%.
Errors in determiningthe deposit r c..tes from the output tro..cings were all random.
T: !}. conservative estimute of the error in
temper-ature \-lould be 20 oK. At 1000 °K this vrould be an error
of
1%
in the square root of T.Q: The light be£'.m v1as typically 1.6 in. above the
crucible orifice. Errors in measuring the geometrical
quanti ties in Q 1.vere small. Errors in Q vrere thus less
than
Sin)':
't
''~'aS kept as large as possible to IDeike theeffective doppler width of the atomic beam as laree as
:possible. The distances to be measured in determining
~were less than
.5
in. Lack of knowledse of the exactlocation of the effective crucible orifice effected the
accuracy of the determination of sin~. Errors introduced
by sin¥ were less than
1%.
B.F.: For lines from levels more than .2
ev.
aboveof about
3%
in the deterr.1ination of the population of theexcited state.
The effect of the l ight beam being a thin sheet
in-stead of a pencil of rays Has examined theoretically.
','lith the light beam passing 1.6 in. above the crucible
orifice the error from t his so~rce would not be more than
.3
%
for a total lic:;ht berun \vidth of .25 in.The effect of an appreci~ble amount of scattered
l ight \'lould be to shift t he experimental curve of srowth
and, therefore, make i t impossible to fit with a single
parameter. The curve of e:rowth shovrn in figure V indicates
a very good fit with one para~eter. This, in turn,
indi-cates the presence of nesligable scattered l ieht.
Tbe comparison of rne.:tsured impulse forces Hith t C..ose
calculated from the atomic beam theory showed agreE.r.aent
to within about 1%. The syste~at1c errors, bec&use of the combined effects of atoms bouncing off the pan and
deviations in the velocity distribution of the atomic beam
caused by collisions at the crucible orifice, are
esti-mated to be not more than 2%.
If all the systematic sources of error combined in
the worst possible way, the above estim.::::.tes lead to a
maximum systematic error of
13%
for ·lines arising fromlevels within .15 ev. of the ground state, and about 16%
IV. EXPERH2~ITAL RESULTS
In the following six sections t he experimental results
of the Hork on 25 lir of six elements will be presented.
The particular featur, of ee>.ch element vlhich are relevant
to the measurer.1ent of its absolute f-values \'lith the
atomic beam apparatus are discussed.
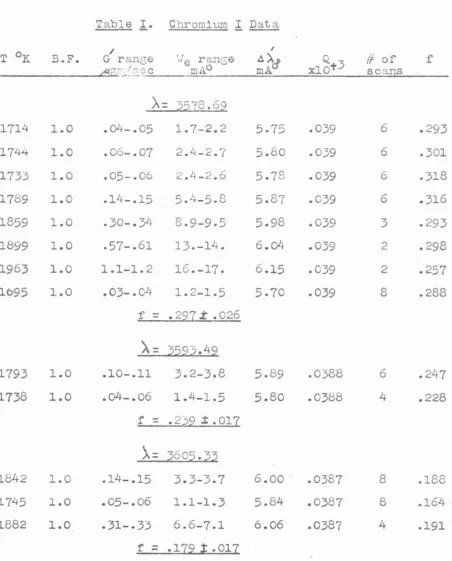
Tables I through VI contain the import~nt experimental
quantities which entered into the cal culation of absolute
f-values. The \vavelength of the transition and the mean
of the measured f-values are civen for e~ch line. The
uncertainty listed is t ho standard deviation of the
experi-mental sample. The first column in each table gives the
crucible temperature in
°K,
and t he second column givesthe calculated Boltzmann factor for that temperature.
The dat a v:ere taken by keeping the crucible at a. constant
temperature and sc3nning back and forth across t he line,
reading the deposit r ate each time the sc9.nner passed over
the line. The third column gives t he IJinimum and maximum
Eoltzmru1n factor corrected deposit rates observed at the
single crucible temperature. In the fourth column the
min-imum and m~~imum equivalent widths are t abulated. The fifth
column lists the atomic beam doppler width calculated at the
temperature given in the first column. The sixth column
gives Q in the appropriate units to allO\'f' cc.lculation of
the f-value using equation
8.
The seventh column indicatesthe number of scans made, and the final one
contains
tbe [image:49.563.55.485.36.709.2]A. Chromium
1.
The astrophysical importance of chromium has motivated a considerable amount of p::st v10rk in this laboratory on
the absolute f-values of the six strong absorption l ines from the ground state. It wc.s felt th3.t further \"/Ork on
chromium was necessary bec~use of the disagreements and inconsistencies in the results of previous investigations.
Chromium presented no difficult experimental problems.
No hyperfine structure of the e;round state has been observed
(23)
The ground term of chromium,
a7s3,
is single , and there are no other low lying terms; therefore, 100% ofthe atoms are in the sround state at temperat~res reached during this experiment.
Chromium has an unusually hiGh vapour pressure \·thil e still in the solid state. In fact, all the runs m~de on chromium were made below the melting ten:per:::...ture. Since i t was observed t hat elements with a tendency to sublime will sputter i f heo.ted in the pov1der form, only lUirps of
99
.5
%
pure chromium were used. Zirconia crucibles Hereused on all chromium runs o.nd appeared to undergo no chem-leal reaction ~·:ith the hot chromium. Chromium vapour tended to condense on the cooler parts of the zirconia
crucibles, which unfortunately -.,.,rere around the orifice.
This deposition produced a tunnel lectding from the interior of the crucible to the orifice. For the !~ghest deposit
crucible rose to above .2 Torr, this tunnel may h~ve
ef-fected the velocity distribution of the outgoing beam.
Most of the work done on chromium r1as c:.rried out at low
atomic bexm densities to keep the mean free path of the
atoms in the crucible long, compared to the orifice
dimen-sions.
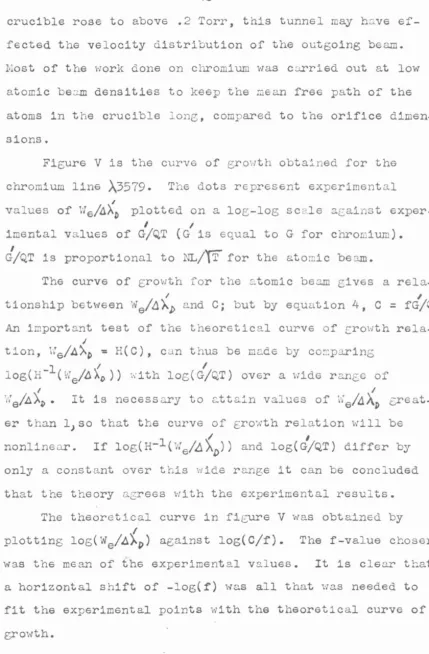
Figure V is the curve of growth obtained for the
chromium line
A3579.
The dots represent experiment alI
values of He/~Xb plotted on a loe,-log scc.le asainst
exper-' I
imental values of G/QT (G is equal toG for chromium).
I
G/QT is proportional to NL/\T for the atomic beam.
The curve of growth for the atomic beam gives a
rela-' I
tionship between We/11'/..p and C; but by equation 4, C
=
fG/QT.An important test of the theoretical curve of t:roHth
rela-'
tion, h'e/AAp = H(C), can t hus be made by co::p3.I'ing
1 I I
log(H- (vlefl1A~ )) ·.\·ith log(G/QT) over a uide r ange of
I I
'11'
9
/A}.~. It is necess<:iry to at tain values of h·ef41A~ creat-er than lJso that the curve of growth relation will be
/ I
nonline<lr. If log(H-1(1:e/LlAp)) and log(G/QT) differ by
only a constant over t his wide r ange i t can be concluded
that the theory agrees \·lith the experimental results.
The theoretical curve in fisure V \'ras obtained by
I
plotting log(W
6
/~~~) against log(C/f). The f-value chosenwas the mean of the experimental values. It is clear that
a horizontal shift of -log(r) was all that was needed to
fit the experimental points with the theoretical curve of
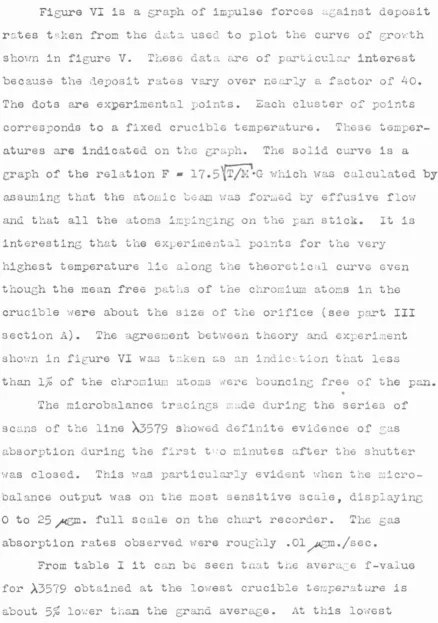
[image:51.559.52.481.56.709.2]Figure VI is a sraph of impulse forces ~Gainst deposit r<:.tes t slcen from the d<.:.t-:1 used to plot the curve of e::rO\·:th sho\m in fie;ure V. These data are of part.iculc:.r interest because the deposit rates vary over near:y a factor of 40.
The dots are ex~6rimental points. Each cluster of points
corresponds to a fixed crucible temperature. These temper-atures are indicated on the craph. The solid curve is a
c:raph of the relation F •
17
.
s'{T
/M'·G
which was calculated by assuming that the ato1l1ic bGa.m uas :forwed by effusive flmvand that all the atoms impinsins on the pan stick. It is interestinG t hat the ex1Jerimental po.iYJts for the very hishest temperature lie a:ong the theoretical curve even
though the mean free pa.tils of the cl"..romiurn atoms in the
crucible were about the size of the orifice (see part III
section A). The a(9'eeJi1ent betHeen theory and exr;eriment sh01·:n in fieure VI was t .:::.ken c:.s an indic=..tion tnat less
than
1,%
of the cl1.rooiun1 :.~.toms -~..,ere bouncine, free of the pan •..
The microbalance tracings made during the series of scans of the line
A3
579
showed definite evidence of ,:as absorption during the first t 1:o minutes .:1fter the shutter was closed. This,.,as
particularly evident \>'hen the :Jicro-balance output \vas on the most sensitive scale, displaying 0 to 25~- full scale on the ch~~t recorder. The sasabsorption rates observed \•Tere roughly .01 ~./sec.
From t able I i t can be seen tnat the avera.::::e f-value
for
).3
579
obtained at tbe lowest crucible temperature is [image:52.548.53.491.78.701.2]5
.5
we
{j,)..'D
FIGURE
V
CURVE
OF
GROWTH
Theoretical
Curve
f
=
.
2
99
~
CHROMIUM
>..3578
.6
9
.I
---,~----~---~---~
.1
.
5
I
_G_
5
I
0
a
125
F
)'gm
75
25
0
FIGURE
JZI
T=l789
T=l740
T=l700
Impulse
Force
vs.
Deposit
Rate
T::
&963
/
T=
18
9
9
T=l851
G
/'om/sec
.
50
1.0
temperature the deposit rate was rou0hly .03;U3ID·/sec.,
which is only 3 times the sas absorption rate obsarved after the shutter Has closed. This implies thHt the rate of sus absorption occunring d~ins the actual deposition of chromium •·•as not more t h.:.!.n • C02 ~r;m ./sec., because a higher._ rate i'lOUld have increased the observed deposit rate and
vTould have t hereby caused the calculated f-value to be more
than
5%
too loiv.Comparison of impulse forces received by the balance pan Hhen the shutter Ha.s o:pened i·:ith tr ... ose received i·rhen
the shutter \vas closed indic-:::.ted that rouchly the sa.we amount of gas vra.s be inc; driven off the pun upon exposm,e to the atomic beam as \vas absorbed in the period after the shutter was closed. These observations support the
hypot .. esis that a thin film of sas i·:eighing a few~. forms on the freshly deposited mete.l only after the stream of high temperature ~toms and radiation from the furnace stops, and that this gas is driven off asain once the
Table
I·
ChromiumI
Data/ I
T °K
B.F.
G r ane;e '.fe ranse ~~cf Q#
of' f'",..,._. /g ~c mA0 mA xlo-t
3
scansQJ··._.:::....'.::~
.A=
2~18.621714
1.0
.
04
-.
0
5
1.7-2.2
5-75
.0
39
6
.
293
1744
1.0
.
06
-.07
2
.
4
-
2
.
7
5.80
.0
39
6
.
301
1733
1.0
.05-.
06
2
.
4
-
2
.
6
5.7
8
.0
39
6
.
318
17
89
1.0
.1
4
-.15
5.4-5.8
5.87
.
039
6
.
316
1859
1.0
.30-.
34
8
.
9
-
9
.5
5.98
.
039
3
.
293
1899
1.0
.57-.
61
13
.-1
4
.
6
.04
.0
39
2
.
298
19
6
3
1.0
1.1-1.
2
1
6
.-
17.
6
.15
.0
39
2
.
257
1695
1.0
.03-.
04
1.2-1.5
5.70
.039
8
.
288
f
=
•
297
:t.
026
A=
2~22·421793
1.0
.10-.11
3
.2-
3
.8
5.89
.0
388
6
.
247
1738
1.0
.04-.06
1.4-1.5
5.80
.03
88
4
.
228
f
=
•
232
.t.
017
>-=
;260~·221842
1.0
.
14
-.15
3
.
3
-
3
.7
6
.00
.0
387
8
.
188
1745
1.0
.05-.06
l.l-1.3
5.84
.03
87
8
.
164
1
882
1.0
.31-.33
6
.
6
-7.1
6.06
.038
7
4
.191
[image:56.554.56.508.68.629.2]Table
1·