Identifying Important Features for Graph Retrieval
Zhuo Li and Sandra Carberry and Hui Fang* and Kathleen F. McCoy
[email protected] [email protected] [email protected] [email protected]
Department Computer and Information Science, *Department of Electrical and Computer Engineering
University of Delaware
Abstract
Infographics, such as bar charts and line graphs, occur often in popular media and are a rich knowledge source that should be accessible to users. Unfortunately, information retrieval re-search has focused on the retrieval of text documents and images, with almost no attention specif-ically directed toward the retrieval of information graphics. Our work is the first to directly tackle the retrieval of infographics and to design a system that takes into account their unique charac-teristics. Learning-to-rank algorithms are applied on a large set of features to develop several models for infographics retrieval. Evaluation of the models shows that features pertaining to the structure and the content of graphics should be taken into account when retrieving graphics and that doing so results in a model with better performance than a baseline model that relies on matching query words with words in the graphic.
1 Introduction
Infographics are non-pictorial graphics such as bar charts and line graphs. When such graphics appear in popular media, they generally have a high-level message that they are intended to convey. For example, the graphic in Figure 1 ostensibly conveys the message that Toyota has the highest profit among the automobile companies listed. Thus infographics are a form of language since, according to Clark (Clark and Curran, 2007), language is any deliberate signal that is intended to convey a message.
Although much research has addressed the retrieval of documents, very little attention has been given to the retrieval of infographics. Yet research has shown that the content of an infographic is often not included in the article’s text (Carberry et al., 2006). Thus infographics are an important knowledge source that should be accessible to users of a digital library.
Techniques that have been effective for document or image retrieval are inadequate for the retrieval of infographics. Current search engines employ strategies similar to those used in document retrieval, relying primarily on the text surrounding a graphic and web link structures. But the text in the surround-ing document generally does not refer explicitly to the infographic or even describe its content (Carberry et al., 2006). An obvious extension to using the article text would be to collect all the words in an infographic and use it as a bag of words. However, infographics have structure and often a high-level message, and bag of words approaches ignore this structure and message content.
This paper explores the features that should be taken into account when ranking graphics for retrieval in response to a user query. Using a learning-to-rank algorithm on a wide range of features (including structural and content features), we produce a model that performs significantly better than a model that ignores graph structure and content. Analysis of the model shows that features based on the structure and content of graphs are very important and should not be ignored. To our knowledge, our research is the first to take graph structure and content into account when retrieving infographics.
This work is licenced under a Creative Commons Attribution 4.0 International License. Page numbers and proceedings footer are added by the organizers. License details:http://creativecommons.org/licenses/by/4.0/
Figure 1: An Example Infographic
2 Related Work
Information retrieval research has focused on the retrieval of text documents and images. Two popular approaches to text retrieval are the vector space method and probabilistic methods. The vector space method (Dubin, 2004) represents the document and the query each as a vector of weighted words and then uses a similarity function to measure the similarity of each document to the query. Most weighting mechanisms reward words that occur frequently in both the document and query but infrequently in the overall collection of documents. Probabilistic retrieval models instead estimate the probability that a document is relevant to a user query. In recent years, the language modeling approach has shown promise as a retrieval strategy with sound statistical underpinnings (Lv and Zhai, 2009; Manning et al., 2008). In all of the above approaches, query expansion techniques have been used to expand the query with synonyms and related words before ranking documents for retrieval. Work on short document and query expansion have shown improvements in retrieval performance (Arguello et al., 2008; Escalante et al., 2008; Metzler and Cai, 2011).
Work in Content Based Image Retrieval (CBIR) (Datta et al., 2008) has progressed from systems that retrieved images based solely on visual similarity, relying on low-level features such as color, texture and shape ( (Flickner et al., 1995; Swain and Ballard, 1991; Smith and Chang, 1997; Gupta and Jain, 1997), among others), to systems which attempt to classify and reason about the semantics of the images being processed (Bradshaw, 2000; Smeulders et al., 2000; Datta et al., 2008). However, images are free-form with relatively little inherent structure; thus it is extremely difficult to determine what is conveyed by an image, other than to list the image’s constituent pieces. Most systems that retrieve infographics, such as SpringerImages (http://www.springerimages.com) and Zanran (http://www.zanran.com), are based on textual annotations of the graphics as in image retrieval (Gao et al., 2011) or on matching the user’s query against the text surrounding the graphic. However, the structure and content of the graph are not taken into consideration.
In this paper, we focus on natural language queries given that such queries allow users to express their specific information need more clearly than keywords (Phan et al., 2007; Bendersky and Croft, 2009). Previous work on verbose and natural language queries (Bendersky and Croft, 2008; Liu et al., 2013) used probabilistic models and natural language processing techniques to identify the key contents in such queries. Our query processing method not only extracts key entities but also further classifies the extracted key entities into different components using a learned decision tree model.
3 Problem Formulation
Our research is currently limited to two kinds of infographics: simple bar charts and single line graphs. We assume that our digital library contains an XML representation of each graphic that includes 1) the graphic’s image, 2) its structural components: the set of independent axis (x-axis) labels1, the entity being measured on the dependent axis (y-axis), and the text that appears in the graphic’s caption, referred to asGx,Gy, andGc respectively, and 3) the graphic’s intended messageGmand any entitiesGf that the
message focuses on. This paper is not concerned with the computer vision problem of recognizing the bars, labels, colors, etc. in a graphic; other research efforts, such as the work in (Chester and Elzer, 2005; Futrelle and Nikolakis, 1995) are addressing the parsing of electronic images such as bar charts and line graphs.
Prior research on our project has addressed issues that arise in recognizing Gy, Gm, andGf. The dependent axis of an infographic often does not explicitly label what is being measured, such as net profit in Figure 1, and these must be inferred from other text in the graphic. Our prior work (Demir et al., 2007) identified a hierarchy of graphic components in which pieces of the entity being measured might appear; a set of heuristics were constructed that extracted these pieces and melded them together to form what we refer to as a measurement axis descriptorand which is Gy. The project’s prior work also identified a set of 17 categories of intended message, such asRank,Relative-difference, Maximum, andRising-trend, that might be conveyed by simple bar charts and line graphs; a Bayesian system (Elzer et al., 2011; Wu et al., 2010) was developed that utilizes communicative signals in a graphic (such as the coloring of one bar differently from the other bars) in order to recognize a graphic’s intended message, including both the message category and the parameters of the message such as any focused entity. For example, the intended message of the bar chart in Figure 1 is ostensibly that Toyota has the highest net profit of any of the automobile manufacturers listed; thus its message falls into the Maximummessage category and its focused entity isToyota.
Our vision is that since graphics have structure and content, the users whose particular information needs could be satisfied by an infographic will formulate their queries to indicate the requisite structure of the desired graphics. Thus we assume the use of full-sentence queries so that the semantics of the query can be analyzed to identify characteristics of relevant graphics. For example, consider the following two queries that contain similar keywords but represent different information needs:
Q1: Which countries have the highest occurrence of rare diseases? Q2: Which rare diseases occur in the most countries?
These two queries contain almost identical words but are asking for completely different graphics. Query
Q1 is asking for a comparison of countries (independent axis) according to their occurrence of rare
dis-eases (dependent axis) while queryQ2is asking for a comparison of different rare diseases (independent
axis) according to the number of countries in which they occur (dependent axis). In addition, both queries are asking for a graphic with aRankmessage that ranks countries (queryQ1) or rare diseases (queryQ2)
as opposed to a graphic that shows the trend in rare diseases throughout the world.
4 Methodology
To retrieve relevant graphics in response to a user query, the query will first be analyzed to identify requi-site characteristics of relevant infographics. We have developed learned decision trees (Li et al., 2013a; Li et al., 2013b) for analyzing a query and identifying the requisite structure of relevant infographics (the content of the independent axis or x-axis and dependent axis or y-axis, referred to asQxand Qy), and the category of intended message and focused entity, if any, (referred to asQm andQf) that will best satisfy the user’s information need.
Given a new user query, it is parsed and noun phrases are extracted. Each query-phrase pair, consisting of a query and an extracted noun phrase, is processed by a decision tree that determines whether the noun phrase represents x-axis content, y-axis content, or neither. Attributes used by this decision tree include whether the main verb of the query is a comparison verb (such as “differ” and “compare”) or a trend verb (such as “change” and “decrease”), whether the noun phrase is preceded by a quantity phrase such as “the number of” suggesting that the noun phrase specifies y-axis content of relevant infographics, and whether the noun phrase describes a period of time.
intended message. Other attributes include the presence of a superlative or comparative in the query and attributes depending on the identified content of the x and y axes by the axes decision tree, such as the number of x-axis entities, their plurality, and whether an x-axis entity describes a time interval. A third decision tree is constructed for identifying whether a noun phrase describes a specific focused x-axis entity. Then the infographics in the digital library must be rank-ordered according to how well they satisfy the requirements of the user query.
This paper is concerned with identifying the most important features in a metric for rank-ordering the graphics in response to a user query. We experiment with two learning-to-rank algorithms and 56 features that include both general features such as bag of words comparisons and structural and content features. Our hypothesis is that structural and content-based features play an important role in graph retrieval and cannot be ignored. Section 5 discusses the features used in our experiments, Section 6 discusses the learning algorithms, Section 6.1 compares the resultant models with a baseline that uses just general features treating query and graphic each as one bag of words, and Section 6.2 discusses the features that appear most influential in the models.
5 Features
We consider three kinds of features: 1) general features that compare words in the query with words in the graphic, 2) structural features that compare the requisite structure hypothesized from the query with the structure of candidate infographics, and 3) content-based features that compare the requisite message hypothesized from the user query with the intended message of candidate graphics.
Query expansion is a commonly used strategy in information retrieval to bridge the vocabulary gap between terms in a query and those in documents. The basic idea is to expand the original query with terms that are semantically similar to the ones in the query. This addresses the problem encountered when the query uses the word carbut the document uses the term automobile. But retrieval of information graphics presents an additional problem. Consider a query such as “Which car manufacturer has the highest net profit?” A graphic such as the one in Figure 1 displays a set of car manufacturers on the x-axis (Toyota, Nissan, etc.) but nowhere in the graphic does the wordcaror a synonym appear. Identifying the ontological category, such ascarorautomobile, of these labels is crucial since the user’s query often generalizes the entities on the independent axis of relevant graphs rather than listing them.
To expand a given text strings, we use Wikimantic (Boston et al., 2013), a term expansion method that uses Wikipedia articles as topic concepts. A topic concept is a unigram distribution built from words in the Wikipedia article for that topic. A stringsis interpreted by Wikimantic into a mixture concept that is a weighted vector of topic concepts that capture the semantic meaning of the words ins. Each topic concept is weighted by the likelihood that the concept (Wikipedia article) generates the text strings. The weighted concepts are then used to produce a unigram distribution of words that serve as the expansion of the terms in the strings. One issue in graph retrieval is correlating the requisite x-axis content specified in the user query with the x-axis labels in graphs. A query such as “Which car manufacturer has ... ?” is requesting a graph where “car manufacturers” are listed on the x-axis. Thus we need to recognize individual x-axis words which are often proper nouns (e.g., “Ford”, “Nissan”, “Honda”) as instances of car manufacturers. In the case of labels on the independent axis (such asToyota, Nissan,Honda, etc.), words such ascarorautomobileare part of the produced unigram distribution — that is, as a side effect, the ontological category of the individual entities becomes part of the term expansion.
5.1 General Features
Our general feature set includes 17 general features capturing a variety of different kinds of relevance scorings between two bags of words consisting respectively of words from the user query and words from the candidate infographic:
• GF1: A modified version of Okapi-BM25 (Fang et al., 2004) calculated as:
Okapi-BM25 Score =Pw∈Qlogdf|Dw|+1+1 ·tfw·(1+k1)
tfw+k1
where Qis a query, |D| is the number of graphs in the digital library, w is a query word in Q,
dfw is the frequency of graphs containing word w in the digital library, tfw is the frequency of wordwin the text expansion of the given graphic, andk1 is a parameter that is typically set to 1.2. Okapi-BM25 is a bag-of-words ranking function used in many information retrieval systems. Our modified version of Okapi-BM25 addresses the problem of negative values that can occur with the original Okapi formula. In addition, our formula does not take text length or query term frequency into account since graphics have relatively similar amounts of text and most terms in a query occur only once.
• GF2: The term frequency-inverse document frequency (tf-idf) value of query words that appear in the expanded graphic.
• GF3: The maximum, minimum, and arithmetic mean of the term frequency (tf) of query words that
appear in the expanded graphic.
• GF4: The maximum, minimum, and arithmetic mean of inverse document (graphic) frequency (idf)
of query words that appear in the expanded graphic.
5.2 Structural Features
Our structural feature set includes 35 features: 17 that address how well a graphic’s x-axis (independent axis) relates to the requisite x-axis content hypothesized from the user’s query and 18 that address how well a graphic’s y-axis (dependent axis) content captures the requisite dependent axis content hypothe-sized from the query. The following are a few of the x-axis features:
• SF X1: The Okapi-BM25 value using the same modified formula as for general features, given the query x-axis words and the text expansion of the x-axis labels in the graphic.
• SF X2: The tf-idf of x-axis words hypothesized from the query that appear in the expansion of the
x-axis labels in the graphic.
• SF X3: The maximum, minimum, and arithmetic mean of tf of x-axis words hypothesized from the
query that appear in the expansion of the x-axis labels in the graphic.
• SF X4: The maximum, minimum, and arithmetic mean of idf of x-axis words hypothesized from the query that appear in the expansion of the x-axis labels in the graphic.
The y-axis features (SF Y1, SF Y2,SF Y3, andSF Y4) include the same relevance measurements as used for the x-axis features; for example, feature SF Y1 captures the Okapi-BM25 score for the y-axis
content hypothesized from the query and the text expansion of the graphic y-axis words, and feature
SF Y2 is the tf-idf score for the y-axis content hypothesized from the query and the expansion of the graphic y-axis words. One additional feature that is specific to the y-axis is:
• SF Y5: The posterior probability of the Wikimantic (Boston et al., 2013) mixture concept2 for the y-axis words hypothesized from the query, given the Wikimantic mixture concept representing the y-axis words in the graph, referred to asp(Qy|Gy). Both query y-axis words and the graphic y-axis
descriptor are each interpreted by Wikimantic into a mixture concept,Mqy andMgy respectively. Recall from the introduction to Section 5 that a mixture concept is a weighted vector of topic con-cepts that defines the semantic meaning of a term or set of terms. For example, the mixture concept for the country China is represented by a vector of topic concepts such as“China”,“People’s Re-public of China”,“Mainland China”, and so on. Wikimantic estimates the probability of a concept given another concept by the amount of overlapping words between the two concepts. For example, the topic concept for the country“United States”is likely to contain similar words to the concept for“China”, such as the words“country”,“nation”,“region”,“capital”,“GDP”, etc. Therefore the probability ofUnited StatesgivenChinais likely to be higher than that ofUnited Statesgiven the topic“rugby”.
5.3 Content Features
Our content feature set contains four features that address how well the intended message of a graphic captures the requisite message content hypothesized from the user’s query. Ideally, a relevant graphic’s intended messageGm will match the message categoryQm hypothesized from the user’s query. When the two do not match exactly, we use a hierarchy of message categories and the concept of relaxation
as the paradigm for estimating how much perceptual effort would be required to extract the message specified by the query from the graphic. For example, suppose that the query requests aRankmessage; graphics withRankmessages will convey the rank of a specific entity by arranging the entities in order of value and highlighting in some way the entity whose rank is being conveyed. Graphics with aRank-all
intended message will convey the rank of a set of entities without highlighting any specific entity; the
Rank-allmessage category appears as a parent ofRankin the message hierarchy since it is less specific thanRank. Although one can identify the rank of a specific entity from a graphic whose intended message is aRank-allmessage, it is perceptually more difficult since one must search through the graph for the entity whose rank is desired. By moving up or down the message hierarchy from Qm toGm, Qm is relaxed to match different Gm. The greater the degree of relaxation involved, the less message-relevant the infographic is to the user query. The four content-based features are:
• CF1: Whether the message categoryQm hypothesized from the user’s query matches exactly the intended message categoryGmof the graphic.
• CF2: The amount of relaxation needed to relax the message categoryQm hypothesized from the user’s query so that it matches the intended message categoryGmof the graphic.
• CF3: The Okapi-BM25 value given the intended message focused entityQf (if any) hypothesized from the user’s query and the focused entityGf in the graphic, if any.
• CF4: The Okapi-BM25 value given the intended message focused entity Qf(if any) hypothesized from the user’s query and the non-focused x-axis entitiesGnf in the graphic.
6 Constructing a Ranking Model for Graph Retrieval
Learning-to-rank algorithms (Liu, 2009) construct a learned model that ranks objects based on partially ordered training data. Tree-based ensemble methods have been shown to be very effective (Chapelle and Chang, 2011). We experimented with two state-of-the-art tree-based learning-to-rank algorithms as implemented in the RankLib library (http://people.cs.umass.edu/vdang/ranklib.html): Multiple Additive Regression Trees abbreviated as MART (Friedman, 2001) and Random Forest (Breiman, 2001).
query-infographic pair was assigned a relevance score on a scale of 0-3 by an undergraduate researcher. A query-infographic pair was assigned 3 points if the infographic was considered highly relevant to the query and 0 points if it was irrelevant. Query-infographic pairs where the graphic was somewhat relevant to the query were assigned 1 or 2 points, depending on the judged degree of relevance of the graphic to the query. This produced a corpus for training and testing.
Using MART and Random Forest, we developed four models from all 56 features, including the structural and content features. Two of the models were built using our learned decision trees (Li et al., 2013b; Li et al., 2013a) to analyze the queries and hypothesize the requisite x-axis content, y-axis content, message category, and focused entity (if any); see the second row of Table 1. Since the learned decision trees are not perfect, the other two models were built from hand-labelled data; see the last row of Table 1. In addition, two baseline models were constructed using only the general features and omitting the structural and content-based features.
6.1 Evaluating the Models
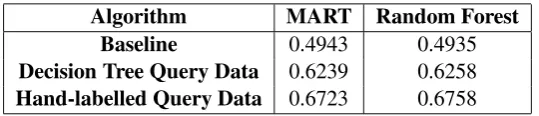
Normalized Discounted Cumulative Gain (NDCG) (J¨arvelin and Kek¨al¨ainen, 2002) is used to evaluate the retrieval result. Table 1 displays the NDCG@10 results. In each case, we averaged together the NDCG results of 10 runs using the Bootstrapping Method (Tan et al., 2006) in which the query data set is sampled with replacement to select 152 queries; these 152 queries, and for each query the relevance judgements assigned to each of the graphics, comprised the training set, with the unselected queries and their relevance judgements comprising the testing set. The Bootstrapping method is a widely used evaluation method for small datasets. Typically, approximately 63% of the dataset is selected for the training set (with some items appearing more than once in the training set) and 37% for the testing set. The second row of Table 1 provides results when each query is processed by our learned decision trees to extract the structural content and message category that the query specifies. However, the decision trees are imperfect. To determine whether our system could do even better if the decision trees were improved, the third row of Table 1 reports results when each query was hand-labelled with the correctly extracted structural and message content.
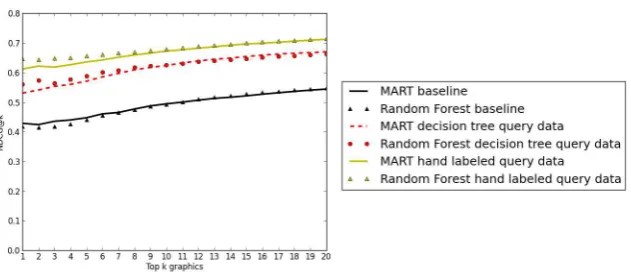
The models using all 56 features produced significantly better results than the baseline model that used just the general features, indicating that structural and content-based features are very important and must be taken into account in graph retrieval. In addition, the models built from the hand-labelled data produced better results than the models where the structural and content features were automatically extracted from the queries using the learned decision trees; this suggests that improving the decision trees that process the queries would improve the accuracy of the learned graph retrieval models. In some cases, the Random Forest learned model performed better than the MART model, but the improvement was not significant. The experimental results show that both MART and Random Forest using all 56 features, either using the hand-labelled query data or decision tree query data, provide significantly better results than the baseline approach (p<0.0005).
Algorithm MART Random Forest
Baseline 0.4943 0.4935
Decision Tree Query Data 0.6239 0.6258
Hand-labelled Query Data 0.6723 0.6758
Table 1: NDCG@10 Results
Figure 2: NDCG@k for Various Values ofn
6.2 Analysis of Influential Features
In both MART and Random Forest, features that are used at the top levels of each tree are more important in ranking a graphic than features that appear lower in the tree. We analyzed the importance of each of the 56 features based on the level in each tree where the feature is first used. 70% of the top ten most important features in the trees produced by both MART and Random Forest were structural or content features. The most influential two features in trees produced by MART were SFY5 which captures
p(Qy|Gy) and SFX2which captures the tf-idf of x-axis words hypothesized from the query that appear
in the expansion of the x-axis labels in the graphic. Although these two features were not the two most influential features in the trees produced by Random Forest, they did appear among the top 5 features. Two content-based features appeared among the top ten most important features: CF3which
captures the relevance of the focused entity Qf (if any) hypothesized from the query to the focused entityGf (if any) in the graphic and CF4which captures the relevance of the focused entityQf (if any) hypothesized from the query to the non-focused entitiesGfx in the graphic. The content features CF1
and CF2 that measure relevance of the message category hypothesized from the query to the intended
message category in a candidate graphic appeared among the top 20 features but not among the top 10 features. Further inspection of the trees and analysis of the queries and graphics leads us to believe that message category relevance is influential in refining the ranking of graphics once graphics with appropriate structural content have been identified. Our future work will examine these two features more closely and determine whether modifications of them, or changes in how they are used, will improve results.
Based on these results, we conclude that structural and content-based features are important when ranking infographics for retrieval and must be taken into account in an effective graph retrieval system. 7 Conclusion and Future Work
To our knowledge, no other research effort has considered the use of structural and content-based fea-tures when ranking graphics for retrieval from a digital library. We developed learned models that take into account how well the structure and content of an infographic matches the requisite structure and con-tent hypothesized from the user query, and showed that these models perform significantly better than baseline models that ignore graph structure and message content. In addition, an analysis of the learned models showed which structural and content features were most influential. In our future work, we will improve our methods for hypothesizing requisite features of relevant graphics and will analyze our re-laxation metric to determine whether an improved metric will play a more influential role in ranking graphics for retrieval.
Acknowledgements
References
Jaime Arguello, Jonathan L Elsas, Jamie Callan, and Jaime G Carbonell. 2008. Document representation and
query expansion models for blog recommendation.ICWSM, 2008(0):1.
Michael Bendersky and W Bruce Croft. 2008. Discovering key concepts in verbose queries. InProceedings of the
31st annual international ACM SIGIR conference on Research and development in information retrieval, pages 491–498. ACM.
Michael Bendersky and W Bruce Croft. 2009. Analysis of long queries in a large scale search log. InProceedings of the 2009 workshop on Web Search Click Data, pages 8–14. ACM.
Christopher Boston, Hui Fang, Sandra Carberry, Hao Wu, and Xitong Liu. 2013. Wikimantic: Toward effective disambiguation and expansion of queries.Data & Knowledge Engineering.
Ben Bradshaw. 2000. Semantic based image retrieval: a probabilistic approach. InProceedings of the eighth ACM
international conference on Multimedia, pages 167–176. ACM.
Leo Breiman. 2001. Random forests.Machine Learning, 45(1):5–32.
Sandra Carberry, Stephanie Elzer, and Seniz Demir. 2006. Information graphics: an untapped resource for digital
libraries. InProceedings of the 29th annual international ACM SIGIR conference on Research and development
in information retrieval, pages 581–588. ACM.
Olivier Chapelle and Yi Chang. 2011. Yahoo! learning to rank challenge overview. InYahoo! Learning to Rank
Challenge, pages 1–24.
Daniel Chester and Stephanie Elzer. 2005. Getting computers to see information graphics so users do not have to. InFoundations of Intelligent Systems, pages 660–668. Springer.
S. Clark and J.R. Curran. 2007. Wide-coverage efficient statistical parsing with ccg and log-linear models. Com-putational Linguistics, 33(4):493–552.
Ritendra Datta, Dhiraj Joshi, Jia Li, and James Z Wang. 2008. Image retrieval: Ideas, influences, and trends of the
new age.ACM Computing Surveys (CSUR), 40(2):5.
Seniz Demir, Sandra Carberry, and Stephanie Elzer. 2007. Effectively realizing the inferred message of an
in-formation graphic. InProceedings of the International Conference on Recent Advances in Natural Language
Processing (RANLP), pages 150–156.
David Dubin. 2004. The most influential paper gerard salton never wrote.
Stephanie Elzer, Sandra Carberry, and Ingrid Zukerman. 2011. The automated understanding of simple bar charts.
Artificial Intelligence, 175(2):526–555.
Hugo Jair Escalante, Carlos Hern´andez, Aurelio L´opez, Heidy Mar´ın, Manuel Montes, Eduardo Morales, Enrique Sucar, and Luis Villase˜nor. 2008. Towards annotation-based query and document expansion for image retrieval. InAdvances in Multilingual and Multimodal Information Retrieval, pages 546–553. Springer.
Hui Fang, Tao Tao, and ChengXiang Zhai. 2004. A formal study of information retrieval heuristics. In
Proceed-ings of the 27th Annual International ACM SIGIR Conference on Research and Development in Information Retrieval, SIGIR ’04, pages 49–56, New York, NY, USA. ACM.
Myron Flickner, Harpreet Sawhney, Wayne Niblack, Jonathan Ashley, Qian Huang, Byron Dom, Monika Gorkani, Jim Hafner, Denis Lee, Dragutin Petkovic, et al. 1995. Query by image and video content: The qbic system.
Computer, 28(9):23–32.
Jerome H. Friedman. 2001. Greedy function approximation: A gradient boosting machine. The Annals of
Statis-tics, 29(5):1189–1232, 10.
Robert P Futrelle and Nikos Nikolakis. 1995. Efficient analysis of complex diagrams using constraint-based parsing. InDocument Analysis and Recognition, 1995., Proceedings of the Third International Conference on, volume 2, pages 782–790. IEEE.
Y. Gao, M. Wang, H. Luan, J. Shen, S. Yan, and D. Tao. 2011. Tag-based social image search with visual-text
joint hypergraph learning. InProceedings of the 19th ACM international conference on Multimedia, pages
Amarnath Gupta and Ramesh Jain. 1997. Visual information retrieval.Communications of the ACM, 40(5):70–79. Kalervo J¨arvelin and Jaana Kek¨al¨ainen. 2002. Cumulated gain-based evaluation of ir techniques.ACM Trans. Inf.
Syst., 20(4):422–446, October.
Zhuo Li, Matthew Stagitis, Sandra Carberry, and Kathleen F. McCoy. 2013a. Towards retrieving relevant
informa-tion graphics. InProceedings of the 36th International ACM SIGIR Conference on Research and Development
in Information Retrieval, SIGIR ’13, pages 789–792, New York, NY, USA. ACM.
Zhuo Li, Matthew Stagitis, Kathleen McCoy, and Sandra Carberry. 2013b. Towards finding relevant information graphics: Identifying the independent and dependent axis from user-written queries.
Jingjing Liu, Panupong Pasupat, Yining Wang, Scott Cyphers, and Jim Glass. 2013. Query understanding
en-hanced by hierarchical parsing structures. InAutomatic Speech Recognition and Understanding (ASRU), 2013
IEEE Workshop on, pages 72–77. IEEE.
Tie-Yan Liu. 2009. Learning to rank for information retrieval. Foundations and Trends in Information Retrieval, 3(3):225–331.
Yuanhua Lv and ChengXiang Zhai. 2009. Positional language models for information retrieval. InProceedings
of the 32nd international ACM SIGIR conference on Research and development in information retrieval, pages 299–306. ACM.
Christopher D Manning, Prabhakar Raghavan, and Hinrich Sch¨utze. 2008. Introduction to information retrieval,
volume 1. Cambridge university press Cambridge.
Donald Metzler and Congxing Cai. 2011. Usc/isi at trec 2011: Microblog track. InTREC.
Nina Phan, Peter Bailey, and Ross Wilkinson. 2007. Understanding the relationship of information need specificity
to search query length. InProceedings of the 30th annual international ACM SIGIR conference on Research
and development in information retrieval, pages 709–710. ACM.
Arnold WM Smeulders, Marcel Worring, Simone Santini, Amarnath Gupta, and Ramesh Jain. 2000. Content-based image retrieval at the end of the early years. Pattern Analysis and Machine Intelligence, IEEE Transac-tions on, 22(12):1349–1380.
John R Smith and Shih-fu Chang. 1997. Querying by color regions using the visualseek content-based visual query system.Intelligent multimedia information retrieval, 7(3):23–41.
Michael J Swain and Dana H Ballard. 1991. Color indexing.International journal of computer vision, 7(1):11–32.
Pang-Ning Tan, Michael Steinbach, Vipin Kumar, et al. 2006. Introduction to data mining. WP Co.
Peng Wu, Sandra Carberry, Stephanie Elzer, and Daniel Chester. 2010. Recognizing the intended message of line