Proceedings of the 27th International Conference on Computational Linguistics, pages 1332–1344 1332
Fine-Grained Arabic Dialect Identification
Mohammad Salameh† Houda Bouamor† Nizar Habash‡
†Carnegie Mellon University in Qatar ‡New York University Abu Dhabi
{msalameh,hbouamor}@qatar.cmu.edu [email protected]
Abstract
Previous work on the problem of Arabic Dialect Identification typically targeted coarse-grained five dialect classes plus Standard Arabic (6-way classification). This paper presents the first results on a fine-grained dialect classification task covering 25 specific cities from across the Arab World, in addition to Standard Arabic – a very challenging task. We build several classification systems and explore a large space of features. Our results show that we can identify the exact city of a speaker at an accuracy of 67.9% for sentences with an average length of 7 words (a 9% relative error reduction over the state-of-the-art technique for Arabic dialect identification) and reach more than 90% when we consider 16 words. We also report on additional insights from a data analysis of similarity and difference across Arabic dialects.
Title and Abstract in Arabic
éJK.QªË@ HAj.ê
ÊË@ YKYm
' ú
¯
J
¯YË@
J
JË@
, ú
¯@Q« , ú
j
.
JÊ
g) éJK.QªË@ £A JÖÏ@ áÒ JK ÐA« J úΫ éJK.QªË@ HAj.êÊË@ YKYm
' éË
AÓ ú
¯
é
®K.AË@ HAm'.
B@
HYÒJ«@
l .
'AJ JË@ ù
ÒʪË@
IjJ.Ë@ @
Yë
QªK ,
K.AË@
J
JÊË A
¯C g . új
®Ë@
éJK.QªË@
é ªÊË
é
¯A
B
AK. (úG.PA
ªÓ ,ø
QåÓ , ú
×A
éJK.QªÊË
é
¯A
B
AK. úG.QªË@ ÕËAªË@ ZAm
'
@ ©JÔg. áÓ
é JKYÓ 25 ÉÒ
é
®J
¯X
HA
®J
Ð@Y
jJAK. HAj.êÊË@ YKYm
' ú
¯ úÍð
B@
úΫ ¨C¢JB
@ ÈC
g áÓ HAj.êÊË@ áK. J JÊË éÒ ¢
@
èY« ú
æJ. K , AJË@ @ Yë ú
¯ .
éK.ñª
éË
AÖÏ@ YK QK AÜØ , új
®Ë@
é
¯YK. HYjJÒÊË é JKYÖÏ@ éj.êË YKYm
' A J KA¾ÓAK
. é
K@ AîDË@ A
JÊñK ú
æË@ l
'AJ JË@ Qê ¢ . ÉÒm.Ì'@ áÓ
.
ék.Q
jJÖÏ@
éKñ ªÊË@
A
mÌ'@
áÒ JK ,
é
¯A
B
AK. .
éÒÊ¿ 16 ÉJÊm
' ÈC g áÓ % 90 é¯YK
. ð ,
HAÒÊ¿ 7 ÈYªÓ úΫ øñ
Jm' ú
G
.
AJ»
ÈC g áÓ % 67
,9
.
éJK.QªË@ HAj.êÊË@
áK. ¬CJ kB@ð éK.A Ë@ øYÓ PQ.K ÉÒm.Ì'@ ÉJÊm
'
úΫ AJ
J.Ó @QKQ
®K
IjJ.Ë@
1 Introduction
Dialect identification (DID) is the task of automatically identifying the dialect of a particular segment of speech or text of any size (i.e., word, sentence, or document). This task has attracted increasing attention in recent years. For instance, several evaluation campaigns were dedicated to discriminating between language varieties (Malmasi et al., 2016; Zampieri et al., 2017). This is not surprising considering the importance of automatic DID for several NLP tasks, where prior knowledge about the dialect of an input text can be helpful, such as machine translation (Salloum et al., 2014), sentiment analysis (Al-Twairesh et al., 2016), or author profiling (Sadat et al., 2014).
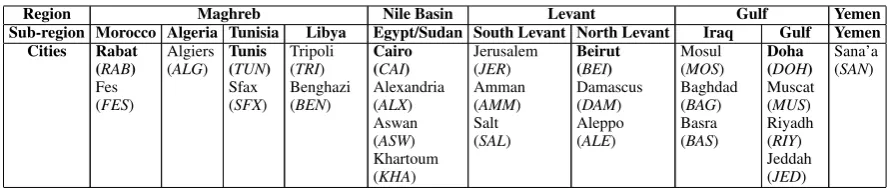
For Arabic DID, previous work typically targeted coarse-grained five dialect classes plus Standard Arabic at most (6-way classification) (Zaidan and Callison-Burch, 2014; Elfardy and Diab, 2013; Dar-wish et al., 2014). In this paper, we tackle a finer-grained dialect classification task, covering 25 cities from across the Arab World (from Rabat to Muscat), in addition to Standard Arabic. Table 1 shows the break up we follow in choosing these cities. The table relates the typical five-way regional break up of Arabic dialects (Habash, 2010) to a more refined ten-way sub-region division, and even further into 25 cities.
Region Maghreb Nile Basin Levant Gulf Yemen Sub-region Morocco Algeria Tunisia Libya Egypt/Sudan South Levant North Levant Iraq Gulf Yemen
Cities Rabat (RAB) Fes (FES)
Algiers (ALG)
Tunis (TUN) Sfax (SFX)
Tripoli (TRI) Benghazi (BEN)
Cairo (CAI) Alexandria (ALX) Aswan (ASW) Khartoum (KHA)
Jerusalem (JER) Amman (AMM) Salt (SAL)
Beirut (BEI) Damascus (DAM) Aleppo (ALE)
Mosul (MOS) Baghdad (BAG) Basra (BAS)
Doha (DOH) Muscat (MUS) Riyadh (RIY) Jeddah (JED)
[image:2.595.75.519.60.155.2]Sana’a (SAN)
Table 1: Different region, sub-region, and city dialects. The bolded cities are our regional representatives.
We build several classification systems and explore a large space of features. Our results show that we can identify the exact city of a speaker at an accuracy of 67.9% for sentences with an average length of 7 words (a 9% relative error reduction over the state-of-the-art technique for Arabic dialect identifica-tion (Zaidan and Callison-Burch, 2014)) and reach more than 90% when we consider 16 words.
We also report the results of training and evaluating our model using datasets obtained from different sources: (i) A large-scale parallel corpus of five regional representative dialects and MSA (CORPUS -6); (ii) A smaller-scale parallel corpus of 25 dialects and MSA (CORPUS-26); and (iii) A corpus of dialectal sentences extracted from Twitter. Furthermore, we report the additional insights we obtain from analyzing the data with respect to similarity and difference across Arabic dialects.
Our research contributions are the following:
• We extend the problem of Arabic DID to predict 25 fine-grained city-level dialects.
• We demonstrate a solution for leveraging relatively rich resources for a small number of city dialects to help with the fine-grained DID task for 25 city dialects.
• We present a detailed analysis of dialect similarity and confusability and add insights on top of the traditional map presented in the literature.
• We show that, on average, it takes 52 words to reach an optimal classification of the dialect and 16 words to reach 90% accuracy.
• We evaluate our system on dialectal sentences extracted from social media.
The remainder of this paper is organized as follows. In section 2, we review the main previous efforts for DID. In Section 3, we present the main challenges in processing Arabic and its dialects. In Section 4, we describe our experimental setup and discuss the datasets, models, features, evaluation metrics used as well as our results. In Section 5, we present a detailed analysis and discussion on dialect confusability, optimal classification and tweet dialect classification. Finally, we conclude and give our future directions in Section 6.
2 Related Work
Working on DID is more challenging than just recognizing a specific language (Etman and Beex, 2015). Since Arabic dialects use the same script and share part of the vocabulary, it is quite arduous to distin-guish between them. Hence, developing an automatic identification system working at different levels of representation and exploring different datasets has attracted increasing attention in recent years. Shoufan and Alameri (2015) and Al-Ayyoub et al. (2017) present a survey on NLP and deep learning methods for processing Arabic dialectal data with an overview on Arabic DID of text and speech.
classifier to label the AOC dataset. Also, El-Haj et al. (2018) used grammatical, stylistic and Subtractive Bivalency Profiling features for dialect identification on the AOC dataset.
Sadat et al. (2014) presented a bi-gram character-level model to identify the dialect of sentences in the social media context among dialects of 18 Arab countries. More recently, discriminating between Arabic Dialects has been the goal of a dedicated shared task (Zampieri et al., 2017; Malmasi et al., 2016), encouraging researchers to submit systems to recognize the dialect of speech transcripts along with acoustic features for dialects of four main regions: Egyptian, Gulf, Levantine and North African, in addition to MSA. The dataset used in these tasks is different from the dataset we use in this work in its genre, size and the dialects covered.
Several systems implementing a range of traditional supervised learning and more advanced deep learning methods were submitted. High-order character n-grams extracted from speech or phonetic tran-scripts and i-vectors (a low-dimensional representation of audio recordings) were shown to be the most successful and efficient features (Butnaru and Ionescu, 2018), while deep learning approaches (Belinkov and Glass, 2016) did not perform well.
Recently, there are more efforts to collect and annotate datasets for dialect identification. Abdul-Mageed et al. (2018) present a large dataset from Twitter domain covering dialects from 29 major Arab cities in 10 Arab countries. Al-Badrashiny and Diab (2016) present a system that detects points of code-switching in sentences between MSA and dialectal Arabic.
Most, if not all of the approaches, proposed in the literature have been exploring DID at the regional or country level. To the best of our knowledge, this is the first fine-grained DID system covering the dialects of 25 cities from several countries, including cities in the same country in the Arab World. Moreover, this is the first study pinpointing Arabic DID, discussing the difference between regional and city-level identification and redrawing the geographical map for Arabic DID. Furthermore, this is the first work leveraging a parallel corpus covering 25 dialects in addition to MSA (Bouamor et al., 2018).
3 Arabic and its Dialects
Dialectal Arabic (DA) refers to the collection of language varieties used by Arabic speakers in their daily interactions. DA lives side by side with Modern Standard Arabic (MSA), the official language in most Arab countries. Although MSA is not acquired natively (through spoken input at home and in the community), it has an extensive presence in various settings: media, education, business, arts and literature, and official and legal written documents. The dialects are not standardized, they are not taught, and they do not have official status. However, they are the primary vehicles of communication (face-to-face and recently, online) and have a significant presence in the arts as well.
Arabic dialects are often classified in terms of geography. Typical regional groupings cluster the dialects into Levantine Arabic (Lebanon, Syria, Jordan, and Palestine), Gulf Arabic (Qatar, Kuwait, Saudi Arabia, United Arab Emirates and Bahrain, with Iraqi and Omani Arabic included sometimes), Egyptian Arabic (which may include Sudan), North African Arabic (vaguely covering Morocco, Algeria, Tunisia, Libya and Mauritania), and Yemeni Arabic (Habash, 2010). However, within each of these regional groups, there is significant variation down to the village, town, and city levels.
Arabic dialects differ from one another and from MSA on all levels of linguistic representation, from phonology and morphology to lexicon and syntax (Watson, 2007).1 The number of lexical differences is significant i.e., Egyptian
é
ð
@
Âw ˇD¯h‘room’ corresponds to MSAé
¯Q
«
γrf¯h, LybianP@X
dArand TunisianIK.
byt(Habash et al., 2012a).2 Morphological differences are also quite common. One example is the future marker particle which appears as +
sa+or–
sawfain MSA, +h
Ha+orhP
raHin Levantinedialects and
AK.
bAšin Tunisian. This together with the variation in the templatic morphology make theforms of some verbs rather different: e.g.,’I will write’is
I
.
J»
A
sa Âaktubuin MSA,I
.
J»Ag
HaÂaktub1
Comparative studies of several Arabic dialects suggest that the syntactic differences between the dialects are minor (Ben-mamoun, 2012).
2
Arabic transliteration is presented in the Habash-Soudi-Buckwalter scheme (Habash et al., 2007): (in alphabetical order)
in Palestinian,
I
.
Jºë
haktibin Egyptian andI
.
Jº K
AK.
bAš niktibin Tunisian.An example of phonological differences is in the pronunciation of dialectal words whose MSA cognate has the letter Qaf (
q). It is often observed that in Tunisian Arabic, this consonant appears as /q/ (similar to MSA), while in Egyptian and Levantine Arabic it is /P/ (glottal stop) and in Gulf Arabic it is /G/ (Haeri, 1991; Habash, 2010).It should be also noted that while MSA has an established standard orthography, the dialects do not. Often people write words reflecting the phonology or the history (etymology) of these words. DA is sometimes written in Roman script (Bies et al., 2014). In the context of NLP, a set of conventional orthography guidelines (CODA) has been proposed, but only for specific dialects (Habash et al., 2018).
Despite these differences, distinguishing between dialects is a very challenging task because: (i) di-alects use the same writing script (not in a conventionalized way) and share part of the vocabulary; and (ii) Arabic speakers usually resort to repeated code-switching between their dialect and MSA (Abu-Melhim, 1991; Bassiouney, 2009), creating sentences with different levels/percentages of dialectness. More discussion on the similarity between dialects of 25 cities in the Arab World and MSA is given in Section 4.1.
4 Experimental Setup
4.1 Data
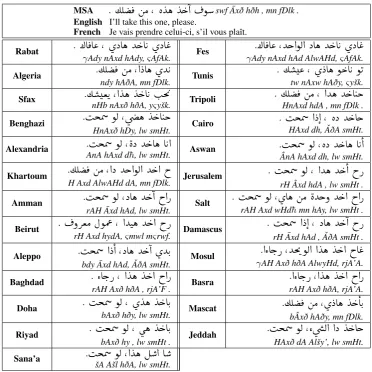
In this work, we use a large-scale collection of parallel sentences built to cover the dialects of 25 cities from the Arab World (illustrated in Table 1), in addition to English, French and MSA (Bouamor et al., 2018). This resource was created as a commissioned translation of the Basic Traveling Expression Corpus (BTEC) (Takezawa et al., 2007) sentences from English and French to the different dialects. It contains two corpora. The first consists of 2,000 sentences translated into dialects of 25 cities. Each of these sentences has a corresponding 25 parallel translations. We refer to it as CORPUS-26 (25 cities plus MSA). The second corpus has 10,000 additional sentences (non-overlapping with the 2,000 sentences) from the BTEC corpus translated to the dialects of only five selected cities: Beirut, Cairo, Doha, Tunis and Rabat. We refer to it as CORPUS-6 (5 cities plus MSA). Effectively, the five selected cities will each have 12,000 sentences that are five-way parallel translations. An example of a 28-way parallel sentence (25 cities plus MSA, English and French) extracted from CORPUS-26 is given in Figure 1.
Data pre-processing and splitting In our experiments, we only tokenize the sentences in both CORPUS-6 and CORPUS-26 using punctuation marks. Morphological analysis has been shown to im-prove the performance of DID systems for a small number of dialects (Darwish et al., 2014). However, the number and sophistication of morphological analysis and segmentation tools for DA are very limited (Pasha et al., 2014), cover only a small number of dialects (Habash and Rambow, 2006; Habash et al., 2012b; Khalifa et al., 2017) and unavailable for most of the others. We split each corpus into Train, Development (Dev) and Test sets. The splits are balanced for each dialect and the distribution of each split is given in Table 2. We use TRAIN, DEVELOPMENT and TEST terms with CORPUS-6 and CORPUS-26 to refer to the training, development and test sets of the specified corpus. We use the term
MODEL to refer to the trained system.
Train Dev Test Classes CORPUS-6 9000 1000 2000 6 CORPUS-26 1600 200 200 26
Table 2: Distribution of the Train, Dev and Test sets used in our experiments. Pairwise similarity between dialects In order to get a
sense of the complexity of our task, we explore the de-grees of similarity and variation between the dialects in CORPUS-26. We accomplish this by building a similar-ity matrix representing the lexical similarsimilar-ity between the dialects of every two citiesD1 andD2 (i.e., BEI and CAI, TUN and MUS, etc.). We measure the similarity by com-puting the percentage of common tokens between the
cor-pus ofD1and the corpus ofD2. This is solely a bag of word comparison.
MSA
. ½Ê
¯ áÓ , è
Yë
Y g
@
–
swf ¯Axð hðh , mn fDlk . English I’ll take this one, please.French Je vais prendre celui-ci, s’il vous plaît.
Rabat
. ¼A
¯A« , øXAë Y
gA K ø
XA
«
γAdy nAxd hAdy,ςAfAk. Fes
. ¼A
¯A« , Yg@ñË@ XAë Y gA K øXA
«
γAdy nAxd hAd AlwAHd,ςAfAk.
Algeria
. ½Ê
¯ áÓ , @
XAë øY
K
ndy hAðA, mn fDlk. Tunis
. ½
« , ø
XAë ñ kA K ñK
tw nAxw hAðy,ςyšk.Sfax
. ½
ªK , @
Yë
Y gA K I
. m
'
nHb nAxð hðA, yςyšk. Tripoli
. ½Ê
¯ áÓ , @Yë Y gA Jk
HnAxd hdA , mn fDlk .Benghazi
.
IjÖÞ ñË , ú
æ ë
Y gA Jk
HnAxð hDy, lw smHt. Cairo
.
IjÖÞ @
X@ , èX Y
gAg
HAxd dh, ˇAðA smHt.Alexandria
.
IjÖÞ ñË ,
èX Y gAë A K@
AnA hAxd d¯h, lw smHt. Aswan
.
IjÖÞ ñË , èX Y gAë A K
@
ÂnA hAxd dh, lw smHt.Khartoum
. ½Ê
¯ áÓ , @X Yg@ñË@ Y g@ h
H Axd AlwAHd dA, mn fDlk. Jerusalem
.
IjÖÞ ñË , @Yë Y g
@ hP
rH Âxd hdA , lw smHt .Amman
.
IjÖÞ ñË , XAë Y g
@ h@P
rAH ¯Axd hAd, lw smHt. Salt
.
IjÖÞ ñË , øAë áÓ
èYgð Y g@ h@P
rAH Axd wHd¯hmn hAy, lw smHt .Beirut
.
¬ðQªÓ ÈñÔ« , @YJë Y
g@ hP
rH Axd hydA,ςmwl mςrwf. Damascus
.
IjÖÞ @
X@ , XAë Y
g
@ hP
rH ¯Axd hAd , ˇAðA smHt .Aleppo
.
IjÖÞ @
X
@ , XAë Y g
@ øYK.
bdy ¯Axd hAd, ˇAðA smHt.Mosul
. @ZAg.P , Ym'ñË@ @
Yë
Y g@ hA
«
γAH Axð hðA AlwyHd, rjA’A.
Baghdad
. ZAg.P , @
Yë
Y g@ h@P
rAH Axð hðA , rjA’F . Basra
. @ZAg.P , @
Yë
Y g@ h@P
rAH Axð hðA, rjA’A.Doha
.
IjÖÞ ñË , ø
Yë
Y gAK.
bAxð hðy, lw smHt. Mascat
. ½Ê
¯ áÓ , ø
XAë
Y g
AK.
bÂxð hAðy, mn fDlk.Riyad
.
IjÖÞ ñË , ù
ë
Y gAK.
bAxð hy , lw smHt . Jeddah
.
IjÖÞ ñË , Zú
æË@ @X
Y gAg
HAxð dA Alšy’, lw smHt. [image:5.595.112.485.59.431.2]Sana’a
.
IjÖÞ ñË , @
Yë É
@ A
šA Ašl hðA, lw smHt.Figure 1: Sample of a 28-way parallel sentence extracted from CORPUS-26. The MSA and dialectal sentences are given along with their transliteration in the Habash-Soudi-Buckwalter scheme (Habash et al., 2007).
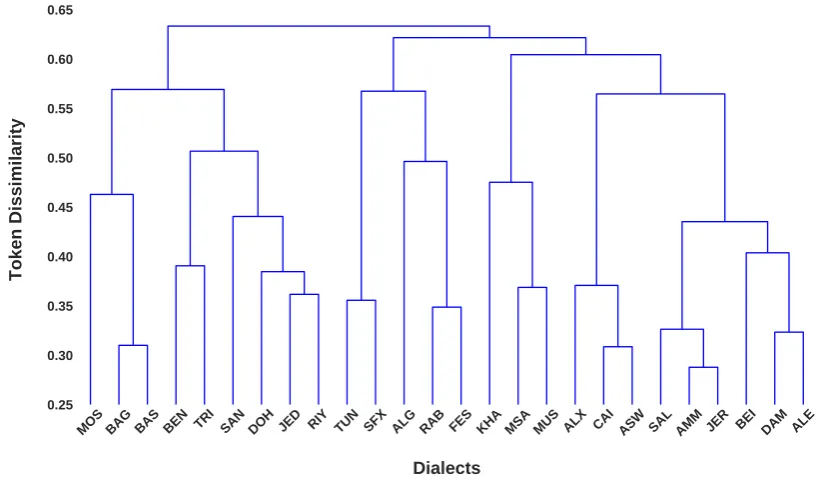
dialects (have the largest number of common tokens). The dendrogram in Figure 2 illustrates the result of this clustering algorithm, with the y-axis showing the token dissimilarity ratio between the clusters.
The dendrogram shows the not surprising closeness of dialects of cities within the same countries, and in the same geographic region. For example, Damascus and Aleppo dialects are different from each other only by 32% and from Beirut dialect by 38%. While the dissimilarity between the cluster enclosing Tunis and Sfax and the cluster containing the rest of the dialects is more than 50%. Thus, the high degree of similarity among some dialects shows that discriminating between dialects on the word-level is rather challenging. This can affect the accuracy of our models due to the increase of confusability among similar dialects.
4.2 Multi-level Dialect Identification Models
We formulate our DID problem as a multi-class classification task. We consider a Multinomial Naive Bayes (MNB) classifier for the learning task.3 MNB is a variation of Naive Bayes that estimates the conditional probability of a token given its class as the relative frequency of the tokentin all documents belonging to classc. MNB has proven to be suitable for classification tasks with discrete features (e.g.,
MOS BAG BAS BEN TRI SAN DOH JED RIY TUN SFX ALG RAB FES KHA MSA MUS ALX CAI ASW SAL AMM JER BEI DAM ALE
Dialects
0.250.30 0.35 0.40 0.45 0.50 0.55 0.60 0.65
[image:6.595.92.503.67.307.2]Token Dissimilarity
Figure 2: Pairwise similarity between dialects in Corpus-26
word or character counts or representation for text classification) (Manning et al., 2008).
Baseline We follow the approach described in Zaidan and Callison-Burch (2014) for dialect identifica-tion and adapt it to build our baseline model. For each dialect, we train a 5-gram character level language model (LM) using KenLM (Heafield, 2011) with default parameters and Kneser–Ney smoothing. Then, we use the LM to assign to each sentenceS, the dialectDi that maximizes its conditional probability scoreargmaxiP(Di|S). Character-based LMs leverage subword information and are generally good
for capturing particular peculiarities that are specific to certain dialects such as the use of certain cli-tics, affixes or internal base word structure. For example, the word prefixes
KX
@
Âdy,JK.
bt andËAë
hAldepicted by the character n-gram LM in
? @ Q
®ËAë ÐY
jJK.
X
@
Âdyš btxdm hAlfyzA ? ‘How long is this visa good for?’ are good indicators that the dialect of the sentence might be from the Levantine re-gion. Furthermore, character-level models mitigate the ineffectiveness of word-based LMs caused by the presence of out-of-vocabulary words (OOVs) that are prominent in dialects, due to the lack of standard orthography (Habash et al., 2012a).4.3 Learning Features
We use a suite of features that have been used in works related to DID and text classification. These features are extracted from CORPUS-6 and CORPUS-26 without any preprocessing beyond punctuation tokenization.
Word n-grams Word unigrams are extensively used in text classification tasks. For our task, we extract surface word n-grams ranging from unigrams to 5-grams and use them as features. Word unigrams are useful for our DID task as they depict words unique to some dialects. As shown in Figure 2, lexical variations are prominent and could be predictive for certain regions, countries, and cities.
N-gram Features Other Features Corpus-6 Corpus-26
Word Character Dev Test Dev Test
a. Baseline – – Char 5-gram LM 92.2 92.7 66.2 64.7
b. MNB – 1 45.9 44.6 18.0 17.1
c. MNB – 1+2 70.9 70.4 40.6 37.4
d. MNB – 1+2+3 83.8 84.4 55.1 53.5
e. MNB – 1+2+3+4 87.3 88.2 60.0 58.2
f. MNB – 1+2+3+4+5 88.5 89.3 61.3 59.7
g. MNB 1 – 90.8 91.1 63.9 63.0
h. MNB 1+2 – 90.5 91.2 62.5 62.0
i. MNB 1+2+3 – 90.1 90.9 62.2 61.2
j. MNB 1+2+3+4 – 90.0 90.8 62.0 61.1
k. MNB 1+2+3+4+5 – 89.8 90.7 62.0 60.9
l. MNB 1 1+2+3 90.7 91.1 65.3 63.6
m. MNB 1 1+2+3 Word 5-gram LM 91.5 91.9 62.6 62.8 n. MNB 1 1+2+3 Char 5-gram LM 92.7 93.2 67.6 66.4
o. MNB 1 1+2+3 Char/Word 5-gram LM 93.1 93.6 68.5 67.5
p. MNB 1 1+2+3 Char/Word 5-gram LM
[image:7.595.120.480.60.276.2]+ Corpus 6 Classifier Prob. – – 68.9 67.9
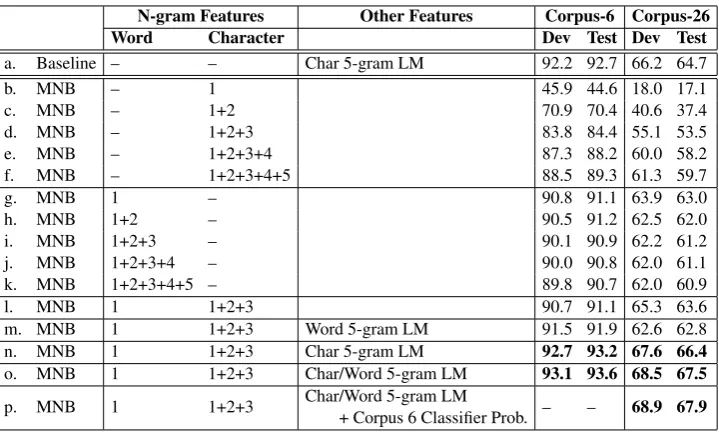
Table 3: Accuracy on the dev and test sets for both CORPUS-6 and CORPUS-26. The n-grams features show the n-gram orders for word and characters in the MNB models.
Language model probability scores We trainnLMs each pertaining to thendialects, on CORPUS -6 and CORPUS-26. We score the sentences in the TRAIN,DEVELOPMENT andTESTsets, using these LMs. Then, we use the probability scores of the sentence as features. Thus, each sentence will haven
probability scores, one for each dialect. The probability scores measure how close each sentence is to the dialect. We experiment using probability scores from word 5-grams LM, character 5-gram LM, and adding both as features.
4.4 Evaluation Metrics
We report the results on CORPUS-6 and CORPUS-26 using theaccuracymetric, which calculates the percentage of the sentences whose dialect is correctly predicted. We also report the precision, recall and F1 scores metrics for our best systems on both corpora. The scores are calculated per class for our best system, which can provide a better understanding on the confusability of the classes and sensitivity of our model.
4.5 Results
In this section, we present the results of the different MNB models and compare them to the baseline. In Table 3, we report the results on the DEVELOPMENTand TESTsets for both CORPUS-6 and CORPUS -26 using the accuracy metric. First, we analyze the use of n-grams as features for our MNB model and the effect of increasing the n-gram order on the accuracy of the model. Training the MNB classifier on character n-grams (rows b. to f.) shows an increase in the accuracy on the DEVELOPMENTand TEST
set of both corpora, when increasing the n-gram order. A steep increase is observed from unigrams to trigrams, while it diminishes from 4-grams to 5-grams. We hypothesize that the morphological features in the words’ structure are well captured within character LMs.
However, increasing the word n-gram order has a negative effect on the system’s accuracy (rows g. to k.). It results in a decrease of one and two accuracy points on CORPUS-6 and CORPUS-26 respectively, as we add higher order n-gram features on the top of unigrams. Still, the of use word unigrams features alone (row g.) is able to beat 1-to-5-grams character features (row f.)
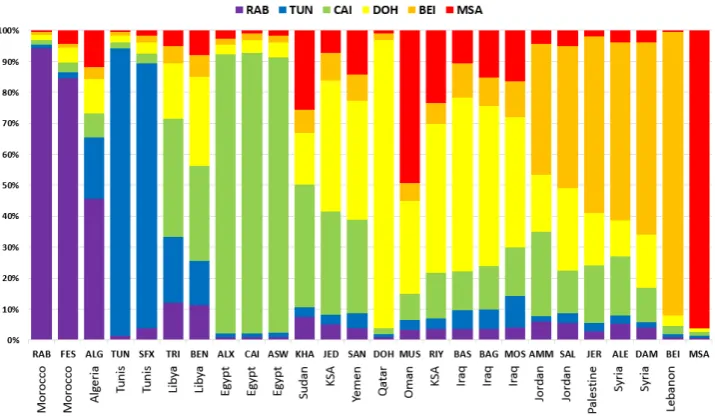
Figure 3: Confusability patterns of our 26 dialects in terms of the best MODEL-6 system.
LM scores (row m.) improves the accuracy on CORPUS-6 while it hurts the system on CORPUS-26. This can be attributed to the small size of CORPUS-26 TRAINdata used to train the 5-gram LM and the large number of classes. However, adding 5-gram character LM scores as features (row n.) beats the baseline scores (row a.). The accuracy is further improved when we include 5-gram word LM scores.
CORPUS-26 TRAINis considered small with a large number of labels. We can make use of CORPUS-6
MODELfor providing evidence about the region that sentences of CORPUS-26 belong to. Our intuition is that sentences from CORPUS-26 can be weighed by how close to the five main cities and MSA in CORPUS-6. Thus, we train a model on CORPUS-6 TRAINand run it on CORPUS-26TRAIN,DEVELOP -MENT, and TEST. We use the six probability scores generated by CORPUS-6 MODEL, each correspond-ing to a probability of the dialect given a sentence from CORPUS-6, as extra features to train CORPUS-26 model. The combination of these features with features from row (o.) resulted in the best performance of our model among all the experiments. Overall, our best CORPUS-6 and CORPUS-26 models achieve a 12% and 9% relative error reduction rate over the character Language Model baseline respectively.
5 Analysis and Discussion
5.1 Dialect Confusability and Identifiability
In this section, we present an analysis of the MODEL-6Classifier Probabilityfeatures that gave us our best MODEL-26 system results. In Figure 3, we show the average probability distribution of MODEL-6 for the sentences in CORPUS-26 TRAIN. The colors in the columns refer to the probability of assigning a specific MODEL-6 label from the six dialects we consider asanchors. The 25 cities are organized
5.2 Region Level Identification
Dialect Precision Recall F1
Corpus-26
MOS 88 83 86
ALG 79 82 81
TRI 83 79 81
ALX 78 77 77
MSA 72 78 75
RAB 76 74 75
SAN 80 71 75
KHA 71 74 73
SFX 72 73 73
FES 74 70 72
TUN 75 69 72
BEI 76 62 69
BEN 73 65 69
DOH 64 76 69
ALE 73 64 68
BAS 69 66 67
BAG 66 65 65
ASW 61 66 63
JED 57 66 61
JER 61 60 61
RIY 56 61 59
AMM 61 56 58
CAI 64 52 57
DAM 47 66 55
SAL 52 59 55
MUS 55 51 53
Average 69% 68% 69%
Corpus-6
MSA 97 97 97
RAB 96 95 95
TUN 95 94 95
BEI 94 93 94
DOH 91 94 93
CAI 92 92 92
[image:9.595.82.243.97.555.2]Average 94% 94% 94%
Table 4: Results in terms of Precision, Recall and F1 of our best model on the CORPUS-26 and CORPUS-6 test sets.
The upper part of Table 4 presents the precision, recall and F1 score for the 25 dialects, in addition to MSA from the best MODEL-26 system, ordered by F1 score. It is in-teresting to note that the top four cities classified with F1 scores ranging between 77% and 86% (MOS, ALG, TRI, ALX) are not members of CORPUS-6. Also, the dialects of CORPUS-6 keep the same relative order when classified
using MODEL-26, that they have in MODEL-6 (See the bottom part of Table 4), but with Cairo lagging behind.
Upon examining the full confusion matrix (which we do not show in this paper), we observed two phenomena: (i) most confusion patterns tend to be bigger within limited geographical regions, e.g., Baghdad is more confused with other Iraqi cities, than with Maghreb (i.e., RAB, FES, etc.) or Egyptian cities (ALX, ASW, CAI); (ii) some cities are predicted a lot more than others, with Damascus being the most predicted (281 times) compared to Cairo (162 times). The most predicted cities tended to come from bigger re-gions (Levant and Gulf) which are more represented in our data.
In Table 5, we present a reduced confusion matrix in which we collapse our 25 dialects into eightregions. The regions are geographically organized and ordered followed by MSA. Naturally, the eight-region scores are higher than the 25-dialect and MSA scores (more coarse, less labels). However, interestingly, the scores are generally higher for smaller regions compared to larger regions. In the future, we will consider different methods for training varying re-gional granularities.
5.3 Sample Size and Optimal Classification
With moretest inputexamples from the same source and the same dialect, the dialect could be determined with higher accuracy. This allows any system to get more ev-idence that could support the selection of one dialect over others. In this section, we present two experiments to mea-sure the effect of increasing the length of the inputs of our test set by: (i) adding additional sentences, and (ii) adding additional words.
The main goal of these experiments is to answer the fol-lowing question: how many sentences or words are needed on average to guarantee an optimal classification into a certain dialect? To answer this, we run CORPUS -26 MODELon CORPUS-26 TEST.
For each sentence having an incorrectly predicted dialect label, we sample a sentence from the subset of sentences belonging to its correct dialect class and append it to it. We keep randomly sampling sentences until the system correctly predicts the right label. Interestingly, on average, it takes 1.52 sentences to predict the right class of a given sentence. With more examples of text by a writer, our system can confidently determine the correct dialect of the writer with a high accuracy reaching 100%.
morn-MAG TUN LIB EGY GLF IRQ LEV MSA Match Predict Gold Prec Rec F1 MAG3 (RAB, FES, ALG) 539 7 8 10 19 3 10 4 539 591 600 91 90 91
TUN 2 (TUN, SFX) 15 356 4 0 10 6 9 0 356 386 400 92 89 91
LIB 2 (TRI, BEN) 8 8 30820 34 2 20 0 308 370 400 83 77 80
EGY 4 (CAI, ALX, ASW, KHA) 8 4 8 677 45 8 41 9 677 784 800 86 85 85
GLF 5 (DOH, JED, RIY, SAN, MUS) 10 3 22 37 798 33 59 38 798 1046 1000 76 80 78
IRQ 3 (BAG, BAS, MOS) 1 5 3 6 49 504 26 6 504 578 600 87 84 86
LEV 6 (BEI, DAM, ALE, JER, AMM, SAL) 7 3 14 29 63 19 10623 1062 1230 1200 86 89 87
[image:10.595.71.524.65.164.2]MSA1 (MSA) 3 0 3 5 28 3 3 155 155 215 200 72 78 75
Table 5: Confusion matrix of MODEL-26 over eight geographical regions. Column 1 indicates the label of the region, the number of cities and the labels of the cities. The regions are (in order): Maghreb, Tunisia, Libya, Egypt and Sudan, Gulf, Iraq, Levant, and MSA.
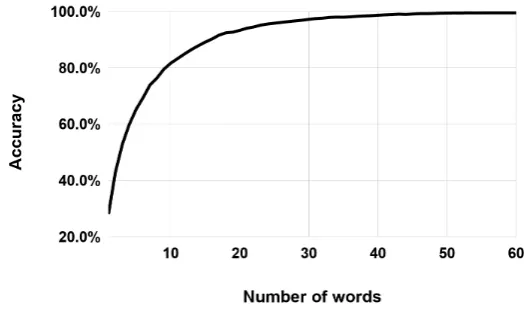
ing’. We want to answer the question of how many words per sentence do we need in order to have an optimal classification. Given that short sentences and common phrases among dialects are less indicative of the dialect, we append the sentences in CORPUS-26 TESTwith sentences randomly selected from the set with similar dialect. We continuously append each sentence until the total number of words reaches at least 65 words. We run CORPUS-26 MODELon the modified test set over several iterations, by
con-sidering a fixed number of words at each iteration, starting from a sentence length of1until60. Figure 4 illustrates the accuracy of CORPUS-26 MODELwith respect to the number of words in the sentences. It is important to note that the accuracy increases proportionally to the number of words considered in a sentences. Our system reaches an accuracy of 69.4% (compared to an accuracy of %67.9 on the original test set) using examples with fixed length of six words. We reach a score above 90% when we consider 16 words, while the optimal classification is reached using 51 words. This could be explained by the importance of longer context and its impact on improving the accuracy of the classifier.
Figure 4: Accuracy on Corpus-26 with respect to the number of words in the input.
5.4 Initial Results on Classifying Tweets
The datasets we use in our experiments (CORPUS-6 and CORPUS-26) are built using a controlled ap-proach, as dialectal translations of English and French sentences in the travel domain (Bouamor et al., 2018). We would like to evaluate the performance of our best CORPUS-6 MODELon naturally occurring
[image:10.595.168.432.415.572.2]city. The high accuracy on Cairo and Doha dialects could be explained by the large number of users who are actively using Twitter in this Arab cities.
As we noticed that the accuracy for Tunis dialect is lower than the other cities, we asked a native speaker to inspect a set of 100 tweets labeled by our system as ’Tunis’. The result obtained showed that 70% of the tweets happen to be tweets from Libya, which is the closest country to Tunisia geographically. Also, this could be explained by the fact that some of the words we consider in the "Tunis" seed list could also be used in Libya, especially that some of the Southern Tunisian dialects are structurally similar to those in close cities in the borders between Tunisia and Libya ( ˇCéplö et al., 2016).
Overall, these initial results are encouraging and suggest a further exploration of Twitter, as it could be mined to extend CORPUS-26 in terms of size, dialects and text genres.
6 Conclusion and Future Work
In this paper, we explored the problem of Arabic DID from the typically studied variety of coarse-grained classification into a finer-grained classification problem covering 25 specific cities from the Arab World, in addition to Modern Standard Arabic (MSA). We presented a detailed analysis of dialect similarity and confusability and added interesting insights on top of the traditional map presented in the literature. We showed that using our best model, we can identify the exact city of a speaker at an accuracy of 67.9% for sentences with an average length of 7 words (a 9% relative error reduction over the state-of-the-art technique for Arabic dialect identification) and reach more than 90% when we consider 16 words. We also showed that a model trained on a commissioned dataset can be used to classify sentences in a corpus of naturally occurring dialectal sentences appearing in social media platforms such as Twitter.
In the future, we plan to explore DID for social media text and improve our model to deal with its complexities. We also plan to experiment on multi-level hierarchical classification, by classifying into regional, subregional and then city level.
Acknowledgements
This publication was made possible by grant NPRP 7-290-1-047 from the Qatar National Research Fund (a member of the Qatar Foundation). The statements made herein are solely the responsibility of the authors.
References
Muhammad Abdul-Mageed, Hassan Alhuzali, and Mohamed Elaraby. 2018. You Tweet What You Speak: A City-Level Dataset of Arabic Dialects. InProceedings of the Eleventh International Conference on Language Resources and Evaluation, LREC 2018, Miyazaki, Japan.
Abdel-Rahman Abu-Melhim. 1991. Code-switching and Linguistic Accommodation in Arabic. InPerspectives on Arabic Linguistics III: Papers from the Third Annual Symposium on Arabic Linguistics, volume 80, pages 231–250. John Benjamins Publishing.
Mahmoud Al-Ayyoub, Aya Nuseir, Kholoud Alsmearat, Yaser Jararweh, and Brij Gupta. 2017. Deep Learning for Arabic NLP: A Survey.Journal of Computational Science.
Mohamed Al-Badrashiny and Mona Diab. 2016. LILI: A Simple Language Independent Approach for Language Identification. InProceedings of COLING 2016, the 26th International Conference on Computational Linguis-tics: Technical Papers.
Nora Al-Twairesh, Hend Al-Khalifa, and Abdulmalik AlSalman. 2016. AraSenTi: Large-Scale Twitter-Specific Arabic Sentiment Lexicons. InProceedings of the 54th Annual Meeting of the Association for Computational Linguistics, Berlin, Germany.
Reem Bassiouney. 2009.Arabic Sociolinguistics. Edinburgh University Press.
Yonatan Belinkov and James Glass. 2016. A Character-level Convolutional Neural Network for Distinguishing Similar Languages and Dialects. InProceedings of the Third Workshop on NLP for Similar Languages, Varieties and Dialects (VarDial3), Osaka, Japan.
Fadi Biadsy and Julia Hirschberg. 2009. Using Prosody and Phonotactics in Arabic Dialect Identification. In
Proceedings of Interspeech, Brighton, UK.
Ann Bies, Zhiyi Song, Mohamed Maamouri, Stephen Grimes, Haejoong Lee, Jonathan Wright, Stephanie Strassel, Nizar Habash, Ramy Eskander, and Owen Rambow. 2014. Transliteration of Arabizi into Arabic Orthography: Developing a Parallel Annotated Arabizi-Arabic Script SMS/Chat Corpus. InProceedings of the EMNLP 2014 Workshop on Arabic Natural Language Processing (ANLP), Doha, Qatar.
Houda Bouamor, Nizar Habash, Mohammad Salameh, Wajdi Zaghouani, Owen Rambow, Dana Abdulrahim, Os-sama Obeid, Salam Khalifa, Fadhl Eryani, Alexander Erdmann, and Kemal Oflazer. 2018. The MADAR Arabic Dialect Corpus and Lexicon. InProceedings of the Eleventh International Conference on Language Resources and Evaluation (LREC 2018), Miyazaki, Japan.
Soumia Bougrine, Hadda Cherroun, and Djelloul Ziadi. 2017. Hierarchical Classification for Spoken Arabic Dialect Identification using Prosody: Case of Algerian Dialects. CoRR, abs/1703.10065.
Andrei Butnaru and Radu Tudor Ionescu. 2018. UnibucKernel: A Kernel-based Learning Method for Com-plex Word Identification. In Proceedings of the Thirteenth Workshop on Innovative Use of NLP for Building Educational Applications, New Orleans, Louisiana.
Slavomír ˇCéplö, Ján Bátora, Adam Benkato, Jiˇrí Miliˇcka, Christophe Pereira, and Petr Zemánek. 2016. Mutual Intelligibility of Spoken Maltese, Libyan Arabic, and Tunisian Arabic Functionally Tested: A Pilot Study. Folia Linguistica, 50(2):583–628.
Kareem Darwish, Hassan Sajjad, and Hamdy Mubarak. 2014. Verifiably Effective Arabic Dialect Identification. InProceedings of the 2014 Conference on Empirical Methods in Natural Language Processing (EMNLP), Doha, Qatar.
Mona Diab and Heba Elfardy. 2012. Simplified Guidelines for the Creation of Large Scale Dialectal Arabic Annotations. In Proceedings of The eighth international conference on Language Resources and Evaluation (LREC 2012), Istanbul, Turkey.
Mahmoud El-Haj, Paul Rayson, and Mariam Aboelezz. 2018. Arabic Dialect Identification in the Context of Bi-valency and Code-Switching. InProceedings of the Eleventh International Conference on Language Resources and Evaluation (LREC 2018), Miyazaki, Japan.
Heba Elfardy and Mona Diab. 2012. Token Level Identification of Linguistic Code Switching. InProceedings of the 24th International Conference on Computational Linguistics (COLING), IIT Mumbai, India.
Heba Elfardy and Mona Diab. 2013. Sentence Level Dialect Identification in Arabic. InProceedings of the Association for Computational Linguistics, Sofia, Bulgaria.
Asma Etman and Louis Beex. 2015. Language and Dialect Identification: A Survey. InProceedings of The 2015 SAI Intelligent Systems Conference (IntelliSys), London, UK.
Nizar Habash and Owen Rambow. 2006. MAGEAD: A Morphological Analyzer and Generator for the Arabic Dialects. InProceedings of COLING/ACL, Sydney, Australia.
Nizar Habash, Abdelhadi Soudi, and Timothy Buckwalter. 2007. On Arabic Transliteration. InArabic Computa-tional Morphology, volume 38 ofText, Speech and Language Technology, chapter 2, pages 15–22. Springer.
Nizar Habash, Mona Diab, and Owen Rambow. 2012a. Conventional Orthography for Dialectal Arabic. In
Proceedings of the Eighth International Conference on Language Resources and Evaluation (LREC-2012), pages 711–718, Istanbul, Turkey.
Nizar Habash, Ramy Eskander, and Abdelati Hawwari. 2012b. A Morphological Analyzer for Egyptian Arabic. In
NAACL-HLT 2012 Workshop on Computational Morphology and Phonology (SIGMORPHON2012), Montréal, Canada.
Nizar Habash, Fadhl Eryani, Salam Khalifa, Owen Rambow, Dana Abdulrahim, Alexander Erdmann, Reem Faraj, Wajdi Zaghouani, Houda Bouamor, Nasser Zalmout, Sara Hassan, Faisal Al shargi, Sakhar Alkhereyf, Basma Abdulkareem, Ramy Eskander, Mohammad Salameh, and Hind Saddiki. 2018. Unified guidelines and re-sources for arabic dialect orthography. InProceedings of the Eleventh International Conference on Language Resources and Evaluation (LREC 2018), Miyazaki, Japan.
Nizar Y Habash. 2010.Introduction to Arabic natural language processing. Morgan & Claypool Publishers.
Niloofar Haeri. 1991. Sociolinguistic Variation in Cairene Arabic: Palatalization and the qaf in the Speech of Men and Women.
Kenneth Heafield. 2011. KenLM: Faster and Smaller Language Model Queries. InProceedings of the Sixth Workshop on Statistical Machine Translation.
Shervin Malmasi, Marcos Zampieri, Nikola Ljubeši´c, Preslav Nakov, Ahmed Ali, and Jörg Tiedemann. 2016. Discriminating between Similar Languages and Arabic Dialect Identification: A Report on the Third DSL Shared Task. In Proceedings of the Third Workshop on NLP for Similar Languages, Varieties and Dialects (VarDial3), Osaka, Japan.
Christopher D. Manning, Prabhakar Raghavan, and Hinrich Schütze. 2008.Introduction to Information Retrieval. Cambridge University Press, New York, NY, USA.
Arfath Pasha, Mohamed Al-Badrashiny, Mona Diab, Ahmed El Kholy, Ramy Eskander, Nizar Habash, Manoj Pooleery, Owen Rambow, and Ryan M Roth. 2014. MADAMIRA: A Fast, Comprehensive Tool for Morpho-logical Analysis and Disambiguation of Arabic. In Proceedings of the Language Resources and Evaluation Conference (LREC), Reykjavik, Iceland.
Fatiha Sadat, Farzindar Kazemi, and Atefeh Farzindar. 2014. Automatic Identification of Arabic Language Vari-eties and Dialects in Social Media. InProceedings of the Second Workshop on Natural Language Processing for Social Media (SocialNLP), Dublin, Ireland.
Wael Salloum, Heba Elfardy, Linda Alamir-Salloum, Nizar Habash, and Mona Diab. 2014. Sentence Level Dialect Identification for Machine Translation System Selection. InProceedings of the 52nd Annual Meeting of the Association for Computational Linguistics, Baltimore, Maryland, USA.
Abdulhadi Shoufan and Sumaya Alameri. 2015. Natural Language Processing for Dialectical Arabic: A Survey. InProceedings of the Second Workshop on Arabic Natural Language Processing, Beijing, China.
Toshiyuki Takezawa, Genichiro Kikui, Masahide Mizushima, and Eiichiro Sumita. 2007. Multilingual Spoken Language Corpus Development for Communication Research. Computational Linguistics and Chinese Lan-guage Processing, 12(3):303–324.
Christoph Tillmann, Saab Mansour, and Yaser Al-Onaizan. 2014. Improved Sentence-Level Arabic Dialect Clas-sification. InProceedings of the First Workshop on Applying NLP Tools to Similar Languages, Varieties and Dialects, Dublin, Ireland.
Janet Watson. 2007.The Phonology and Morphology of Arabic. Oxford University Press.
Omar F. Zaidan and Chris Callison-Burch. 2011. Crowdsourcing Translation: Professional Quality from Non-Professionals. InProceedings of ACL, Portland, Oregon, USA.
Omar F. Zaidan and Chris Callison-Burch. 2014. Arabic Dialect Identification. Computational Linguistics, 40(1):171–202.