Ročník LIV 15 Číslo 2, 2006
131
ANALySIS OF EWE’S MILK By FT NEAR INFRARED
SPECTROSCOPy: MEASUREMENT OF SAMPLES ON
PETRI DISHES IN REFLECTANCE MODE
K. Šustová, j. Kuchtík, S. Kráčmar
Received: October 18, 2005
Abstract
ŠUSTOVá, K., KUCHTíK, j., KRáČMAR, S.: Analysis of ewe’s milk by FT Near Infrared
spectros-copy: measurement of samples on Petri dishes in reflectance mode. Acta univ. agric. et silvic. Mendel.
Brun., 2006, LIV, No. 2, pp. 131–138
Our work deals with a possibility of determination of basic composition (dry matter, fat, protein, case-in, lactose and urea nitrogen) of ewe’s milk and colostrum by FT NIR spectroscopy. Samples of milk were warmed to 40 °C, agitated, cooled to 20 °C, transferred into Petri dishes and analysed by reference methods and by FT NIR in reflectance mode. The measured area was spaced by a metallic mirror. Sta-tistically significant differences between the reference values and the calculated values of NIR were not found (p=0.05). Results of calibration for ewe’s milk determined the highest correlation coefficients: dry matter 0.983, fat 0.989, true protein 0.997, casein 0.977, lactose 0.980 and urea nitrogen 0.973. The study showed that NIRS method, when samples of milk are measured on Petri dishes, is a useful tech-nique for the prediction of dry matter, fat, protein and casein in ewe’s milk.
near-infrared spectroscopy, ewe’s milk, dry matter, fat, protein, lactose, chemical composition
There are many factors which shape a quality of ewe’s milk. In general, the composition of milk chan-ges significantly due to the action of many factors in the course of whole lactation, (jELíNEK et al., 1991; ŽIŽLAVSKý et al., 1989; KRáČMAR et al., 1998; ANTUNOVIČ et al., 2001; gAjDůŠEK et al., 2003). Traditional methods of the estimation of quality of milk and its major components (Kjeldahl method, ger-ber method) are relatively slow and rather expensive. The Milko-Scan is used as an instrumental method for cow´s milk analysis (O’SULLIVAN et al., 1999). NIR spectroscopy of foodstuffs is one of the new analyti-cal methods. It has numerous advantages, e.g. rapidi-ty, non-destructive sample analysis and, especially, a great potential for on-line analysis (RU & gLATZ, 2000; ALBANELL et al., 2003). FT NIR method has been used to measure the content of various consti-tuents in homogenised cow milk (SATO et al., 1987; RODRIgUEZ-OTERO, HERMIDA & CENTENO,
The objective of our experiments was to determine contents of basic components of ewe’s milk using the FT NIR method, when samples of milk are measu-red on Petri dishes. Our attention was paid mainly to determination of dry matter, fat, protein, casein, urea nitrogen and lactose.
MATERIALS AND METHODS
Materials and reference values
Ewe’s milk samples were taken during the lacta-tion. Experimental animals did not show any health problems during the whole study period.
Following data were obtained by a reference method: dry matter (DM) gravimetrically method, by oven drying at 102 ± 2 °C to constant weight (ČSN ISO 6731). Total nitrogen (TN) was assessed accor-ding to Kjeldahl method using Kjeltec Auto 1031 Analyzer, Foss Tecator, Sweden (MARSHALL, 1992) and crude protein (CP) was calculated as N x factor of 6.38. True protein (TP) were determined spectropho-tometrically - the apparatus Pro-Milk II, Foss Electric, Denmark. Fat (F) was determined by gerber method (ČSN ISO 2446). Lactose (L) was determined polari-metrically as monohydrate (CVAK, PETERKOVá & ČERNá; 1992). Urea nitrogen (UN) was analysed by method of gAjDůŠEK, jELíNEK & HAMPL; 1996. All measurements were made in duplicate.
FT NIR analysis
A wavelength scanning instrument FT NIR Anta-ris (ThermoNicolet, USA) was used with a scanning range from 4 000 to 10 000 cm–1 in reflectance mode.
Samples of ewe’s milk were warmed to 40 °C, agi-tated, cooled to 20 °C and transferred to Petri dis-hes. The measured area was spaced by a metallic mir-ror. An average of 100 spectral scans was taken for each sample. Diffuse reflectance was recorded as log 1/R. Each sample was analysed three times and the average spectrum was used for calibration. The whole spectrum area has been tested.
The calibration model was created by partial least squares (PLS) algorithm (HAALAND & THOMAS, 1988). The same samples were employed for full cro-ss validation by software FT NIR Reference Analysis. The selection of optimum number of PLS terms for the calibration was based on the standard error of predic-tion (SEP), which should be minimised. The statistical parameters (correlation coefficient – r and SEP) were used to determinate the final calibration equation.
All results were evaluated using the variation sta-tistic analysis (ANOVA). Correlation matrices and regression functions were calculated according to SNEDECOR & COCHRAN (1967) when using the statistical package Microsoft® Excel 2000 and Uni-stat 5.1.
RESULTS AND DISCUSSION
The calibration model for the ewe’s milk was cre-ated using 73 samples for estimation of DM, 79 sam-ples for F, 76 samsam-ples for TP, 46 for C, 59 for UN and 79 for L. The calibration model was constructed using the PLS algorithm. PLS factors used in our calibra-tion model involved spectral informacalibra-tion and, at the same time, also concentration data. The dependence of predicted residual error sum of squares (PRESS) on the number of factors used for calibration of com-ponents of the PLS method is an important diagnos-tic tool and enables to estimate the optimal number of factors. A high value of PLS factors indicates the accuracy of prediction because PRESS involves also the spectral noise.
Means of reference values, their standard deviati-ons and PLS factors are presented in Table I. Numbers of PLS factors for DM, F, C and UN are relatively low and the PRESS function shows a decreasing tenden-cy. For P and L, however, the number of factors is hi-gher but the PRESS function again decreases. It can be concluded that due to a high number of samples all models are robust. Dependence of PRESS function on the number of PLS factors used for calibration of esti-mation of C in milk is presented in Figure 1.
I: Mean, range and standard deviation (SD) for each of the data sets used as a calibration or test set
Component N Mean Minimum Maximum SD Number of PLS factors
Ewe’s milk
Dry matter (%) 73 16.82 14.67 19.72 0.95 9
Fat (%) 79 7.24 4.37 10.77 1.52 8
True protein (%) 76 6.08 4.71 9.30 0.78 14
Casein (%) 46 4.55 2.97 6.67 0.90 7
Lactose (%) 79 4.71 3.59 5.33 0.34 13
Urea Nitrogen (mg 100mL–1) 59 67.41 33.69 102.11 15.90 7
Calibration and validation results of estimations of individual milk components are presented in Tables II and III. Unfortunately, these results cannot be com-pared with any other studies dealing with the deter-mination of basic components of ewe’s milk. Until now only results of studies on cow’s milk and dairy products were published. TSENKOVA et al. (1999); TSENKOVA et al. (2000) and TSENKOVA, ATANA-SSOVA, & TOyODA (2001) determined the highest positive coefficients for fat, protein, lactose and total solids. RU & gLATZ (2000) published similar results with non-homogenised cow’s milk. KUKAČKOVá, ČURDA & jINDřICH (2000) reported the best cali-bration results for prediction of DM, F and P (in cow’s
milk was 0.975, 0.967 and 0.965, respectively). jAN-KOVSKá & ŠUSTOVá (2003) determined, in sam-ples of unhomogenized raw cow’s milk, the following values of correlation coefficients: DM 0.928; F 0.961; P 0.985; C 0.932; UN 0.906 and L 0.931. ŠAŠIČ & OZAKI (2001) mentioned smaller correlation for pro-tein (0.924 up 0.960), very low correlation for lacto-se (0.696) and very high correlation for fat (0.996) in homogenized cow’s milk. ALBANELL et al. (2003) analysed homogenized goat’s milk (fat 0.98, protein 0.96, casein 0.91, total solid 0.94) and unhomogeni-zed goat’s milk (fat 0.97, protein 0.95, casein 0.92, total solid 0.95) with lower results of correlation. 1: Dependence of the PRESS function on the number of PLS factors used for calibration of esti-mation of casein in ewe’s milk
C ros s validation plot for cas ein in s heep milk
0 0,2 0,4 0,6 0,8 1
0 2 4 6 8 10
PLS fac tors
Y - residual variance
II: Parameters of the regression function y´i = a + bxi for the calibration model
Component a ± bxi SEC CCV(%) R
Ewe’s milk
Dry matter (%) 0.571 ± 0.966 0.18 1.07 0.983
Fat (%) 0.158 ± 0.978 0.23 3.18 0.989
True protein (%) 0.039 ± 0.994 0.06 0.99 0.997
Casein (%) 0.208 ± 0.954 0.19 4.18 0.977
Lactose (%) 0.177 ± 0.962 0.07 1.49 0.980
Urea Nitrogen (mg 100mL–1) 3.571 ± 0.947 3.66 5.43 0.973
III: Parameters of the regression function y´i = a + bxi for the validation model
Component a ± bxi SEp PCV(%) R
Ewe’s milk
Dry matter (%) 1.600 ± 0.905 0.33 1.96 0.940
Fat (%) 0.209 ± 0.971 0.27 3.73 0.984
True protein (%) 0.053 ± 0.991 0.09 1.48 0.994
Casein (%) 0.268 ± 0.941 0.24 5.27 0.963
Lactose (%) 0.315 ± 0.933 0.09 1.91 0.962
Urea Nitrogen (mg 100mL–1) 23.295 ± 0.658 9.07 13.41 0.822
R – correlation coefficient; SEP – standard error of prediction; PCV – prediction coefficient of variation
IV: Parameters of basic components in ewe’s milk as estimated by NIR reference values and their mutual com-parison by paired Z-test
Component N NIR REF d SD
Ewe’s milk
Dry matter (%) 73 16.822 16.823 –0.001 0.94
Fat (%) 79 7.243 7.243 0.000 1.51
True protein (%) 76 6.078 6.078 0.000 0.77
Casein (%) 46 4.549 4.549 0.000 0.88
Lactose (%) 79 4.709 4.709 0.000 0.33
Urea Nitrogen (mg 100mL–1) 59 67.408 67.408 0.000 15.47
* P<0.05; N – number of samples; NIR – mean of the NIR values; REF – mean of the reference values; d – dif-ference of mean of NIR and redif-ference values; SD – standard deviation of mean
The validation model was constructed on the base of cross validation using the same set of samples (i. e. those, which were used for calibration). This vali-dation checks reliability of the calibration model and is characterised by the standard error of prediction (SEP). Expected values of calibration coefficient of variation (CCV) and of prediction coefficient of vari-ation (PCV) lower than 5% and 10%, respectively, are considered to be very reliable. In our experiments, values of CCV were lower than 5% for all compo-nents excepting urea nitrogen in milk. In this case also the PCV value was higher than 10%. It seems that this was caused by a narrower variation of measured values so that the reliability of the constructed model could be negatively influenced. ALBANELL et al.
(2003) determined results of SEC and SEP identical to our results. LAPORTE & PAQUIN (1999) achie-ved lower results of SEC (0.12 for fat, 0.06 for crude protein, 0.04 for true protein and 0.05 for casein) and SEP (0.07 for fat, 0.06 for crude protein and casein, 0.05 for true protein. All these authors concluded that the NIRS method could be used for a quick analysis of cow’s milk components.
2: Relationship of calibration and validation results of true protein in ewe’s milk
3: Relationship of calibration and validation results of fat in ewe’s milk
4: Relationship of calibration and validation results of casein in ewe’s milk 4
5 6 7 8
4,5 5 5,5 6 6,5 7 7,5 8
T ru e pro te in c o n te n t, c h e m ic a l (% )
True protein content,NIRS (%)
calibration validation Linear validation Linear calibration
y = 0.99x + 0.04 r = 0.996
y = 0.90x + 0.54 r = 0.968
4 6 8 10 12
4 5 6 7 8 9 10 11
F a t c o nte nt, c he m ic a l (% )
Fat content, NIRS (%)
calibration validation Linear validation Linear calibration
y = 0.85x + 0.89 r = 0.921
y = 0.79x + 1.18 r = 0.88
2,5 3,5 4,5 5,5 6,5
3 4 5 6 7
C a s e in c o n te n t, c h e m ic a l (% )
Casein content, NIRS (%)
calibration validation Linear validation Linear calibration
y = 0.95x + 0.21 r = 0.977
5: Relationship of calibration and validation results of urea nitrogen in ewe’s milk
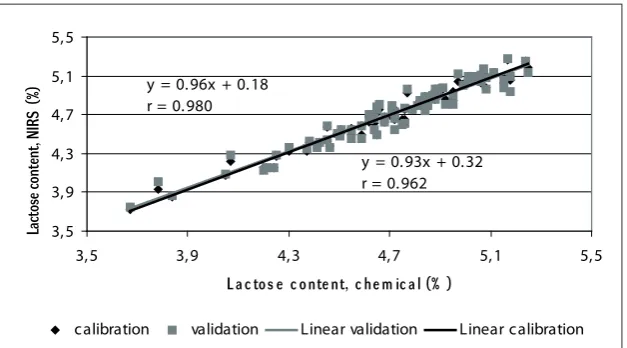
6: Relationship of calibration and validation results of lactose in ewe’s milk 30
50 70 90 110
30 50 70 90 110
U re a nitro g e n c o nte nt, c he m ic a l ( m g 100 m L- 1)
Urea nitrogen, NIRS
(mg 100 mL
-1)
calibration validation Linear validation Linear calibration
y = 0.947x + 3.5706 r = 0.9731
y = 0.658x + 23.295 r = 0.8217
3,5 3,9 4,3 4,7 5,1 5,5
3,5 3,9 4,3 4,7 5,1 5,5
L a c to s e c o nte nt, c he m ic a l (% )
Lactose content, NIRS (%)
calibration validation Linear validation Linear calibration
y = 0.96x + 0.18 r = 0.980
y = 0.93x + 0.32 r = 0.962
Values predicted by means of NIRS method were tested using a paired Z-test and are presented in Table 4 together with reference values. Statistically signifi-cant differences between the reference values and the calculated values of NIR were not found.
CONCLUSIONS
Statistical results showed sufficient accuracy on predictions of major components of ewe’s milk using reflectance mode on Petri dishes. NIRS method is sui-table for the estimation of individual components of
SOUHRN
Analýza ovčího mléka FT NIR spektrometrem; měření vzorků na Petriho misce reflektanční kyvetou
Práce se zabývá možností stanovení základních složek ovčího mléka (sušiny, tuku, čistých bílkovin, kaseinu, laktózy a močoviny) FT NIR spektrometrem. Vzorky mléka byly před vlastním měřením zahřáty na teplotu 40 °C, protřepány a ochlazeny na 20 °C. Poté byly umístěny na Petriho misku a pro-měřeny kovovým zrcátkem na integrační sféře. Výsledky kalibračních korelačních koeficientů: sušina 0,983; tuk 0,989; čisté bílkoviny 0,997; kasein 0,977; laktóza 0,980 a močovina 0,973. Hotové kalibrač-ní modely byly ověřeny křížovou validací. Z-testem nebyly zjištěny rozdíly mezi referenčkalibrač-ními hodno-tami a hodnohodno-tami naměřenými NIR spektrometrem (p=0,05). Na základě uvedených výsledků vyplývá, že NIR spektrometr je možno použít k rychlé analýze základních složek ovčího mléka.
blízká infračervená spektroskopie, ovčí mléko, sušina, tuk, bílkoviny, kasein, laktóza, chemické složení
REFERENCES
ALBANELL, E., CAjA, g., SUCH, x., ROVAI, M., SALAMA, A., CASALS, R.: Determination of Fat, Protein, Casein, Total Solids, and Somatic Cell count in goat’s Milk by Near-Infrared Reflectan-ce Spectroscopy. Journal of AoAC International, 2003, 86, 4, 746–752
ANTUNOVIČ, Z., STEINER, Z., SENCIČ, D., MANDIČ, M., KLAPEC, T.: Changes in ewe milk composition depending on lactation stage and fee-ding season. Czech J. Anim. Sci., 2001, 46, 75–82 CHEN, j. y., IyO, CH., KAWANO, S.: Development
of Calibration with sample cell Compensation for Determining the Fat Content of Unhomogenised Raw Milk by s Simple Near Infrared Transmittan-ce Method. J. Near. Infrared Spectroscopy, 1999, 7, 265–273
CVAK, Z., PETERKOVá, L., ČERNá, E.: Chemical and physically-chemical methods at control quality of milk and milk products. 1992, VÚPP STI, Praha ČSN ISO 6731 Milk, cream and evaporated milk –
Determination total solids content. 1998-02
ČSN ISO 2446 Milk – Determination of fat content (Routine method). 2001-12
gAjDůŠEK, S., jELíNEK, P., HAMPL, A.: Somatic cell counts in goat milk and their relation to milk composition and properties. Czech J. Anim. Sci., 1996, 41, 25–31
gAjDůŠEK, S., KRáČMAR, S., KUCHTíK, j., jELíNEK, P.: Changes basic composition of sheep colostrum (during first 72 hours after parturition). Acta univ. agric. et silvic. Mendel. Brun., 2003, 51, 1, 55–60
HAALAND, D. M., THOMAS, E. V.: Partial least-squares methods for spectral analyses. 1. Relation to other quantitative calibration methods and the extraction of qualitative information. Anal. Chem., 1988, 60, 1193–1202
HAALAND, D. M., THOMAS, E. V.: Partial
least-squares methods for spectral analyses. 2. Appli-cation to simulated and glass spectral data. Anal.
Chem., 1988, 60, 1202–1208
jANKOVSKá, R., ŠUSTOVá K.: Analysis of cow milk by near-infrared spectroscopy. Czech J. Food Sci., 2003, 21, 4, 123–128
jELíNEK, P., gAjDůŠEK, S., ILLEK, j., HELANO-Vá, I.: Changes in the milk composition and meta-bolic profile of blood of sheep during lactation. Fo -lia, A, Universitas agriculturae Brno, 1991, 52 p. KRáČMAR, S., gAjDůŠEK, S., KUCHTíK, j.,
ZEMAN, L., HORáK, F., DOUPOVCOVá, g., MATĚjKOVá, R., KRáČMAROVá, E.: Changes in amino acid composition of ewe’s milk during the first month of lactation. Czech J. Anim. Sci., 1998, 43, 369–374
KUKAČKOVá, O., ČURDA L., jINDřICH j.: Mul-tivariate calibration of raw cow milk using NIR spectroscopy. Czech J. Food Sci., 2000, 18, 1, 1–4 LAPORTE, M. F., PAQUIN, P.: Near-infrared
Analy-sis of Fat, Protein, and Casein in Cow’s Milk. Jour-nal of Agricultural and Food Chemistry, 1999, 47, 7, 2600–2605
MARSHALL, R. T.: Standard methods for the exami-nation of dairy products. 16th ed. AM. Public Heal-th Assoc., Washington, 1992
NOWAKOWSKI, P., SZULC, T., OSMAN, K., KOZyRA, R.: Variability in sheep colostrum com-position. Teszyty Naukowe Akademii Rolniczej we Wroclawiu – Zootechnika, 1992, 35, 185–194 O’SULLIVAN, A., O’CONNOR, B., KELLy, A., M.,
MCgRATH., M.: The use of chemical and infra-red methods for analysis of milk and dairy products. International Journal of Dairy Technology, 1999, 52, 4, 139–148
RODRIgUEZ-OTERO, j.L., HERMIDA, M., CEN-TENO, j.: Analysis of Dairy Products by Near-Infrared Spectroscopy: A Rewiew. J. of Agric. Food
Chem., 1997, 45, 8, 2815–2818
RU, y.j., gLATZ, P.C.: Application of Near Infrared Spectroscopy (NIR) for Monitoring the Quality of Milk, Cheese, Meat and Fish. Asian-Aus. J. Anim.
Sci., 2000, 13, 7, 1017–1025
SATO, T., yOSHINO, M., FARUKAWA, S., SOMEyA, y., yANO, N., UOZUMI, j., IWAMO-TO, M.: Analysis of milk constituents by the near infrared spectrophotometer method. Jpn. J. Zoo-tech. Sci., 1987, 58, 698–706
SNEDECOR, g.W., COCHRAN, W.g.: Statistical Methods. Iowa: 6th ed. Iowa State
University Press, 1967, 579 p.
ŠAŠIČ, S., OZAKI, y.: Short-Wave Near-Infrared Spectroscopy of Biological. Fluids. 1. Quantitative Analysis of Fat, Protein, and Lactose in Raw Milk by Partial Least-Squares Regression and Band
Assign-ment. Analytical Chemistry, 2001, 73, 1, 64–71 TSENKOVA, R., ATANASSOVA, S., TOyODA, K.,
OZAKI, y., ITOH, K., FEARN, T.: Near-Infrared spectroscopy for dairy management: measurement
of unhomogenized milk composition. J. Dairy Sci., 1999, 82, 2344–2351
TSENKOVA, R., ATANASSOVA, S., ITOH, K., OZAKI, y., TOyODA, K.: Near infrared spectros-copy for bio monitoring: Cow milk composition measurement in a spectral region from 1,100 to 2,400 nanometers. American Sci. of Animal., 2000, 78, 515–522
TSENKOVA, R., ATANASSOVA, S., TOyODA, K.: Near Infrared Spectroscopy for Diagnosis: Influ-ence of Mammary gland Inflammation on Cow’s Milk Composition Measurement. Near Infrared Analysis, 2001, 2, 1, 59–66
TURZA, S., CHEN, j. y., TERAZAWA, y., TAKU-SARI, N., AMARI, M., KAWANO, S.: On-line monitoring of Rumen Fluid in Milking Cow’s by Fibre Optics in Transmittance Mode Using the Lon-ger NIR Region. J. Near Infrared Spectroscopy., 2002, 10, 111–120
ŽIŽLAVSKý, j., MIKŠíK, j., gAjDůŠEK, S., POSPíŠIL, Z.: Changes and variability of cow’s milk components and properties during the 1st 100 days of lactation. Czech J. Anim. Sci., 1989, 34, 675–685
Address