International Journal in Management and Social Science (Impact Factor- 5.276) A STUDY OF AGRICULTURAL GROWTH AND TRENDS IN INDIA
Dr. Dara Singh, Assistant Professor, Department of Economics, Kurukshetra University Kurukshetra, Haryana,
ABSTRACT: This research paper is dependent on secondary data collected from various published sources
on area of agriculture, production and yield. The cultivated area in our country constantly remained
more or less but the demand for food increased. During the case study it was observed that the cropping
pattern in country undergone significant changes and shift from food grains to commercial crops. All
over the country for higher growth of crops production the use of modern varieties of seeds, irrigation
facilities and fertilizers were among the important factors.
Key words: agriculture, growth, India, commercial crops, fertilizers, irrigation.
INTRODUCTION: The concerned study is related the period of 1990-2007. Regarding the cited period data on significant variables as value of output, input use and production were collected from various published sources. In India the pattern system during the mentioned period undergone significant changes. Dramatic change has been observed in the agriculture as the cultivation of food grains to commercial crops. In the period of 1990 and 2007 among food grains the area under cereals declined by 13.3%. During the study period the performance of pulses in terms of area and output was not impressive. The effects of technology have not witnessed on the production of pulses. But even then higher production had been observed during the mentioned period, because of the use of modern fertilizers and irrigation facilities. Although rice and wheat crops boosted by the technology and institutional support in some areas. The results of crops, output growth model, show that normal rainfall, better irrigation facilities, capital formation and improved fertilizer assisted to improve crop production in the country.
International Journal in Management and Social Science (Impact Factor- 5.276)
In these circumstances higher in agriculture growth and enhancement in the income of farmers has been a important point for policy makers. Although since required attention has not been extended to this sector by our governments.
However since the mid of 2000 s there has been renewed policy on the agriculture to revive agriculture growth rate through various development programmes such as the national agriculture development programme, National food security and interest subsidy on crop loans. These programmes are likely to boost the agriculture growth and farmers income in the country. In addition to this trends and patterns in agriculture are the major subjects to be researches and studies.
This research paper is dependent on secondary data collected from various published sources. Data regarding area of agriculture, production and yield were compiled from the Ministry of Agriculture and directorate of economics and statistics. Data on value of crop output were collected from the central statistical Organistation, Government of India.
In our country cropping patterns undergone important changes. The cultivated area in our country constantly remained more or less but the demand for food increased.
According to value of output the Share of various crops:
At National level the growth performance of major crops It is well known fact that area was the major factor of production growth till early 1960. While the high production verities were introduced in the late sixties. Along with the technology, new institutional structure enabled the farmers to adopt improved method of cultivation except all this the provision of guaranteed support price and input subsidies, government procurement system and better irrigation facilities are some other factors of higher production of crops. In the early green revaluation period during 1967-68 to 1979-80 the wheat production observed compound annual growth of 5.03%. In case of rice, growth in yield contributed to production growth of 1.84% per annum. On the other side for food grains as a whole, the growth in area and yield were 1.75% and 0.43% respectively and resulted in production growth of 2.19%.
This is the point to be noted that higher growth rate in the production of wheat and rice was witnessed in this period. This was happened in the North-West India where market incentives were in force, favourable policy environment for providing inputs to farmers at subsidised rates, assured government procurement for wheat and rice and in terms of price support.
International Journal in Management and Social Science (Impact Factor- 5.276) Table 1 Growth Rates in Agriculture GDP: All India
Period Growth Rate (per cent per annum)
1950-1 to 1964-5 2.51
1967-8 to 1980-1 2.20
1980-1 to 1990-1 3.07
1992-3 to 1996-7 3.85
1992-3 to 2001-2 2.76
1997-8 to 2004-5 1.60
2004-5 to 2010-1 3.47
Source : National Accounts Statistics. Various years. Central Statistical Organization, Government of
India.
Note : GDP is in 1980-1 constant prices from 1950-1 to 1980-1; in 1993-4 constant prices for the period 1980-1 to 2004-5; in 2004-5 constant prices for the period 2004-5 to 2010-1, Quick estimates for 2009-10 and advanced estimates fro 202009-10-1.
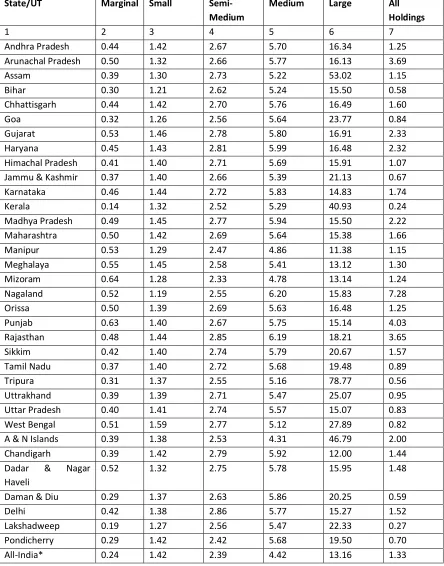
International Journal in Management and Social Science (Impact Factor- 5.276) Table 2. Average Size of Land Holdings in 2000-01
State/UT Marginal Small Semi- Medium
Medium Large All Holdings
1 2 3 4 5 6 7
Andhra Pradesh 0.44 1.42 2.67 5.70 16.34 1.25 Arunachal Pradesh 0.50 1.32 2.66 5.77 16.13 3.69
Assam 0.39 1.30 2.73 5.22 53.02 1.15
Bihar 0.30 1.21 2.62 5.24 15.50 0.58
Chhattisgarh 0.44 1.42 2.70 5.76 16.49 1.60
Goa 0.32 1.26 2.56 5.64 23.77 0.84
Gujarat 0.53 1.46 2.78 5.80 16.91 2.33
Haryana 0.45 1.43 2.81 5.99 16.48 2.32
Himachal Pradesh 0.41 1.40 2.71 5.69 15.91 1.07 Jammu & Kashmir 0.37 1.40 2.66 5.39 21.13 0.67
Karnataka 0.46 1.44 2.72 5.83 14.83 1.74
Kerala 0.14 1.32 2.52 5.29 40.93 0.24
Madhya Pradesh 0.49 1.45 2.77 5.94 15.50 2.22 Maharashtra 0.50 1.42 2.69 5.64 15.38 1.66
Manipur 0.53 1.29 2.47 4.86 11.38 1.15
Meghalaya 0.55 1.45 2.58 5.41 13.12 1.30
Mizoram 0.64 1.28 2.33 4.78 13.14 1.24
Nagaland 0.52 1.19 2.55 6.20 15.83 7.28
Orissa 0.50 1.39 2.69 5.63 16.48 1.25
Punjab 0.63 1.40 2.67 5.75 15.14 4.03
Rajasthan 0.48 1.44 2.85 6.19 18.21 3.65
Sikkim 0.42 1.40 2.74 5.79 20.67 1.57
Tamil Nadu 0.37 1.40 2.72 5.68 19.48 0.89
Tripura 0.31 1.37 2.55 5.16 78.77 0.56
Uttrakhand 0.39 1.39 2.71 5.47 25.07 0.95
Uttar Pradesh 0.40 1.41 2.74 5.57 15.07 0.83 West Bengal 0.51 1.59 2.77 5.12 27.89 0.82 A & N Islands 0.39 1.38 2.53 4.31 46.79 2.00
Chandigarh 0.39 1.42 2.79 5.92 12.00 1.44
Dadar & Nagar Haveli
0.52 1.32 2.75 5.78 15.95 1.48
Daman & Diu 0.29 1.37 2.63 5.86 20.25 0.59
Delhi 0.42 1.38 2.86 5.77 15.27 1.52
Lakshadweep 0.19 1.27 2.56 5.47 22.33 0.27 Pondicherry 0.29 1.42 2.42 5.68 19.50 0.70
All-India* 0.24 1.42 2.39 4.42 13.16 1.33
Note : Includes institutional holdings also.
International Journal in Management and Social Science (Impact Factor- 5.276) Table-3 Agricultural technology, production and productivity growth in India, 1970-1994
Years HYV Adoption Production Growth Productivity Growth
% % %
1970 21 100 100
1971 24 100 99
1972 23 93 92
1973 25 97 98
1974 26 101 100
1975 29 114 113
1976 31 105 103
1977 34 115 112
1978 37 119 114
1979 36 119 113
1980 41 120 112
1981 40 127 116
1982 43 125 110
1983 41 135 118
1984 45 131 114
1985 44 141 120
1986 46 133 114
1987 48 136 114
1988 47 152 130
1989 53 168 134
1990 53 152 121
1991 57 152 119
1992 56 153 118
1993 57 156 118
1994 64 165 118
Sources: HYV(high yielding variety), production and productivity growth data are from Fan, Hazell, and
Thorat, (1999). Food price index is from the Indian Statistical Abstract.
International Journal in Management and Social Science (Impact Factor- 5.276) Table 4 - Agricultural research expenditures in India, 1964-95
Million 1990 Rs.
1965 1,581
1970 1,902
1975 3,178
1980 3,982
1985 4,572
1990 7,085
1995 7,293
Agricultural research expenditures were obtained from the State Planning Commission, Govt. of India.
Table 4 shows the Agricultural research expenditure in India, 1965-1995. In 1965 Indian Govt. shared 1581 Million Rs. Govt. of India spend 1902 million Rs. 3178 and 3982 million Rs. in 1970, 1975 and 1980 respectively. It is reaveled from the table that Rs. 4572 million. 7085 and 7293 million Rs. spend in 1985, 1990 and 1995 respectively.
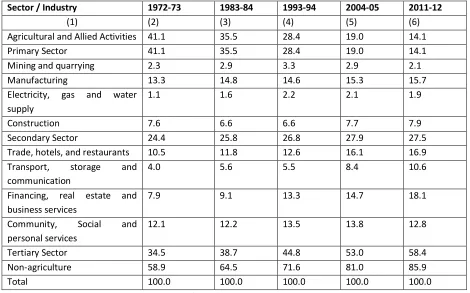
Table 5. Changes in the Industrial Distribution of Gross Domestic Product in India (at 2004-05 prices in %)
Sector / Industry 1972-73 1983-84 1993-94 2004-05 2011-12
(1) (2) (3) (4) (5) (6)
Agricultural and Allied Activities 41.1 35.5 28.4 19.0 14.1
Primary Sector 41.1 35.5 28.4 19.0 14.1
Mining and quarrying 2.3 2.9 3.3 2.9 2.1
Manufacturing 13.3 14.8 14.6 15.3 15.7
Electricity, gas and water supply
1.1 1.6 2.2 2.1 1.9
Construction 7.6 6.6 6.6 7.7 7.9
Secondary Sector 24.4 25.8 26.8 27.9 27.5
Trade, hotels, and restaurants 10.5 11.8 12.6 16.1 16.9 Transport, storage and
communication
4.0 5.6 5.5 8.4 10.6
Financing, real estate and business services
7.9 9.1 13.3 14.7 18.1
Community, Social and personal services
12.1 12.2 13.5 13.8 12.8
Tertiary Sector 34.5 38.7 44.8 53.0 58.4
Non-agriculture 58.9 64.5 71.6 81.0 85.9
Total 100.0 100.0 100.0 100.0 100.0
International Journal in Management and Social Science (Impact Factor- 5.276)
Table 5 shows the 41.1%, 35.5% and 14.1% contribution of agriculture sector in the GDP of India in 1972-73, 1983-84 and 2011-12 respectively. It is reaveled from the table 24.4%, 25.8% and 27.5% contribution of secondary sector in the GDP of India in 1972-73, 1983-84 and 2011-12 respectively. Table also shows the 34.5%, 38.7% and 58.4% contribution of tertiary sector in the GDP of India in 1972-73, 1983-84 and 2011-12 respectively.
Table 6 Sectoral Growth Rates of Rural Employment (%).
1983-1993-94 1993 to 2004-05 1999-2000 to 2009-10
I. Agriculture 1.37 0.69 -0.19
II. Non-Agriculture 3.23 3.64 4.03
Total 1.68 1.40 0.96
II. Sectors within Non-Agriculture
Manufacturing 2.02 2.74 0.62
Construction 5.35 8.27 12.04
Trade / Hotels, etc. 3.76 4.88 3.41
Transport/Communication 4.35 6.56 4.44
Financial Services - 6.13 5.20
Other Services - 0.08 0.77
Source : NSSO Employment and Unemployment Surveys : 38th Round (1983), 50th Round (1993-94), 61th
Round (2004-05) and 66th Round (2009-10).
Table 6 shows sectoral growth rates of rural employment (%). It is reaveled from the table the growth rate of employment have been 1.37%, 0.69 and -0.19% in agriculture in 1983-1993, 1993-2004 and 2000-2010 respectively. Table shows that the growth rate of the rural employment has been 3.23%, 3.64% and 4.03% in non-agriculture sector in the 1983-1993, 1993-2004 and 2002-10 respectively.
Conclusions:
International Journal in Management and Social Science (Impact Factor- 5.276) References:
Chand, Ramesh a nd S S R aju (2 00 9). Insta bility in Indian Agriculture During Different Phases of Technology and Policy. Indian Jour nal o f Agricul tural Eco nomics , 64 (2): 2 83 - 88.
Deshpan de, R S (19 88). Growth and Instability in Maharashtra Agriculture. Arthavijnana , 30 (4): 3 17 - 39.
Deshpan de, R S, M J Bhen de, P Thippaia h a n d M Vivekanan da (20 04). Crops and Cultivatio n, State of the Indian Farmer A Millennium Study, Volume 9. New
Delhi: Academic F ounda tion.
Datt, Gaurav (1998). ‘Poverty in India and Indian States: An Update’, International Food Policy Research Institute, Discussion Paper No. 47, July.
Deaton, Angus and Valerie Kozel. (2005). The Great Indian Poverty Debate, New Delhi: Macmillan India Ltd.
Government of India. (2008). Report of the group Examining Discrepancy in PFCE Estimates from NSSO Consumer Expendiure Data and Estimates Compiled by National Accounts Division. Central
Statistical Organization, Ministry of Statistics and Program Implementation, New Delhi.
Mahendra dev, S (1 987). Growth and Instab ility in Foodgrains Production: An Inter-State Analysis. Econ omic a nd P olitical Weekly, 22 (3 9): A82 -A9 2.
Minhas, B S a nd A V aidyanathan (1 965 ). Gro wth in Crop Output in India, 195 1 -54 to 19 58- 61: An Analysis by Component Elements. Jour nal of In dian Socie ty of Agricultu ral S tatis tics , 1 7 ( 2): 2 30 - 52.
Mukim, Megha and Arvind Panagariya. (2012). Growth, Openness and the Socially Disadvantaged.
Bhagwati, J. and Arvind Panagariya, eds., India’s Reform: How they Produced inclusive Growth, New York: Oxford University Press, pp. 186-246.
Radhakrishna , R (20 02). Agricultural Growth, Employment and Poverty:A Policy Perspective. Eco nomic and Political Weekly,3 7 (3).
Rao, C H Ha numantha ( 200 3). Reform Agenda for Agriculture . Eco nomic and Political Weekly, 33 (29) : 61 5 -2 0.