Improve Sales In Manufacturing Using Data
Mining Techniques
Abdalla Yasin Mabrouk, Mohamed Hasan Ibrahim, Mohamed Helmy Khafagy
Abstract : With the rapidly growing marketing business, data mining technology plays a more important role in the analysis and use of in formation on a large scale. We concern with analysis the data from EMISAL the manufacturing company of Salts Products has a large amount of transactional data on sales data with hidden knowledge of the behavior of customers and what they frequently buy for promotional offers that improve sales in the company. This paper relies on the application of three different association rule algorithms: Apriori, CARMA, and Sequence to obtain the best support and confidence value using IBM SPSS modeler V 18.0 in real data sets taken from EMISAL between January 2016 to July 2019. We reco mmend Make promotional offers that include low-selling products with products that are often sold together.
Index Terms: Association Rules, Data Mining, Market Basket Analysis, Sales, SPSS Modeler.
—————————— ——————————
1.
INTRODUCTION
Market Basket Analysis is a technique based on the theory that if a consumer buys a specific group of products; He is more likely to buy another group of items. For example, if you are in a hypermarket, and you buy a tea, you are more likely to buy sugar at the same time. Once the information is extracted from previous data, it is used to make the best business decisions. Association rules mining used to discover the association between items present in the database. A large amount of data stored in the database hence, several industries must use association rule mining for their databases. This study is using significant functions of data mining to determine the association of combination product promotion rules. Association rule mining is a technique that can be used to find rules associative between combination products. For example, how likely it is for a customer to buy product X and product Y at the same time. In this study, we use data mining algorithms on EMISAL Company that contains a large amount of transactional data on sales, but without sufficient benefit which made us decide to analyze these data using Data Mining Algorithms to extract hidden information that might improve sales, such as discover Relations between products to create an efficient promotion. Analyzing data is very important and essential to enhance the profit of each business for any company. The rest of this paper is organized as follows: Related work in section 2.Proposed methodology in section 3.Application in Section 4. Finally, Results & discussion are given in Section 5.
2 RELATED WORKS
Abhijit Raorane & R.V.Kulkarni (2011), he wants to know the consumer behavior, his psychological condition at the time of purchase and how suitable data mining method apply to improve the conventional method, association rule is employed to mine rules for trusted customers using sales data in a supermarket industry [1].
Sabri Serkan Güllüoğlu (2015), Applied Data mining association Apriori algorithm on a Turkish supermarket chain looking for ways to improve the effectiveness of their campaigns with target customers with the particular offers most likely to attract them back to the store and to spend more time and money on their next visit and determine the promotions of products and customer profiles. Besides association rules, impressive results were found about customer profiles, such as “What items do female customers buy? " or “What do consumers (married and 35-45 aged) prefer mostly? "[2]. Seren Sezen Karalök , Adnan Aktepe, Süleyman Ersöz (2016), Applied Data mining association algorithms Apriori, CARMA, and GRI algorithm on big supermarket data set. The comparisons are found using three different algorithms from SPSS Clementine, which is data mining software. The results are varied because different associate methods are applied. Therefore, algorithms gave different results. Alliances have been taken together [3]. Wildan Budiawan Zulfikar,Agung Wahana, Wisnu Uriawan, Nur Lukman,(2016), Applied Data mining association Apriori algorithm on XMART retail company to increase sales of products with a promotion. They obtain the value of the support and confidence of every association rule. The result is a combination of various products and in accordance with the level of sales of the store. In addition, the association rules that have been established to serve as a reference to determine the layout of the products in the store [4].
3 PROPOSED METHODOLOGY
In this study, before using algorithms, we must go through some steps, first selecting the data to be worked on from the data set collected, next, the preparation of raw data, after that application of association rule algorithms, finally analysis & gaining knowledge that helps to make a decision.
3.1 Data Selection
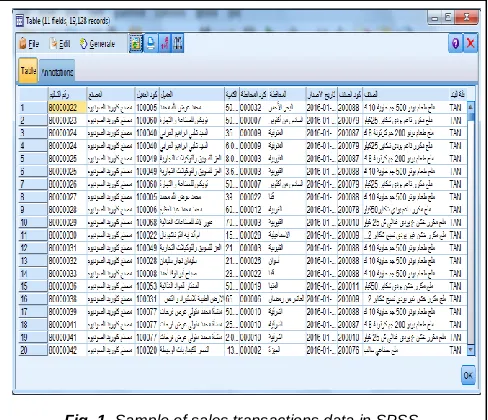
Transnational data is used as input in association rules, which will be used to find various items that are customers purchase together. In this study, data is provided by the manufacturing company. Data is extracted from the EMISAL Sales transactions. Data was taken from January 2016 to July 2019 contains transaction ID, Transaction Date, product ID, store ID, and customer ID, amount of product. Figure 1 below shows a sample of selected raw transaction data.
————————————————
Information System Department, Faculty of Computers and Information, Fayoum University, Egypt, [email protected] Information System Department, Faculty of Computers and
Information, Fayoum University, Egypt, [email protected] Computer Science Department, Faculty of Computers and
Information, Fayoum University, Fayoum City, Egypt,
3658 3.2 Preparation of Raw Data
Data mining software tools can't process data in raw form, as they need a particular tabular form to mine. It is significant to convert these raw data to such a form so that software can process. Figure 2 below shows the example of converted raw data to be processed. It contains a transaction ID, and each product contains Boolean data type such as "T" symbol, which means true or the customer has bought this product, and "F" symbol, which means false or the customer has not purchased this product.
3.3 Algorithms Used For Association Rules
In data mining, association rule algorithms are a popular and well-researched method for discovering hidden relations of an association rule among Products in a large amount of data set. It is prepared to identify strong rules discovered in data set using different measures are called Support and Confidence based on the concept of strong rules. A famously and widely used example of association rule mining is Market Basket Analysis. Support is defined as the percentage/fraction of records that contain product X and product Y to the total number of records in the data set. Suppose the support of an item is 10 %, it means only ten percent of the transactions contain purchasing of these products together. Confidence of an association rule is defined as the percentage/fraction of the number of transactions that contain X product and Y product to the total number of records that contain X product. Confidence is a measured force of the association rules, suppose the confidence of the association rule X⇒Y is 50%, it means that 50% of the transactions that contain X also contain Y together. In this study, we use Apriori, CARMA, and sequence algorithm as association rules algorithms. Apriori algorithm uses items that frequently occur to generate association rules between items. It is based on the concept that a subset of a frequent item must be a frequent item set. Frequent Itemset is an item set whose support value is higher than a threshold value or support value. CARMA algorithm can display the existing association rules online to the user and allows the user to change the minimal support and minimum trust parameters in any operation of the first scan of the data set. CARMA specifies a set of objects as they pass through the movements. After reading each move, it first increases the
numbers of the objections of the sub-clusters of the movement. Then, if all the existing subclasses of the object instance provide the minimum support value, and if they are larger than the read-out of the data set, the object instances from the movement are created. An upper limit on the number of objects is computed so that the probability that an object is likely to be extreme can be precisely predicted. This is the sum of the current number and the estimate of its occurrence before the object instance is created. The sequential algorithm of pattern mining is a topic of data mining concerned with finding relevant patterns between products where the values are delivered in a sequence. It is usually assumed that the values are discrete, and thus, time series mining is closely related, but often considered a different activity. It includes building efficient databases and indexes for sequence transactions, extracting the frequently occurring patterns, comparing sequences based on their similarity, and recovering missing sequence members.
4 MODELING
This study was conducted using data mining software SPSS Modeler version 18 after the data has been Prepared and the data has been adjusted, the Apriori, CARMA, and Sequence algorithms in the data mining software SPSS Modeler have been selected for the study.
4.1 Apriori Algorithm Model
Figure 2 below shows the Apriori algorithm model that has been conducted on SPSS Modeler.
TABLE 1
SAMPLE OF PREPROCESSED DATA
Transaction ID Product A Product B Product C
001 002 003
T F T
F T T
T F F
Fig. 1. Sample of sales transactions data in SPSS
4.2 CARMA Algorithm Model
Figure 3 below shows the CARMA algorithm model that has been conducted on SPSS Modeler.
4.3 Sequence Algorithm Model
Figure 4 below shows the Sequence algorithm model that has been conducted on SPSS Modeller.
5 RESULTS & DISCUSSIONS
For the sales strategy of large scale manufacture, a study of market basket analysis was conducted using data mining Association rules.
5.1 Apriori Results
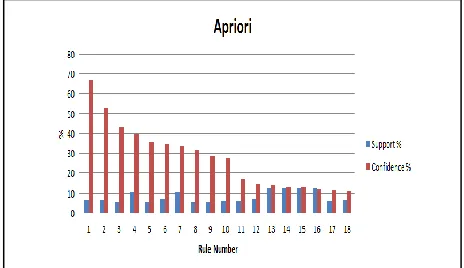
The results of the association analysis for the Apriori algorithm are given in Figure 5.
RESULTS SHOW THAT:
1. Customers who purchase Bono table salt 300 g container 6 kg 1.5 sling has 66.86 probability for buying productBono Table Salt 450 c.
2. Customers who purchase Bono table salt 650 g container 6.5 kg 1.43 slings have 52.73 probability for buying product Bono Table Salt 450 c.
3. Customers who purchase BONO CONTAINER SALT 200G 6K SELING has 43.39 probability for buying product Bono Table Salt 500 g Container 8 kg.
4. Customers who purchase Bono Table Salt 450 c have 39.84 probability for buying product Bono table salt 300 g container 6 kg 1.5 slings.
5. Customers who purchase Bono table salt 200 g have 35.28 probability for buying product Bono table salt 500 g container 10 kg.
6. Customers who purchase Bono Salt Container 200 g 6 Kg has 34.14 probability for buying productBono table salt 500 g container 7.5 kg.
7. Customers who purchase Bono table salt 650 g container 6.5 kg 1.43 slings have 33.40 probability for buying productBono table salt 300 g container 6 kg 1.5 slings.
8. Customers who purchase Bono table salt 500 g has 31.28 probability for buying product Bono table salt 500 g container 10 kg.
9. Customers who purchase Bono salt container 200 g has 28.76 probability for buying productBono table salt 500 g container 10 kg.
10. Customers who purchase Bono table salt 350 c container 7 kg 1.4 i sling has 27.24 probability for buying product Refined soft salt iodi st.
11. Customers who purchase Bono table salt 300 g container 6 kg 1.5 sling has 17.11 probability for buying product Refined soft salt iodi st.
12. Customers who purchase Bono Food Salt 500 g Carton 7.50 kg has 14.77 probability for buying product Bono table salt 500 g container 7.5 kg.
13. Customers who purchase Bono table salt 500 g container 8 kg 1.4 celling ihas 13.67 probability for buying product Bono table salt 350 c container 7 kg 1.4 i sling.
14. Customers who purchase Bono table salt 800 c have 12.96 probability for buying product Bono table salt 350 c container 7 kg 1.4 i sling.
Fig. 3. CARMA Algorithm Model in SPSS
Fig. 4. Sequence Algorithm Model in SPSS
3660
15. Customers who purchase Refined soft salt iodi st has 12.78 for buying productBono table salt 350 c container 7 kg 1.4 i sling.
16. Customers who purchase BONO TABLE SALT CONTAINER 200G6K SILING 1.5T
has 11.83 probability for buying product Bono table salt 350 c container 7 kg 1.4 i sling.
17. Customers who purchase Bono Table Salt 450 c has 11.66 probability for buying product Refined soft salt iodi st.
18. Customers who purchase refined soft salt iodi st has 10.92 probability for buying product Bono Table Salt 450 c
5.2 CARMA Results
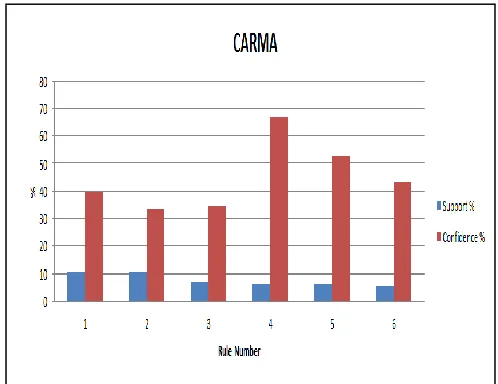
The Graph below in figure 6 illustrates the results of CARMA Algorithm Support and Confidence that measure the force of results.
RESULTS SHOW THAT:
1. Customers who purchase Bono Table Salt 450 c have 39.84 probability for buying product Bono table salt 300 g container 6 kg 1.5 slings.
2. Customers who purchase Bono table salt 650 g container 6.5 kg 1.43 slings have 33.40 probability for buying product Bono table salt 300 g container 6 kg 1.5 slings.
3. Customers who purchase Bono Salt Container 200 g 6 Kg has 34.41 probability for buying productBono table salt 500 g container 7.5 kg.
4. Customers who purchase Bono table salt 300
g container 6 kg 1.5 sling has 66.86 probability for buying product Bono Table Salt 450 c.
5. Customers who purchase Bono table salt 650 g container 6.5 kg 1.43 slings have 52.73 probability for buying product Bono Table Salt 450 c.
6. Customers who purchase BONO
CONTAINER SALT 200G 6K SELING has 43.39 probability for buying product Bono Table Salt 500 g Container 8 kg.
5.3 Sequence Results
The Graph below in figure 7 illustrates the results of Sequence Algorithm Support and Confidence that measure the force of results.
RESULTS SHOW THAT:
1. Customers who purchase refined soft salt iodi st 50 kg has 85 probability for buying product
Refined soft salt iodi st 50 kg.
2. Customers who purchase refined salt soft non-iodine food u 25 kg has 78.57 probability for buying product Refined salt soft non-iodine food u 25 kg.
3. Customers who purchase Fine refined salt iodine skaer 50 kg has 77.27 probability for buying product Fine refined salt iodine skaer 50 kg.
4. Customers who purchase Refined non-iodine fine salt 25 kg has 75.86 probability for buying product Refined non-iodine fine salt 25 kg.
5. Customers who purchase Refined soft salt iodi st has 74.19 probability for buying product Refined soft salt iodi st.
6. Customers who purchase Fine refined salt iodine skaer 50 kg has 61.36 probability for
Fig. 6. CARMA Algorithm Support & Confidence Graph
buying product Refined soft salt iodi st 50 kg.
6
CONCLUSION
In this study, Apriori, CARMA, and Sequence algorithms, which are the 3-way rule algorithm of SPSS Modeler software, are used. As a result of the implementation, each algorithm gave different results. Alliances have been taken together. The recommendation to improve EMISAL Sales, Decision makers can make the promotion of products that were bought together to increase Sales.
ACKNOWLEDGMENT
This research was supported by EMISAL Company. We thank this company for providing the data to us to do this research, and on top of them, we appreciate the Chairman and Managing Director of this company, Dr.Abd-Allatif Alkordy.
REFERENCES
[1] Raorane, Abhijit & Kulkarni, Raja, "Data Mining Techniques: A Source for Consumer Behavior Analysis". International Journal of Database Management Systems,ijdms,2011.
[2] S. S. Güllüoglu, "Segmenting customers with data mining techniques," 2015 Third International Conference on Digital Information, Networking, and Wireless Communications (DINWC), Moscow, 2015, pp. 111, pp. 1-6.
[3] S. S. Karalok, S. Ersoz, and A. Aktepe, “An Application in SPSS Clementine Based on the Comparison of Association Algorithms in Data Mining”, IJISAE, 2016, pp. 234-238.
[4] W. B. Zulfikar, A. Wahana, W. Uriawan, and N. Lukman, "Implementation of association rules with apriori algorithm for increasing the quality of promotion," 2016 4th International Conference on Cyber and IT Service Management, Bandung, 2016.
[5] W. Yong and W. Hengshan, "Research and application of small and medium-sized manufacturing enterprises sales promotion model, based on data mining," ICSSSM11, Tianjin, 2011, pp. 1-6.
[6] D. H. Setiabudi, G. S. Budhi, I. W. J. Purnama, and A. Noertjahyana, "Data mining market basket analysis' using hybrid-dimension association rules, case study in Minimarket X," 2011 International Conference on Uncertainty Reasoning and Knowledge Engineering, Bali, 2011, pp. 196-199.
[7] Setiawan, G. S. Budhi, D. H. Setiabudi, and R. Djunaidy, "Data Mining Applications for Sales Information System Using Market Basket Analysis on Stationery Company," 2017 International Conference on Soft Computing, Intelligent System and Information Technology (ICSIIT), Denpasar, 2017, pp. 337-340. [8] L. Yunyan and C. Juan, "Application of Association Rules
Mining in Marketing Decision-Making Based on Rough Set," 2010 International Conference on Business and E-Government, Guangzhou, 2010, pp. 3749-3752.
[9] S. Malgaonkar, S. Surve and T. Hirave, "Use of mining techniques to improve the effectiveness of marketing and sales," 2013 International Conference on Advances in Technology and Engineering (ICATE), Mumbai, 2013, pp. 1-5.
[10]Maske and B. Joglekar, "Survey on Frequent Item-Set Mining Approaches in Market Basket Analysis," 2018 Fourth International Conference on Computing Communication Control and Automation (ICCUBEA), Pune, India, 2018, pp. 1-5. [11]W. Nengsih, "A comparative study on market basket analysis
and apriori association technique," 2015 3rd International
Conference on Information and Communication Technology (ICoICT), Nusa Dua, 2015, pp. 461-464.
[12]Trnka, "Market Basket Analysis with Data Mining methods," 2010 International Conference on Networking and Information Technology, Manila, 2010, pp. 446-450.
[13]X. Wen-xiu, Q. Heng-nian, and H. Mei-li, "Market Basket Analysis Based on Text Segmentation and Association Rule Mining," 2010 First International Conference on Networking and Distributed Computing, Hangzhou, 2010, pp. 309-313.
[14]D. H. Setiabudi, G. S. Budhi, I. W. J. Purnama, and A. Noertjahyana, "Data mining market basket analysis' using hybrid-dimension association rules, case study in Minimarket X," 2011 International Conference on Uncertainty Reasoning and Knowledge Engineering, Bali, 2011, pp. 196-199.
[15]P. Pukach and K. Shakhovska, "The mathematical method development of decisions supporting concerning products placement based on analysis of market basket content," 2017 14th International Conference The Experience of Designing and Application of CAD Systems in Microelectronics (CADSM), Lviv, 2017, pp. 347-350.
[16]W. Nengsih, "A comparative study on market basket analysis and apriori association technique," 2015 3rd International Conference on Information and Communication Technology (ICoICT), Nusa Dua, 2015, pp. 461-464.
[17]N. Gupta and M. L. Yadav, "An implementation and analysis of DSR using market basket analysis to improve the sales of business," 2014 5th International Conference - Confluence The Next Generation Information Technology Summit (Confluence), Noida, 2014, pp. 82-86.
[18]R. Insani and H. L. Soemitro, "Data mining for marketing in telecommunication industry," 2016 IEEE Region 10 Symposium (TENSYMP), Bali, 2016, pp. 179-183.
[19]Ching-Huang Yun, Kun-Ta Chuang, and Ming-Syan Chen, "An efficient clustering algorithm for market basket data based on small-large ratios," 25th Annual International Computer Software and Applications Conference. COMPSAC 2001, Chicago, IL, USA, 2001, pp. 505-510.
[20]W. F. Abbas, N. D. Ahmad, and N. B. Zaini, "Discovering Purchasing Pattern of Sport Items Using Market Basket Analysis," 2013 International Conference on Advanced Computer Science Applications and Technologies, Kuching, 2013, pp. 120-125.