Muhammad Usman
*and Masato Furuya
Abstract
The Quetta Syntaxis in western Baluchistan, Pakistan, is the result of an oroclinal bend of the western mountain belt and serves as a junction for different faults. As this area also lies close to the left-lateral strike-slip Chaman fault, which marks the boundary between the Indian and Eurasian plates, the resulting seismological behavior of this regime is very complex. In the region of the Quetta Syntaxis, close to the fold and thrust belt of the Sulaiman and Kirthar Ranges, an earthquake with a magnitude of 6.4 (Mw) occurred on October 28, 2008, which was followed by a doublet on the very next day. Six more shocks associated with these major events then occurred (one foreshock and five aftershocks), with moment magnitudes greater than 4. Numerous researchers have tried to explain the source of this sequence based on seismological, GPS, and Environmental Satellite (ENVISAT)/Advanced Synthetic Aperture Radar (ASAR) data. Here, we used Advanced Land Observing Satellite (ALOS)/Phased Array-type L-band Synthetic Aperture Radar (PALSAR) InSAR data sets from both ascending and descending orbits that allow us to more completely detect the deformation signals around the epicentral region. The results indicated that the shock sequence can be explained by two right-lateral and two left-lateral strike-slip faults that also included reverse slip. The right-lateral faults have a curved geometry. Moreover, whereas previous studies have explained the aftershock crustal deformation with a different fault source, we found that the same left-lateral segment of the conjugate fault was responsible for the aftershocks. We thus confirmed the complex surface deformation signals from the moderate-sized earthquake. Intra-plate crustal bending and shortening often seem to be accommodated as conjugate faulting, without any single preferred fault orientation. We also detected two possible landslide areas along with the crustal deformation pattern.
Keywords:ALOS/PALSAR data; Earthquake; Crustal deformation; Source modeling; Conjugate faulting
Background
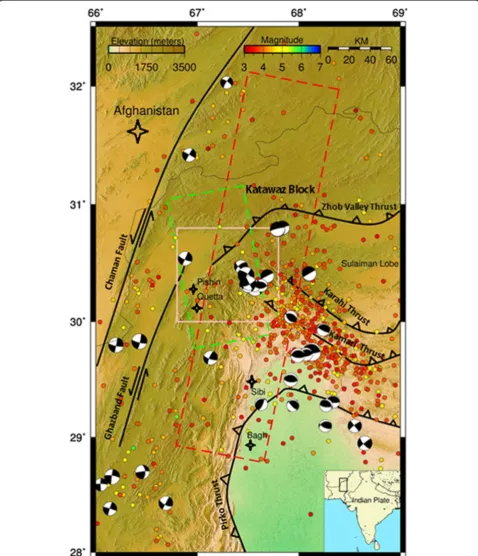
The Indian plate is moving northward at a rate of ~40 mm/year, and its western margin is colliding with the Eurasian plate in Afghanistan and Pakistan. The relative plate motion is presumably partially accom-modated by the prominent ~800-km-long Chaman fault that is supposed to mark the boundary between the two plates, but the present geological structure and historical seismicity suggest a more complex boundary zone that consists of several structural units
(Fig. 1). Although the fold and thrust belts in Baluchistan, Pakistan, are apparent consequences of the obliquely converging plates, the simple oblique convergence of the Indian plate alone cannot account for the complex geological features in the region (Figs. 1 and 2). While the Kirthar Range in the southwest is verging eastward, the Sulaiman Lobe is verging southward, and the Sulaiman Range is verging eastward (Figs. 1 and 2). Based on sand-box modeling, Haq and Davis (1997) suggested that the relatively rigid Katawaz block, north of the Sulaiman Lobe, played an important role in partitioning the strain. Bernard et al. (2000) reached a similar conclu-sion from an inverconclu-sion for the strain field. The Quetta * Correspondence:usman@mail.sci.hokudai.ac.jp
Space Geodesy Research Section, Department of Earth and Planetary Sciences, Hokkaido University, Sapporo, Japan
Syntaxis is presumably formed as a result of an orocl-inal bend in these mountain belts (Fig. 1) and is ex-pected to serve as a junction for thrust faults. It has been uncertain, however, as to what types of faults and/ or ongoing deformation are responsible for generating the Quetta Syntaxis.
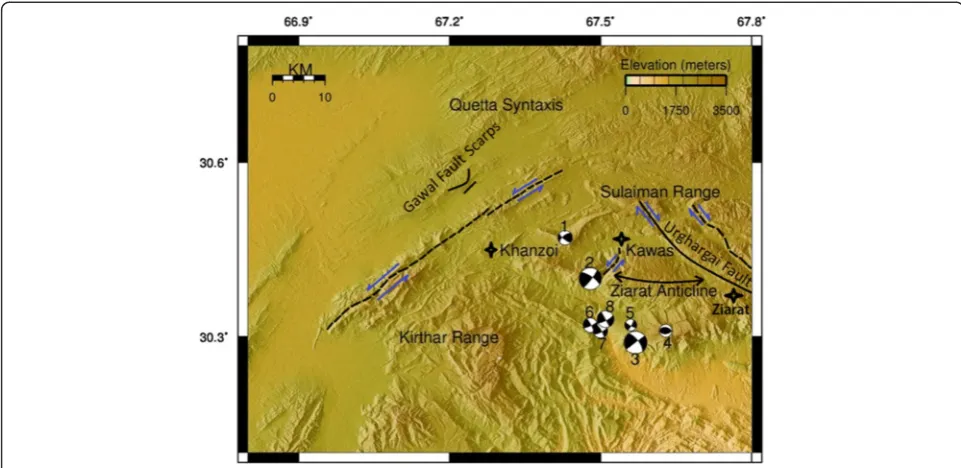
On October 28, 2008, an earthquake with a magnitude of 6.4 (Mw) struck near the Quetta Syntaxis (Fig. 2), followed by a doublet on the very next day, with the same magnitude of 6.4 (Table 1). Focal mechanism solutions for the earthquakes revealed strike-slip mechanisms, which
was unexpected in light of the dominance of nearby thrust faults (Yadav et al. 2012). In association with these major events, one foreshock with a magnitude of 5.3 occurred 35 min before the first main shock. Moreover, there oc-curred five aftershocks with moment magnitudes greater than 4 (Fig. 2). Studying the mechanisms of the earth-quake sequence will provide us with useful constraints for understanding the strain partitioning processes around the Quetta Syntaxis.
Based on the spatial distribution of aftershocks and the focal mechanisms, Yadav et al. (2012) attributed the earthquake sequence to the activation of the right-lateral strike-slip Urghargai fault (Fig. 2) that had been proposed by Kazmi (1979). The GPS study suggested NW–SE-oriented dextral movement associated with the shock sequence of October 2008 (Khan et al. 2008). Based on seismological data, Lisa and Jan (2010) proposed that either the NNW-trending Urghargai fault\or two parallel faults could be the source of the earthquake doublet.
In order to identify the location and geometry of the source faults, however, co-seismic deformation signals derived from the interferometric synthetic aperture radar (InSAR) technique are much more useful because of the dense and wide spatial coverage (Massonnet et al. 1993; Amarjargal et al. 2013). Using C-band (5.6 cm wave-length) Environmental Satellite (ENVISAT) Advanced Synthetic Aperture Radar (ASAR) images, Pinel-Puysségur
Table 1International Seismological Center (ISC) data for events with magnitudes (Mw) greater than 4, related to the shock sequence of October 28, 2008 in Baluchistan, Pakistan. Times indicated are universal time (UTC). The corresponding FMS are shown in Fig. 2
1 22:33:10 10-28-2008 30.5163 67.5639 5.3
2 23:09:58 10-28-2008 30.5928 67.3746 6.4
3 11:32:41 10-29-2008 30.4973 67.5633 6.4
4 16:08:15 11-03-2008 30.4102 67.7571 4.9
5 15:21:10 11-15-2008 20.4918 67.5710 4.8
6 02:46:31 12-09-2008 30.3569 67.5130 5.2
7 05:53:41 12-09-2008 30.3563 67.5179 5.3
8 22:52:37 12-09-2008 30.3912 67.4238 5.7
et al. (2014) and Pezzo et al. (2014) derived the co-seismic deformation signals and revealed the complexity of the re-sponsible fault sources. However, because of low coherence, the ENVISAT/ASAR data lacked signals near the epicentral area, which led to different fault models despite the use of the same satellite data. Here, we use Advanced Land Observing Satellite’s Phased Array-type L-band (23.6 cm wavelength) Synthetic Aperture Radar (ALOS/PALSAR) images to derive the co-seismic deformation signals that are more complete in terms of spatial coverage near the epicentral area. Although Pinel-Puysségur et al. (2014) showed one InSAR image based on ALOS/PALSAR, the InSAR data covered only part of the deforming areas be-cause the analyzed track was shifted to the east. Based on the InSAR images, we generate our fault source model and discuss its implications for the regional strain partitioning and the style of intra-plate deformation.
I) InSAR data processing: methods and observation results
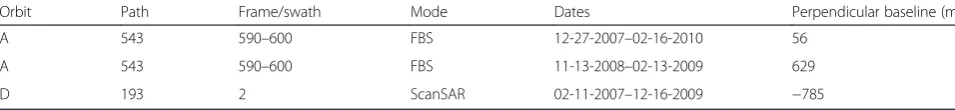
The details of the ALOS/PALSAR data used in this study are shown in Table 2. The fine beam single polarization (FBS) data sets along the ascending path 543 have been used to generate two interferograms: the first one cover-ing the seismic sequence and the second covercover-ing the shocks on December 9, 2008 (Table 2). The microwave’s incidence angle in the image center of the ascending FBS mode is 38.7°. Although no FBS data sets were available along the descending path, we used the swath-2 image of the ScanSAR mode data along path 193, which completely covered the epicenter region. To study the deformation pattern, the ScanSAR data also provide reliable necessary details on the epicenter, which help in the understanding and analysis of crustal deformation patterns related to the earthquake. The fine beam data along the ascending path and ScanSAR data along the descending ALOS path have also been used by Tong et al. (2010) to study the 2008 Wenchuan earthquake in China. The radar incidence angle at the center of the swath-2 image is 29.4°.
The basic SAR and InSAR processing techniques are similar to our previous studies (Kobayashi et al. 2009; Furuya et al. 2010; Furuya and Yasuda 2011, Abe et al. 2013). All the InSAR images were generated from the level 1.0 PALSAR image, using the commercial software package by Gamma Remote Sensing. To remove the
topographic and orbital fringes, we used the SRTM4 Digital Elevation Model (DEM) data from the Shuttle Radar Topography Mission (SRTM) (Jarvis et al. 2008) and the high-precision orbital data provided by the Japan Aerospace Exploration Agency (JAXA), respectively. The observed ground displacements covering the seismic sequence are shown in Figs. 3a and 5a for the ascending path and in Fig. 4a for the descending path. Positive (red) and negative (blue) values in Figs. 3a, 4a, and 5a indicate the range change along the radar line of sight away from and towards the satellite, respectively. The range change is a linear combination of the 3D displace-ments and is equal to +0.62Ue + 0.11Un−0.78Uz for the ascending and−0.48Ue + 0.09Un−0.87Uz for the swath-2 of the descending image, respectively. Here Ue, Un, and Uz are taken as the positive eastward, northward, and up-ward components, respectively. The amplitude of the range changes that cover the main shock sequence is around 15 cm for the ascending (Fig. 3a) and 17 cm for descending images (Fig. 4a); we observed nearly the same amplitude in both the positive and negative range changes. For the source modeling below, the spatial changes in the deformation pattern around the epicenter provided us with strong constraints on the location for the top edge of the fault. In both Figs. 3a and 4a, we could clearly identify at least two phase boundaries that strike NW–SE and NE–SW, across which the signs have changed. We argue below that the phase boundaries can be attributed to the top edge of the two fault segments, RLF1 and LLF1.
We also found breaks in the deformation pattern close to the central part of RLF1, suggesting a bend in the fault surface at this area (Figs. 3a and 4a). The InSAR data indicates that this part has moved towards the sat-ellite for both ascending and descending observations (Figs. 3a and 4a). Examination of the fault mechanism solutions (Fig. 2), which are numbered in sequence ac-cording their occurrence during the observation time, indicates that there is a reverse component in most of the shocks, and fault mechanism no. 4 in Fig. 2 exhibits almost pure reverse faulting. These observations suggest the possibility of uplift in this area.
Besides these two major phase boundaries, we also identified a shorter phase jump to the NW that strikes NE–SW (Figs. 3a and 4a), and another phase jump that strikes NW–SE (Figs. 3a and 4a). For the aftershock dif-ferential interferogram, the range change amplitude was
Table 2ALOS/PALSAR data used in this research (dates are formatted as MM-DD-YYYY)
Orbit Path Frame/swath Mode Dates Perpendicular baseline (m)
A 543 590–600 FBS 12-27-2007–02-16-2010 56
A 543 590–600 FBS 11-13-2008–02-13-2009 629
D 193 2 ScanSAR 02-11-2007–12-16-2009 −785
13 cm for the both positive and negative sense (Fig. 5a). Comparing the location of the phase boundary in Fig. 5a, we found that the phase step location exactly matches the location of the LLF1 in Figs. 3a and 4a. Field obser-vations indicated no clear co-seismic surface rupture (Khan et al. 2008), thus the phase boundaries noted above have no corresponding surface faults. Although cracks on the ground have been observed at some loca-tions (Rafi et al. 2009), there are no clear corresponding signals in Figs. 3a and 4a.
In the original ascending InSAR data covering the seis-mic sequence, we also identified positive range changes of around 14 cm in the NW and SW side of the inter-ferogram that were outside the epicentral areas. These areas apparently correspond to the populated areas of Haramzoi and Killihajezai in the northwest and Quetta in the southwest, where underground water pumping is very common and causes ground subsidence. We masked these unwanted signals for the fault source modeling. We also observed high-amplitude signals of around 17 cm in the
epicentral area, localized in two regions, indicating move-ment away from the satellite for ascending data (Figs. 3a and 6a). However, for the descending data, one area showed movement towards the satellite, and the other area showed movement away from the satellite (Figs. 4a and 7a). Closer examination of the topography (Figs. 6b and 7b) indi-cated that the high-amplitude signal areas are loindi-cated on the northeastern- and eastward-dipping flank of the mountains, which is presumably associated with the earthquake but cannot be reproduced by the fault source modeling shown below (Figs. 3c and 4c). In the aftershock interferogram (Fig. 5a), we also noticed movement away from the satellite with an amplitude of around 8 cm, which was also observed in the same areas, even for the shock with a magnitude of around 5 (Mw). As these signals remain quite obvious in the residue (Figs. 5c and 8a), we interpret these localized deformations as indicating co-seismic landslides, as they come from steeply dipping areas (Fig. 8b), and the spatial scale is more localized than those due to
Fig. 4aObservation along descending path, covering the seismic sequence.bCalculated model whose slip distributions for each segment are shown in Fig. 9. The same fault geometry of four faults, which was used is the ascending InSAR data, i.e.,RLF1,RLF2,LLF1, andLLF2, is shown.
cResiduals between observed and calculated data. High-amplitude signal area enclosed in rectangle is shown in Fig. 7a.Color scalewith positive and negative values shows range changes along radar line of sight, indicating surface movement away and towards the satellite, respectively
fault-related deformations. In addition, considering the rather short perpendicular baselines (Table 2), it is unlikely that they are due to the errors in the DEM.
II) Fault source modeling: methods and results To interpret the co-seismic deformation signals, analyt-ical solutions for the dislocations in an elastic half space are useful, and those by Okada (1992) have been widely used. Okada’s (1992) solutions, however, express the dis-placements due to a rectangular dislocation element, and thus can generate either mechanically incompatible gaps, overlaps, or both when the actual dislocation sources have non-planar geometries (Maerten et al. 2005; Furuya and Yasuda 2011; Abe et al. 2013). Therefore, we used Meade’s (2007) analytical solutions for a triangular dislocation
element to estimate the fault slip from the observed ground displacements. The 3D coordinates for several se-lected control points on each fault segment were picked up, and these points were interpolated with splines to form the fault surface. To avoid unnecessary complica-tions, each fault bottom was kept parallel to the top edge, and the mesh size for each triangular dislocation element was retained at 2.5 km throughout the surface of the fault. The 3D mesh coordinates for each node were generated automatically by the mesh-generating software Gmsh (Geuzaine and Remacle, 2009). Next, the dislocation Green’s function for each triangular slip patch was calcu-lated. Then, slip distributions were inverted as a linear least squares problem (e.g., Jónsson et al. 2002; Simons et al. 2002; Wright et al. 2003). To reduce the data size,
Fig. 5aObservation along ascending path, covering the aftershocks of December 9, 2008.bModeled signals: the sameLLF1fault of the conjugate fault system that was used to explain the deformation of the seismic sequence was used.cMisfit residuals between observed and modeled signals. Area enclosed inblack linesis shown in Fig. 8.Color scalewith positive and negative values shows range changes along radar line of sight, indicating surface movement away and towards the satellite, respectively
quad-tree decomposition was used (e.g., Jónsson et al. 2002; Lohman and Simons 2005). We also applied both a smoothness constraint on the slip distributions with a scale-dependent umbrella operator (Maerten et al. 2005) and a non-negativity constraint on the signs of the fault slip directions (Furuya and Yasuda 2011; Abe et al. 2013). Based on the focal mechanism solutions (Fig. 2), it is rea-sonable to expect that strike-slip faulting is mainly respon-sible for generating the co-seismic ground displacements, although it is not surprising that there is some thrust slip faulting (Table 1). We thus started interpreting the ob-served range changes as such, but as shown below, some complications arose that could not be inferred from seis-mological observations alone. The aforementioned spatial phase changes in InSAR data suggest a NW–SE trending right-lateral fault, RLF1, and a NE–SW trending left-lateral fault, LLF1, forming a conjugate geometry (Figs. 3b and 4b). While RLF1 and LLF1 are the two major seg-ments, we noticed other phase changes that suggest two more segments. Figure 4a indicates clear phase changes to
the south of LLF1 that strikes NW–SE, which we
designated RLF2. This is because the right-lateral strike-slip is mechanically feasible and consistent with the ob-served signs of the phase changes. Moreover, while the magnitude of phase changes is not large, we identified another phase jump to the west of RLF1 in Fig. 4a. As we discuss below, the location is consistent with the F╹2 proposed by Pinel-Puysségur et al. (2014) and the 4th segment proposed by Pezzo et al. (2014). The optimum geometry was obtained after much trial and error (Figs. 3, 4, and 9). The details of trial and error procedure are given in Additional file 1.
The aftershock interferogram (Fig. 5a) shows one clear phase discontinuity that trends NE–SW. Because the lo-cation of the top edge is exactly the same as that of LLF1, as noted above, we can interpret the signals as be-ing due to the left-lateral strike-slip fault on the LLF1. The source modeling produced residuals in the accepted range (Fig. 5c) with logical slip distributions (Fig. 10) leading to the inference that the same fault LLF1 did not only contribute to the seismicity of the main seismic sequence but was also responsible for the aftershocks.
Fig. 7aMagnified view of high-signal areas located on the epicenter, along the descending path, covering the seismic sequence.bTopographic view to investigate high-signal areas
Discussion
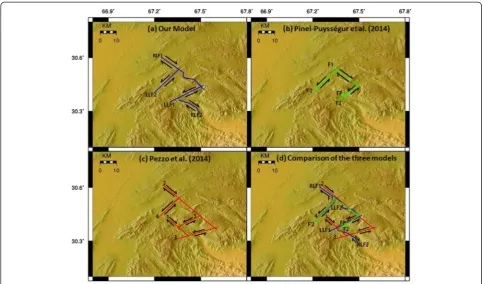
The shock sequence of October 28, 2008 has been stud-ied by many researchers who have trstud-ied to explain the source of its generation. In the earlier studies, a single NW–SE trending fault was suggested by Yadav et al. (2012) and Khan et al. (2008), who analyzed seismological data and GPS data, respectively. In addition, based on the epi-central distributions, Lisa and Jan (2010) suggested right-lateral faults oriented NNW–SSE along one or two parallel faults. On the basis of InSAR data from the ENVISAT/ ASAR C-band radar sensor, Pinel-Puysségur et al. (2014) suggested a four-fault model (three left-lateral faults, F2, F╹2, and FP and one right-lateral fault, F1) (Fig. 11). Mean-while, using the same ENVISAT/ASAR data, Pezzo et al. (2014) presented a five-fault model (three left-lateral faults, 3, 4, and 5, and two right-lateral faults, 1 and 2) (Fig. 11). These models have some significant differences, leaving several ambiguities about the source geometries of the earthquakes. We consider that the significant differences are attributable to the lack of signals around the epicenters, which are most important for the inference of fault sources. Figure 11 shows a comparison of the previous and present fault models, derived from ENVISAT/ASAR and ALOS/ PALSAR data, respectively. Segments F1 and F2 in Pinel-Puysségur et al. (2014), faults 2 and 3 in Pezzo et al. (2014), and RLF1 and LLF1 in our model form a conjugate geom-etry. Because ALOS/PALSAR data are independently
acquired from ENVISAT/ASAR, the consistency of the conjugate fault geometry is an important point. If the dip angles of the conjugate faults are compared to the right-lateral segments, i.e., fault 2 of Pezzo et al (2014), F1 of Pinel-Puysségur et al. (2014), and RLF1in our model have dips of 75°, 73°, and 81°, respectively. On the other hand, the left-lateral segments, i.e., fault 3 of Pezzo et al (2014), F2 of Pinel-Puysségur et al. (2014), and LLF1 in our model have dips of 90°, 89°, and 84°, respectively.
Apart from the curved fault geometry for right-lateral faults in our model (RLF1 and RLF2), there are also other significant differences. In the Pinel-Puysségur et al. (2014) study, the InSAR data were noisy near the location of fault segment FP for the co-seismic interferogram, and the affected area was subsequently masked. Comparison of our model with that of Pinel-Puysségur et al. (2014) shows that segment F╹2 is very close to the location of LLF2 in our model. However, the conjugate faults of the Pinel-Puysségur et al. (2014) model have a larger angle between them, and their intersection point is shifted towards the western side compared to the conjugate geometry of our model. Pinel-Puysségur et al. (2014) also suggested that the aftershocks of December 9, 2008 were caused by a different fault segment, FP, rather than the same segment of conjugate faulting (LLF1 in our model). In addition, segment RLF2 is entirely missing in their study. On the other hand, Pezzo et al. (2014) lacked many of the signals
Fig. 10Slip distributions for the aftershocks of December 9, 2008. The calculated magnitude is 5.7 (Mw). The modeling was performed using the same fault LLF1 as in the conjugate fault system
around the epicentral area. Fault 4 in Pezzo et al. (2014) appears to be located quite close to the location of our fault LLF2, but segment 3 is unnecessary. The aftershock of December 9, 2008 was explained by segment 5, which appears to be located very close to fault LLF1 of our model. Segment 1 crosses segment 5 and penetrates into the block between segments 4 and 5. However, no such breaks have been found in the ALOS/PALSAR data, in the area between LLF1 and LLF2 of our model. Rather, the ALOS/PALSAR data has led us to conclude that segment RLF2 extends further in the SE direction.
This is not the first study to reveal unexpectedly com-plex surface deformation signals even from moderate-sized M6-class earthquakes. For the earthquake sequence that occurred in southeastern Iran on December 10, 2010 (Mw 6.5) and January 27, 2011 (Mw 6.2), Walker et al. (2013) also inferred right-lateral and left-lateral conjugate faulting. Such conjugate geometries in intra-plate earth-quakes have also been reported in thrust-type earthearth-quakes. For the study of 2008 Iwate–Miyagi inland earthquake (Mw 6.9), Japan, both west-dipping and east-dipping thrust faults have been pointed out from PALSAR data (Takada et al., 2009; Abe et al. 2013) and the nearby tilt record Fukuyama (2015) categorized such earthquakes with conjugate rupture planes into two groups: while category 1 indicates the simultaneous rupture of both
the main and conjugate planes, the category 2 indicates the conjugate rupturing after the main rupture. In Table 3, we summarize the moment magnitude com-puted from our fault model. Despite the fact that there were two earthquakes with Mw 6.4, our model reveals that the moment magnitude of the three faults was greater than 6.2. Assuming that the rupture on RLF1 was the first shock, it is likely that the category 1 rup-ture on LLF1 and RLF2 took place the next day, because the combined magnitude seems to confirm the seismological moment magnitude. Intra-plate crustal shortening appears to be often accommodated as con-jugate faulting without any single preferred fault orien-tation, thus forming a distributed deformation zone. The two moderate earthquakes (Mw 6.4) in the present study indicated similar seismological focal mechanisms,
Fig. 11(a) Our model; the location of top edges for each fault segment are shown with blue lines. (b) The model by Pinel-Puysségur et al. (2014) shown with green lines. (c) Pezzo et al. (2014) proposed model, displayed in red lines. (d) Comparison between previous and present models
Table 3Some fundamental parameters of proposed faults
Fault name Dip Cal. mag. (Mw) Status
RLF1 81° 6.5 Covering shock sequence
RLF2 90° 6.2 Covering shock sequence
LLF1 84° 6.3 Covering shock sequence
LLF2 85° 5.9 Covering shock sequence
leaving large ambiguities not only in terms of the fault planes but also the location and size of the actual faults. As long as the deformation signals are detected over the epicentral area, InSAR data are helpful for resolving these ambiguity problems.
Conclusions
Although the crustal deformation associated with the seis-mic event of October 28, 2008 have been independently studied by Pinel-Puysségur et al. (2014) and Pezzo et al. (2014), using ENVISAT/ASAR data, their inferred source models contained several differences that were presumably due to the low-coherence problem of the C-band data. In this research, the same crustal deformations were studied using ALOS/PALSAR L-band data that had high coherence and thus, could nearly completely reveal the crustal defor-mations around the epicentral region. The results indicated that the shock sequence could be explained by two right-lateral and two left-right-lateral faults, and the right-right-lateral faults had a curved geometry. Moreover, whereas previous studies have explained the aftershock crustal deformation using a different fault source, we found that the same left-lateral segment of the conjugate fault system was responsible for the aftershocks.
Additional file
Additional file 1:Trial and error procedure for the fault modeling. Competing interests
The authors declare that they have no competing interests.
Authors’contributions
MU processed the InSAR data, produced the modeling results, and wrote the manuscript. MF helped to establish the fault geometry, wrote the
manuscript, and provided necessary guidance and comments during the entire process of this research. Both authors have read and approved the final manuscript.
Acknowledgement
We are very much thankful to the anonymous reviewers for their critical review. We are also indebted to the editor Dr. Taku Ozawa for carefully reading the manuscript and providing us valuable suggestions. Also, we are grateful to our colleagues Dr. Takatoshi Yasuda and Mr. Shutaro Umemura for their time to time useful comments. PALSAR level 1.0 data was provided by the PALSAR Interferometry Consortium to Study our Evolving Land surface (PIXEL). Ownership of PALSAR data belongs to the Japan Aerospace Exploration Agency (JAXA) and the Ministry of Economy, Trade and Industry (METI/Japan).
Received: 9 June 2015 Accepted: 11 August 2015
References
Abe T, Furuya M, Takada Y (2013) Nonplanar fault source modeling of the 2008 Mw 6.9 Iwate–Miyagi inland earthquake in northeast Japan. Bull Seismol Soc Am 103(No. 1):507–518
Amarjargal S, Kato T, Furuya M (2013) Surface deformations from moderate-sized earthquakes in Mongolia observed by InSAR. Earth Planets Space 65:713–723 Bannert D, Bender FK, Bender H, Grüneberg F, Kazmi AH, Raza HA, Shams FA
(1995) Geology of Pakistan. Gebrüder Borntraeger, Berlin
Bernard M, Shen-Tu B, Holt WE, Davis DM (2000) Kinematics of active deformation in the Sulaiman lobe and range, Pakistan. J Geophys Res 105:13,253–13,279 Fukuyama E (2015) Dynamic faulting on a conjugate fault system detected by
near-fault tilt measurements. EPS. doi:10.1186/s40623-015-0207-1
Furuya M, Yasuda T (2011) The 2008 Yutian normal faulting earthquake (Mw 7.1), NW Tibet: non-planar fault modeling and implications for the Karakax fault. Tectonophysics 511:125–133. doi:10.1016/j.tecto.2011.09.003
Furuya M, Kobayashi T, Takada Y, Murakami M (2010) Fault source modeling of the 2008 Wenchuan earthquake based on ALOS/PALSAR data. Bull Seismol Soc Am 100(5B):2750–2766. doi:10.1785/0120090242
Geuzaine C, Remacle JF (2009) Gmsh: a three-dimensional finite element mesh generator with built-in pre- and post-processing facilities. Int J Numer Meth Eng 79(11):1309–1331
Haq SSB, Davis DM (1997) Oblique convergence and lobate mountain belts of Western Pakistan. Geology 25:23–26
International Seismological Centre (2012) On-line Bulletin, http://www.isc.ac.uk, Int Seis Cent, Thatcham, United Kingdom. Accessed 01 Jan 2013 Jarvis A, Reuter H I, Nelson A, Guevara E (2008) Hole-filled seamless SRTM data
V4, International Centre for Tropical Agriculture (CIAT). http://srtm.csi.cgiar.org. Accessed October 2012
Jónsson S, Zebker H, Segall P, Amelung F (2002) Fault slip distribution of the 1999 Mw 7.1 Hector Mine, California, earthquake, estimated from satellite radar and GPS measurements. Bull Seismol Soc Am 92(no. 4):1377–1389 Kazmi AH (1979) Active faults systems in Pakistan. In: Geol Surv Pak. Geodynamic
of Pakistan, Quetta, Baluchistan
Khan MA et al (2008) Preliminary geodetic constraints on plate boundary deformation on the western edge of the Indian plate from TriGGnet (Tri-University GPS Geodesy Network). J Him Geosci 41:71–87
Kobayashi T, Takada Y, Furuya M, Murakami M (2009) Locations and types of ruptures involved in the 2008 Sichuan earthquake inferred from SAR image matching. Geophys Res Lett 36:L07302. doi:10.1029/2008GL036907 Lisa M, Jan MQ (2010) Geoseismological study of the Ziarat (Balochistan)
earthquake (doublet?) of 28 October 2008. Curr Sci 98(1):50–57 Lohman RB, Simons M (2005) Some thoughts on the use of InSAR data to
constrain models of surface deformation: noise structure and data downsampling. Geochem Geophys Geosys. doi:10.1029/2004GC000841 Maerten F, Resor P, Pollard D, Maerten L (2005) Inverting for slip on three
dimensional fault surfaces using angular dislocations. Bull Seismol Soc Am 95:1654–1665. doi:10.1785/0120030181
Massonnet D, Rossi M, Carmona C, Adragna F, Peltzer G, Feigl K, Rabaute T (1993) The displacement field of the Landers earthquake mapped by radar interferometry. Nature 364:138–142
Meade BJ (2007) Algorithms for the calculation of exact displacements, strains, and stresses for triangular dislocation elements in a uniform elastic half space. Comp and Geosci 33:1064–1075. doi:10.1016/j.cageo.2006.12.003 Nakata T, Tsutsumi H, Khan SH, Lawrence RD (1991) Active faults of Pakistan: map
sheets and inventories. Research Center for Regional Geography. Hiroshima University, Hiroshima
Okada Y (1992) Internal deformation due to shear and tensile faults in a half-space. Bull Seismol Soc Am 82:1018–1040
Pezzo G, Bancori JPM, Atroz S, Antonioli A, Salvi S (2014) Deformation of the western Indian plate boundary: insights from differential and multi-aperture InSAR data inversion for the 2008 Baluchistan (Western Pakistan) seismic sequence. Geophys J Int. doi:10.1093/gji/ggu106
Pinel-Puysségur B, Grandin R, Bollinger L, Baudry C (2014) Multifaulting in a tectonic syntaxis revealed by InSAR: the case of the Ziarat earthquake sequence (Pakistan). J Geophys Res Solid Earth 119:5838–5854. doi:10.1002/ 2013JB010564
Rafi Z, Ahmad N, Rehman SU (2009) Seismotectonic analysis of Ziarat, Balochistan earthquake of 29th October, 2008. Pakistan Meteorological Department, Islamabad, Pakistan, Technical report no. PMD-32/2009
Simons M, Fialko Y, Rivera L (2002) Coseismic deformation from the 1999 Mw 7.1 Hector Mine, California, earthquake as inferred from InSAR and GPS observations. Bull Seismol Soc Am 92(4):1390–1402. doi:10.1785/0120000933 Takada Y, Kobayashi T, Furuya M, Murakami M (2009) Coseismic displacement
due to the 2008 Iwate-Miyagi Nairiku earthquake detected by ALOS/PALSAR: preliminary results. Earth Planets Space 61:e9–e12
Submit your manuscript to a
journal and benefi t from:
7 Convenient online submission
7 Rigorous peer review
7 Immediate publication on acceptance
7 Open access: articles freely available online
7 High visibility within the fi eld
7 Retaining the copyright to your article