Solving the AL Chicken-and-Egg Corpus and Model Problem:
Model-free Active Learning for Phenomena-driven Corpus Construction
Dain Kaplan, Neil Rubens, Simone Teufel, Takenobu Tokunaga
Tokyo Institute of Technology, Stanford University, University of Cambridge, Tokyo Institute of Technology Dept. of Computer Science, mediaX / H-STAR, Computer Laboratory, Dept. of Computer Science
JAPAN, USA, UK, JAPAN
[email protected], [email protected], [email protected], [email protected]
Abstract
Active learning (AL) is often used in corpus construction (CC) for selecting “informative” documents for annotation. This is ideal for focusing annotation efforts when all documents cannot be annotated, but has the limitation that it is carried out in a closed-loop, selecting points that will improve an existing model. For phenomena-driven and exploratory CC, the lack of existing-models and specific task(s) for using it make traditional AL inapplicable. In this paper we propose a novel method formodel-freeAL utilising characteristics of phenomena for applying AL to select documents for annotation. The method can also supplement traditional closed-loop AL-based CC to broaden the utility of the corpus created beyond a single task. We introduce our tool, MOVE, and show its potential with a real world case-study.
Keywords:corpus construction, active learning, tools
1.
Introduction
In recent years, we have seen an explosion of supervised machine learning (ML) techniques in the NLP commu-nity. The accuracy of these supervised ML methods largely depends on three factors: (1) the quality of the prediction algorithm, (2) the quality of training data, and (3) the quan-tity of training data. While research often concentrates on improving prediction algorithms (i.e. creating/improving models), even the best algorithms will fail if they are fed poor quality data during training, i.e. “garbage in, garbage out”. On the other end, corpus construction (CC) typi-cally faces the challenge of maximising the usefulness of annotation while keeping the costs within the allotted bud-get. Corpus annotation is usually undergone in one of three ways: (1) purely automatic, (2) automated annotation fol-lowed by manual correction, and (3) purely manual anno-tation (McEnery et al., 1995).
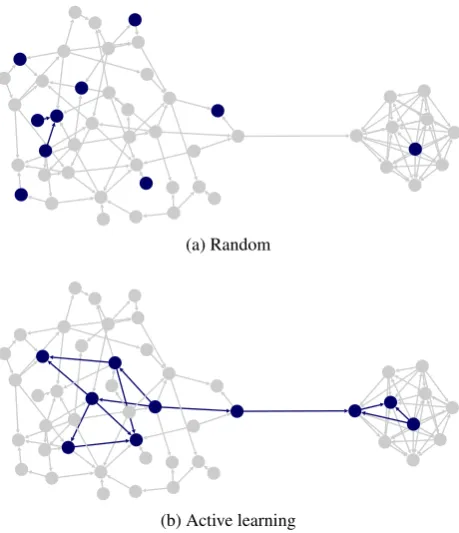
Asactive learning (AL)for CC identifies the most “infor-mative” data for annotation (Olsson, 2009; Tomanek and Olsson, 2009; Settles, 2009; Song and Yao, 2010), at first glance it seems like a perfect fit when by necessity you cannot annotate all documents. For example, consider Fig-ure 1, which shows random input vs. input selected using AL to consider the network structure.
However, this brings us to what we define as the chicken-and-egg corpus and model conundrum, which refers to how AL often happens in a closed-loop process, the underlying model or models directly influencing which data is selected for annotation, which improves the model’s accuracy, and so on.
For exploratory CC in which creators may be investigating hitherto under/unexplored phenomena, no existing corpora and no existing models preclude the use of AL entirely – there is no ‘loop’ yet to close. Further, even for closed-loop AL-based CC, the resultant corpora may have very limited or specific use.
In this paper we propose an active learning method for se-lecting data for annotation in a model-free way, providing
(a) Random
[image:1.595.310.540.325.592.2](b) Active learning
Figure 1: Selection of nodes for annotation.
flexibility to corpus constructors by allowing iterative spec-ification of which characteristics they are interested in, to refine which documents they will ultimately annotate. The method is advantageous in several regards.
phe-nomenon and what can be learned about it with models later on.
Second, even for tasks that have existing corpora and mod-els for which a closed-loop AL process can be applied, we can broaden the potential utility of the corpus in many cases by considering additional characteristics for annotation that may drastically impact the longevity of the corpus.1
Finally, when multiple characteristics are involved, it may be difficult to envision the final outcome of what shape the corpus will take; to mitigate this, we introduce our tool, MOVE (Multi-criteria Optimisation and Visualisation Experimentation tool), that gives users a playground for tweaking and visualising how characteristics contribute to the selection of documents for a corpus. Further, MOVE satisfies many of the concerns raised by Tomanek and Ols-son (2009) as obstacles to adopting AL.2
As visualisation is a key component in this exploratory pro-cess, and networks are often visually intuitive, our method focuses on data that can be represented as a network, i.e. nodes with relations. Any data that can be represented in this form is potentially applicable for use with MOVE. (See Sections 5. and 6. for details.) All figures (excluding Fig-ure 3) in this work were directly taken from MOVE. The rest of the paper is as follows: We introduce our method in Section 2., including a discussion of how we op-timise multiple objectives without a model; we then intro-duce our tool MOVE (Section 4.) before continuing on to a case study (Section 5.) that demonstrates how our method and our tool are useful in adopting AL for CC. We end with a brief discussion on the uses of the tool (Section 6.).
2.
Method Formulation
Let us formulate our proposal in the context of existing AL approaches. The majority of AL methods are designed for supervised learning settings, where given the training data
{(x1, y1), . . . ,(xn, yn)}, the task is to learn a functionf :
X 7→Y that accurately predicts the output valuesY of the inputX. For AL settings, it is assumed that we are able to select which pointsx∈ X will be annotated/labelled (i.e. for which input pointxthe output valueywill be obtained) to create the training set. The task of AL is then to select a setXL ⊂ X of the most “informative” points to label (L). The informativeness of the points is typically evaluated with regards to the expected predictive error off trained on
XL(fXL):
EP E(fXL) =
X
x∈X
L(fXL(x), y), (1)
where L is a loss function, e.g. squared error loss(f(x)−
y)2. The task of active learning is then to find a set of points
1
While in practice it may be sufficient to optimise a given model, and therefore mould a corpus using AL to fit it, this loses sight of the bigger aim, that of studyingphenomenafor under-standing how something works; further, it has been shown to even be detrimental in some cases to apply data acquired for one model using AL to another model (Baldridge, 2004; Rubens and Sugiyama, 2006; Sugiyama and Rubens, 2008).
2The tool is available for download athttps://github.
com/move-tool.
to labelXL as to minimize the expected prediction error: arg minX
LEP E(fXL).
However, in our settings the task is unknown, i.e. yis un-known, and therefore the functionf being modelled is un-known as well; this makes traditional methods (as described above) that rely on these values inapplicable.
Instead of selecting points to improve a model, the points could be selected as to capture certain characteristics of the data, which corpus constructors typically know well. Fur-ther, rather than assigning labels to documents (i.e. assign-ingys toxs), as that would require the task to be defined, what we are doing can be seen instead as enriching a doc-ument’s attributes (i.e. adding dimensions to x) through annotation.
We therefore reformulate the AL task as one of multi-criteria optimisation (Weise, 2009), where the goal is to find the best possible elements to beannotatedXL accord-ing to a set of characteristics/criteriaK = {ki(XL)}mi=1. We then aggregate objectives into a combined utility score
U through a weighted sum3:
U(XL) = X k∈K
wkk(XL). (2)
Our goal is to find XL that maximizes the utility U: arg maxXLU(XL).
3.
Related Work
We next introduce works related to our proposed model-free AL method.
3.1.
Characteristic-based AL
There are characteristic-based methods (e.g., label entropy, variance, etc.) in AL for collaborative filtering (CF) (Rashid et al., 2002; Rubens et al., 2011). However, these methods focus on the characteristics of the labels and not of the points themselves (as is our case). In these settings it is assumed that many of the points have already been labelled by multiple annotators; based on multiple annotators’ la-bels of a point, AL estimates whether additional labelling would be beneficial. In our case labels are undefined; and very few points could be annotated due to high cost.
3.2.
Network Optimisation
Network/Graph optimisation is a broad field with one of its many aims being to optimise the structure of a network or to find a subgraph with regards to a fixed set of network-centred properties. For example, connectivity, such as find-ing the largest complete graph or findfind-ing the largest edge-less induced subgraph; route-based properties, such as min-imum spanning tree, shortest path, or travelling salesman; or flow, such as max-flow min-cut (Easley and Kleinberg, 2010; Leu and Namatame, 2009; Diestel, 2010).
Similar to our method, in network optimisation a subnet-work with desired properties is searched for. However, un-like network optimisation our method considers not only the network-centric properties but also the non-network
3
properties, moreover these properties could be specified by a user at runtime. In addition, in network optimisation no annotation is carried out on a selected subnetwork (unlike in our case, where that is the end goal).
3.3.
Network Sampling
Network sampling typically tries to obtain a scaled-down version of a network (preserving its overall characteris-tics) (Karger, 1998), but in our case we are interested in capturing characteristics that are important to phenomena being studied. Network sampling is also not concerned with the annotation of the nodes, though we are. Further, typically the number of points for sampling is much higher than for active learning, e.g., 15% for sampling vs. under 1% for AL (Leskovec and Faloutsos, 2006).
3.4.
Multi-task Active Learning
Active learning has also been applied to multiple tasks (Harpale, 2012). However, for corpus construction this ap-proach faces challenges of merging corpora annotated for different tasks with different schema using different docu-ments (Tomanek, 2010); e.g., Buyko et al. (2009) present a system populating a biomedical fact database first does some syntactic analysis including, amongst others, statisti-cal parsing, and then turns to the semantics, including NER and relation or event extraction.
3.5.
Active Learning on Networks
There is extensive work on utilising network structure for improving AL, e.g., using additional information pro-vided by edges (Bilgic and Getoor, 2009), network topol-ogy (Hanneke and Xing, 2009) favouring nodes at centre of clusters (Macskassy, 2009), high connectivity (Shi and Zhao, 2010), and social network metrics (Macskassy, 2009; Kuwadekar, 2010; Ji, 2012). However, these works are model-centred, which as explained in the introduction, is not the case for our method, which is trying to liberate the corpus creator from needing a model.
3.6.
Corpus Utility
Tomanek and Wermter (2007) state that AL-based corpora should be reusable for training with modified or improved classifiers to have true utility. In part, this is because it can be difficult to predict the best suited algorithm for a task, so swapping learning algorithms during experimentation may be needed (Busser and Morante, 2005). Not knowing which model will be applied to the constructed corpus may seem minor, but it has been shown both empirically (Baldridge, 2004) and methodologically (Rubens and Sugiyama, 2006; Sugiyama and Rubens, 2008) that samples obtained for one model are often detrimental to another, so is in fact a crucial requirement.
Instead of selecting points to annotate for model tuning (which limits utility of the constructed corpus), the pro-posed method focuses on capturing the phenomena’s char-acteristics as deemed important by the corpus constructor.
4.
MOVE: Multi-criteria Optimisation and
Visualisation Experimentation tool
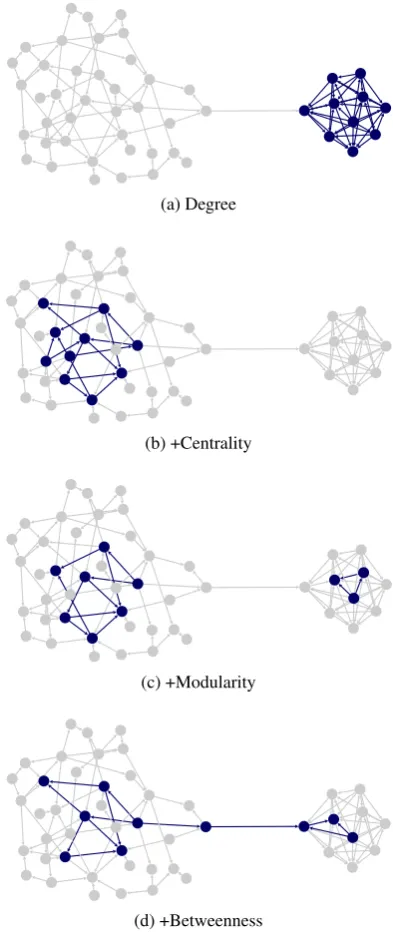
The tool was developed while keeping in mind many of the obstacles preventing the adoption of AL in CC (Tomanek(a) Degree
(b) +Centrality
(c) +Modularity
[image:3.595.317.514.69.536.2](d) +Betweenness
Figure 2: Evolution of graph utility by adding criteria in-crementally, shown visually top-to-bottom.
and Olsson, 2009), namely:
1. insufficient knowledge/expertise (37%),
2. implementation overhead (17.8%),
3. effectiveness doubts (20.5%),
4. incompatible with project (19.2%).
Though we cannot assess a project’s incompatibility (4), MOVE enables users with little/no knowledge of AL (1), eliminates potentially all overhead (2), and because of this, allows those with doubts a means to quickly assess if AL seems effective for them (3).
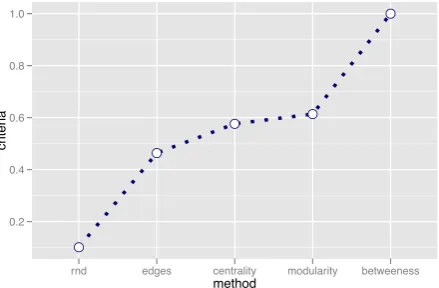
0.2 0.4 0.6 0.8 1.0
●
●
● ●
●
rnd edges centrality modularity betweeness method
cr
iter
[image:4.595.60.280.76.220.2]ia
Figure 3: Overall utility fitness for Figure 2
4.1.
A typical Use Case
The data first needs to be converted into a network repre-sentation if not already so (see Section 4.2.). This network is then loaded into Gephi (Bastian et al., 2009), and us-ing the MOVE plugin, the AL criteria is specified (Section 4.3.), and then the subnetwork selection process must be run (Section 4.5.). Upon completion you inspect the re-sulting subnetwork selection (Section 4.6.), and repeat the above steps until satisfactory steps are obtained. If you are not satisfied with the results, you may want to try adding new criteria, changing weights, and more closely examin-ing the results.
Once acceptable results have been obtained, the annotation process can commence. If during annotation you discover other criteria that is salient to the corpus, you can mark the already annotated points, so that subnetwork optimisation can take these into account, not invalidating invested labour.
4.2.
Graph Data Representation
In many domains, data instances are connected by edges representing certain relationships, forming a graph struc-ture (Ji, 2012); MOVE visualises such relationships. While our method is not graph dependent, the visualisation is a crucial part of allowing users to quickly acquire an intuition of how their criteria impact the selected documents for an iterative process of criteria definition. Thus while the pro-posed method could be applied to other data formats, we have chosen to focus on graph-based data. Any data that can be represented as nodes with relations is potentially a target for use with MOVE. (See Sections 5. and 6. for de-tails on how one might go about representing data that way.) Many AL methods assume independence between points, as a result, the utility is calculated for each point indepen-dently (Kuwadekar, 2010). However, corpus construction often relies on the interdependence of points. Graph-based structures provide an excellent example of inter-point de-pendencies since the points are literally connected. La-belling a point can therefore go beyond the instance it-self, as it provides information about neighbours in the graph (Kuwadekar, 2010).
4.3.
Criteria Definition
One of the assumptions is that domain experts are knowl-edgeable about the characteristics of the phenomena that
they would like to be captured by the corpus. How-ever, they might not predict the complex interactions be-tween them; MOVE aims to provide said needed feedback. MOVE allows specifying not only the network centric crite-ria (for both graphs (Section 4.3.1.) and subgraphs (Section 4.3.2.)); but also criteria based on attributes of nodes and edges (Section 4.4.). Finally the labeling costs and util-ity must also be defined and taken into account (Section 4.4.1.). Below we describe how each of the criteria types could be utilized.
4.3.1. Graph-based Characteristics
Graph-based characteristics describe the overall properties of the graph such as graph density, modularity, number of connected components, clustering coefficient, etc.4
Captur-ing graph-based characteristics allows optimisation of sub-graph selection so that it has the desired properties in rela-tion to the parent graph. Using graph-based characteristics allows us to provide additional information and guidance to the optimisation procedure. Depending on the graph char-acteristic it could be used to establish an upper bound (e.g. number of clusters; even though a subgraph may appear to have more clusters than the parent graph; some of the subgraph’s clusters may indeed belong to the same cluster within the graph), imprecise lower bound (e.g. if you are looking for a denser subgraph, it should be at least as dense as the parent graph), etc.
4.3.2. Subgraph-based Characteristics
Since one premise behind our method is that only a subset of all possible documents can be annotated and thus must be selected from the whole set, because we are using net-works we can treat this subset of items as a subgraph of a larger graph. Since subgraphs are also graphs, we can ap-ply all the graph-centred metrics we apap-ply to the graph as a whole (Section 3.3.). Predominately, the purpose of the subgraph-based characteristics should be to ensure proper-ties of the whole graph are preserved well witin the sub-graph. However, note that the subgraph does not need to precisely reflect the characteristics of the overall graph (this is a goal of network sampling introduced in Section 3.3.), but to capture the phenomena of interest.
4.4.
Attribute-based Characteristics
Here we consider the non-network based attributes of the nodes. E.g., in citation networks an attribute could be the keywords of a paper, its author, publication venue, and so on. Attributes of the edges could indicate the type of cita-tion, based on one of various schemes. Attributes can often be extracted to create nodes or converted to create attributes (e.g., an author could be a distinct node or an attribute on a paper in a citation network).
4.4.1. Utility/Cost-based Characteristics
The aim of active learning (AL) is to select points to max-imise utility and/or to minmax-imise the annotation cost. It is
4It is possible to use any of the extensive graph metrics
therefore necessary to associate characteristics with costs and utility. In AL there are annotation costs that can be defined in terms of negative utility; benefit is harder to de-fine, but could be defined in relation to costs. For exam-ple, for citation analysis, scanning each paper/node incurs a fixed cost, as does annotating the paper’s citations (outgo-ing edges), while incom(outgo-ing edges do not incur a cost since they are not annotated (even if the source nodes are within the corpus, the costs would be associated with the source node, not the target). Depending on the aim of the cor-pus, utility weights can be assigned as characteristics in this manner.
4.5.
Optimisation
Many AL strategies that may yield theoretically near-optimal sample selection are in practice infeasible for use because of excessively high computation times (Cohn et al., 1996). Thus, AL-based annotation should be based on a computationally tractable selection strategy (even if this may result in a less than optimal reduction of annotation costs) (Tomanek and Wermter, 2007).
Many algorithms can quickly find a solution for certain types of graphs (Karger, 1998). We selected a genetic al-gorithm (GA) (using the watchmaker library Dyer (2006)) due to GA’s known ability to robustly handle potentially un-known interactions of various criteria (Weise, 2009) with-out the need for gradient information (Marler and Arora, 2004). These properties are necessary for MOVE since users can define multiple criteria for optimisation at run-time. However, other optimisation methods could be easily incorporated.
4.6.
User Interface
One of the main tenets for MOVE is that visual feedback is extremely important in defining AL criteria. Further, defin-ing active learndefin-ing criteria iteratively enables the user to modify the used characteristics and their weights, exam-ine obtaexam-ined solutions, identify any shortcomings (e.g., by analysing why some nodes where included or excluded or looking at the overall structure of the graph and subgraph) until the desired outcome/solution is reached.
The MOVE UI allows for visual and numerical examina-tion of the obtained soluexamina-tion (both locally and globally), and also shows the process of the optimisation in real-time.
Subgraph Filtering / Highlighting provides a way to fil-ter out and examine only the selected subgraph; as well as to see the subgraph highlighted within the full network con-text.
Utility-based Node Sizing is done by making the node size proportional to its utility. The nodes could be sized based on the utility within either subgraph or graph. This allows to see which nodes have a high global or local utility; and investigate why some nodes were either included or excluded from the subgraph.
Automatic Graph Layout is provided to enhance visi-bility; if a finer refinement is needed Gephi (Bastian et al., 2009) provides a variety of layouts.
Real-time Subgraph Optimisation Visualisation al-lows users to dynamically see which nodes are selected,
[image:5.595.307.541.68.210.2]Optimization Itteration Mean candidates Utility
Figure 4: Subgraph Utility Monitor (see Section 4.6. ‘Nu-merical Optimisation Monitor’).
enabling the user to visually examine the intermediate re-sults of optimisation (assisting with the decision of when to terminate the optimisation process).
Numerical Optimisation Monitor allows users to mon-itor optimisation from a numerical perspective (Figure 4); it is integrated from the watchmaker genetic optimisation framework (Dyer, 2006). In Figure 4, the red line denotes the utility of the best solution at a given iteration; the blue line denotes the mean utility of the solution candidates. Ge-netic optimisation starts with a pool of random subgraphs, so the fitness of a random solution could be seen at itera-tion = 0. We can see the speed at which the ‘best soluitera-tion’ is improved by looking at the utility score with respect to the iteration. Once the optimisation algorithm gets stuck within a local optimum, the subgraph utility line becomes flat, and obtaining a significantly better solution becomes less likely (Safe et al., 2004).
Lastly, the Gephi platform (Bastian et al., 2009) itself also provides a variety of plugins (both visual and network-based) that may provide additional utility.
5.
Case Study: CiteNet
In our case, we wanted to create an annotated corpus of novelty claims and citation spans, replete with citation function, within research papers, in an interconnected net-work so that citation-content based summarisation may be possible. Further studies of citation and research paper phe-nomena may be possible as well.
enabled researchers to cull data from an ever increasing sea of information; this opens the possibility of exploring these phenomena “in the wild”, i.e. big data-based analysis. Un-fortunately, however, to our knowledge there is no richly annotated resource containing this kind of information. The goal of CiteNet is to build a citation-rich corpus (of both cited and citing works), which also includes novelty claims within each work, so that it can be the target of single and multi-document summarisation tasks, both citation and non-citation based, and that spans several disciplines so that generalisations about phenomena can be made.
This means that we need to: (1) maximise the number of citations, so as to increase coverage of different citation functions and paraphrasing; (2) reduce the number of pa-pers annotated, due to time/cost annotating each paper; (3) maximise corpus-internal citations, so citation-based sum-maries are possible; (4) capture networks for different gen-res, so that variation across genres can be studied. However, attempting this by hand is daunting, if not impossible. We can adapt these goals into criteria for AL as follows. The citation-network can be treated asgraph-based char-acteristics, and we have other non-graph-based charac-teristicsfor incorporating annotation costs, and other data, such as textual, occurring within each paper. We can at-tribute two kinds ofutility/costs. The first is forproperties within a subgraph, such as the utility of intra-paper links so that the citing and cited are both within the subgraph. The second is for properties of the graph as a whole, where we know regardless that a citation will take mini-mallytCconstant time for an annotator to annotate. As we know that the act of opening and scanning a paper takes a fixed amount of time based on its length, we can model this as a fixed cost per paper. Though incoming links within the subgraph are desirable, even incoming links from outside the chosen subgraph are still beneficial and should be given some utility.
As can be seen from this example, corpus constructors may have a rough idea of the utility/cost of characteristics, if they can only visualise the data. Consider Figure 2, where the selected nodes are shown in blue. At first, using the de-gree of the (e.g. citation) network may sound promising, but as can be seen in Figure 2a, this in fact maximises on only a small portion of the entire network, which leads to mis-representative data. By adding centrality to the utility score (Figure 2b), we see the results improve, but unfor-tunately we are now ignoring the small cluster, and so the data is still not ideal. By adding modularity (Figure 2c) we can incorporate both, but they are disconnected. Finally, by adding betweenness as well (Figure 2d) we are able to cap-ture all the salient aspects of the citation-network we care about. Figure 3 shows how these characteristics are addi-tive for maximising utility.
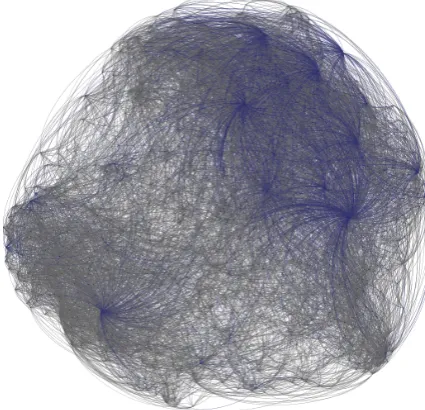
[image:6.595.315.528.72.277.2]The example in Figure 2 is simplified, but illustrates the point of having visual feedback as one works with data. Consider the case for the citation-network, containing 4000 machine translation (MT) papers, shown in Figure 5, where without visualisation little can be seen or decided. When the annotation cost of a single document for CiteNet could run many hours, it is all the more pertinent that appropriate documents be selected.
Figure 5: MT papers from ACL, selected in blue.
6.
Conclusion
In this paper we discussed the merits and shortcomings of AL related to models and corpus construction, and in-troduced our novel method for model-free AL to build phenomena-driven corpora, including the development of a tool, MOVE, and shown its use on a real world scenario of a citation-network based corpus we are developing, CiteNet. The case study introduced in Section 5. is typical of a wide range of phenomena in computational linguistics where en-tities are linked in some form and can be thus represented as a network. For instance, in the cross-document corefer-ence task, systems must identify noun-phrases which core-fer across document boundaries, e.g., (Singh et al., 2011). Our proposed method could be used to find an initial train-ing and test set of such documents, based onobviousnamed entity (NE) coreferences (e.g., those which are long enough to be guaranteed to be unique if they are found in identi-cal forms across documents). The point is not to find all coreferences in advance or we would not need to make the tool, but to insure enough variance in the documents to produce a subnetwork representing the coreferences ad-equately. These coreference links represent the equivalent of the citation links from the case study, but in the cross-document NE task, an additional parameter could be max-imising the number of distinct obvious links across docu-ments. Once a good subnetwork is identified, human anno-tation would be used to verify the system’s links, as well as identify additional cross-document coreference links for training and evaluation. Any data capable of being repre-sented in a network in this manner is thus capable of being used with MOVE.
The source code for the MOVE tool is available for down-load at:https://github.com/move-tool.
7.
Bibliographical References
Baldridge, J. (2004). Active learning and the total cost of annotation. InProceedings of EMNLP.
Bastian, M., Heymann, S., Jacomy, M., et al. (2009). Gephi: an open source software for exploring and ma-nipulating networks.ICWSM, 8:361–362.
Bilgic, M. and Getoor, L. (2009). Link-based active learn-ing. In NIPS Workshop on Analyzing Networks and Learning with Graphs.
Busser, B. and Morante, R. (2005). Designing an ac-tive learning based system for corpus annotation. Proce-samiento del Lenguaje Natural, 35.
Buyko, E., Faessler, E., Wermter, J., and Hahn, U. (2009). Event extraction from trimmed dependency graphs. In
Proceedings of the Workshop on Current Trends in Biomedical Natural Language Processing: Shared Task, pages 19–27. Association for Computational Linguistics. Cohn, D. A., Ghahramani, Z., and Jordan, M. I. (1996). Active learning with statistical models. Journal of Arti-ficial Intelligence Research (JAIR), 4:129–145.
Diestel, R. (2010). Locally finite graphs with ends: A topological approach, II. applications. Discrete Mathe-matics, 310(20):2750–2765.
Dyer, D. W. (2006). Watchmaker frame-work for evolutionary computation. URL: http://watchmaker.uncommons.org.
Easley, D. and Kleinberg, J. (2010). Networks , Crowds , and Markets : Reasoning about a Highly Connected World.
Elkiss, A., Shen, S., Fader, A., States, D., and Radev, D. (2008). Blind men and elephants: what do citation sum-maries tell us about a research article. Journal of the American Society for Information Science and Technol-ogy, 59.
Garfield, E., Sher, I. H., and Torpie, R. J. (1964). The use of citation data in writing the history of science. Institute for Scientific Information, Philadelphia, Pennsylvania. Garfield, E. (1955). Citation Indexes for Science: A New
Dimension in Documentation through Association of Ideas. Science, 122(3159):108–111.
Giles, C. L., Bollacker, K. D., and Lawrence, S. (1998). Citeseer: an automatic citation indexing system. In
INTERNATIONAL CONFERENCE ON DIGITAL LI-BRARIES, pages 89–98. ACM Press.
Hanneke, S. and Xing, E. (2009). Network completion and survey sampling. InProc. 12th Intl. Conf. on Artificial Intelligence and Statistics (AISTATS), volume 5. Harpale, A. (2012). Multi-Task Active Learning. Ph.D.
thesis, Carnegie Mellon University.
Hirsch, J. E. (2005). An index to quantify an individual’s scientific research output. Proceedings of the National Academy of Sciences, 102(46):16569–16572.
Ji, M. (2012). A Variance Minimization Criterion to Ac-tive Learning on Graphs. In International Conference on Artificial Intelligence and Statistics (AISTATS), vol-ume XX.
Kaplan, D., Iida, R., and Tokunaga, T. (2009). Automatic extraction of citation contexts for research paper sum-marization: a coreference-chain based approach. In Pro-ceedings of the 2009 Workshop on Text and Citation
Analysis for Scholarly Digital Libraries, NLPIR4DL ’09, pages 88–95, Stroudsburg, PA, USA. Association for Computational Linguistics.
Karger, D. (1998). Randomization in graph optimization problems: A survey. Optima, 58:1–27.
Kessler, M. M. (1963). Bibliographic coupling between scientific papers. 14(1):1025.
Kuwadekar, A. (2010). Combining Semi-supervised Learning and Relational Resampling for Active Learning in Network Domains. InThe Budgeted Learning Work-shop, ICML.
Leskovec, J. and Faloutsos, C. (2006). Sampling from large graphs.Proceedings of the 12th ACM SIGKDD. Leu, G. and Namatame, A. (2009). Evolving Failure
Re-silience in Scale-Free Networks. Intelligent and Evolu-tionary Systems, pages 49–59.
Macskassy, S. a. (2009). Using graph-based metrics with empirical risk minimization to speed up active learn-ing on networked data. Proceedings of the 15th ACM SIGKDD international conference on Knowledge discov-ery and data mining - KDD ’09, page 597.
Marler, R. and Arora, J. (2004). Survey of multi-objective optimization methods for engineering. Structural and Multidisciplinary Optimization, 26(6):369–395, April. McEnery, T. and Hardie, A. (2011). Corpus Linguistics:
Method, Theory and Practice. Cambridge Textbooks in Linguistics. Cambridge University Press.
McEnery, A., Tanaka, L., and Botley, S. (1995). Corpus Annotation and Reference Resolution Evaluation of the UCREL annotation scheme. (1994):67–74.
Moravcsik, M. J. and Murugesa˜n, P. (1975). Some results on the function and quality of citations. 5:88–91. Nakov, P. I., Schwartz, A. S., and Hearst, M. A. (2004).
Ci-tances: Citation sentences for semantic analysis of bio-science text. InProceedings of the SIGIR’04 workshop on Search and Discovery in Bioinformatics.
Nanba, H., Kando, N., and Okumura, M. (2000). Classifi-cation of research papers using citation links and citation types: Towards automatic review article generation. In
Proceedings of 11th SIG/CR Workshop, pages 117–134. Olsson, F. (2009). A literature survey of active machine
learning in the context of natural language processing. Technical report, Technical report, Swedish Institute of Computer Science.
Qazvinian, V. and Radev, D. R. (2008). Scientific paper summarization using citation summary networks. Radev, D. R., Hovy, E., and McKeown, K. (2002).
Intro-duction to the special issue on summarization.
Rashid, A. M., Albert, I., Cosley, D., Lam, S. K., McNee, S. M., Konstan, J. A., and Riedl, J. (2002). Getting to know you: learning new user preferences in recom-mender systems. InProceedings of the 7th international conference on Intelligent user interfaces, pages 127–134. ACM.
Rubens, N., Kaplan, D., and Sugiyama, M. (2011). Active learning in recommender systems. In P.B. Kantor, et al., editors, Recommender Systems Handbook, pages 735– 767. Springer.
Safe, M., Carballido, J., Ponzoni, I., and Brignole, N. (2004). On stopping criteria for genetic algorithms. In
Advances in Artificial Intelligence–SBIA 2004, pages 405–413. Springer.
Settles, B. (2009). A Software Tool for Biomedical Infor-mation Extraction (And Beyond). pages 326–335. IGI Global.
Shi, L. and Zhao, Y. (2010). Combining link and content for collective active learning. Proceedings of the 19th ACM international, page 1829.
Singh, S., Subramanya, A., Pereira, F., and McCallum, A. (2011). Large-scale cross-document coreference using distributed inference and hierarchical models. In Associ-ation for ComputAssoci-ational Linguistics: Human Language Technologies (ACL HLT).
Small, H. (1973). Co-citation in the scientific literature: A new measure of the relationship between two documents.
JASIS, 24:265–269.
Song, H. and Yao, T. (2010). Active learning based corpus annotation. In IPS-SIGHAN Joint Conference on Chi-nese Language Processing, page 2829.
Spiegel-R¨osing, I. (1977). Science studies: Bibliometric and content analysis. 7:97–113.
Sugiyama, M. and Rubens, N. (2008). A batch ensemble approach to active learning with model selection.Neural Networks, 21(9):1278–1286.
Teufel, S., Siddharthan, A., and Tidhar, D. (2006). Auto-matic classification of citation function. InIn Proceed-ings of EMNLP-06.
Tomanek, K. and Olsson, F. (2009). A Web Survey on the Use of Active learning to support annotation of text data. In Proceedings of the NAACL HLT 2009 Workshop on Active Learning for Natural Language Processing, num-ber June, pages 45–48. Association for Computational Linguistics.
Tomanek, K. and Wermter, J. (2007). An approach to text corpus construction which cuts annotation costs and maintains reusability of annotated data. InProceedings of the 2007 Joint Conference on Empirical Methods in Natural Language Processing and Computational Natu-ral Language Learning, number June, pages 486–495. Tomanek, K. (2010). Resource-aware annotation through
active learning. Ph.D. thesis.
Van Den Berg, E. and Friedlander, M. P. (2008). Prob-ing the pareto frontier for basis pursuit solutions. SIAM Journal on Scientific Computing, 31(2):890–912. Weinstock, M. (1971). Citation indexes. InEncyclopedia
of Library and Inform ation Science, volume 5, pages 16–40. Dekker, New York, NY.
Weise, T. (2009). Global Optimization Algorithms: The-ory and Application.