Coh-Metrix-Esp: A Complexity Analysis Tool for Documents Written in
Spanish
Andre Quispesaravia, Walter Perez, Marco Sobrevilla Cabezudo, Fernando Alva-Manchego
Research Group on Pattern Recognition and Applied Artificial Intelligence (GRPIAA)Pontificia Universidad Cat´olica del Per´u Av. Universitaria 1801, San Miguel, Lima 32, Peru
{andre.quispesaravia, wperez, f.alva}@pucp.pe, [email protected]
Abstract
Text Complexity Analysis is an useful task in Education. For example, it can help teachers select appropriate texts for their students according to their educational level. This task requires the analysis of several text features that people do mostly manually (e.g. syntactic complexity, words variety, etc.). In this paper, we present a tool useful for Complexity Analysis, called Coh-Metrix-Esp. This is the Spanish version of Coh-Metrix and is able to calculate 45 readability indices. We analyse how these indices behave in a corpus of “simple” and “complex” documents, and also use them as features in a complexity binary classifier for texts in Spanish. After some experiments with machine learning algorithms, we got 0.9 F-measure for a corpus that contains tales for kids and adults and 0.82 F-measure for a corpus with texts written for students of Spanish as a foreign language.
Keywords:Complexity Analysis, Readability Assessment Indices, Coh-Metrix, Natural Language Processing
1.
Introduction
Knowledge is transmitted orally, in writing and through media. As such, reading is one of the most useful tools in the learning process, since it is our reading capability the one that let us access all this information (PISA, 2009). Three interrelated components assess the complexity in the reading comprehension process: i)qualitative dimension, where complexity is assessed by the meaning or purpose of the text; ii) quantitative dimension, where indices related to quantitative aspects of the texts (word length, frequency, incidence of grammar structures, etc.) are used to assess complexity; and iii)reader-task, where variables related to the reader, like motivation and knowledge of the task, are considered (Fisher et al., 2012).
Qualitative and reader-task assessments require human readers, professional judgment and experience. However, quantitative assessment can be automated, thereby giving the opportunity to explore linguistic features and analyse how they reflect the complexity of the text.
For quantitative assessment of the complexity of texts writ-ten in Spanish, there exist superficial formulae, like Flesh-Fernandez (Fern´andez Huerta, 1959), that classify texts de-pending on the score given by the formula. The informa-tion produced by this approach is limited and does not de-tect subtle changes related to the coherence and cohesion of the texts, which are factors related to its structure and the mental image formed as a representation of the texts by the reader (Graesser et al., 2004).
In this paper, we focus on the quantitative dimension of text complexity and analyze how readability indices behave in text complexity assessment. We adapted 45 Coh-metrix indices (Section 3.) to Spanish integrating different natu-ral language processing (NLP) resources (Section 3.1.). To validate the indices, we present an analysis of text com-plexity for texts written in Spanish (Section 4.). The corpus used in this analysis is composed of tales for kids (con-sidered as “simple”) and adults (con(con-sidered as “complex”)
(Section 4.1.). We assessed how these indices relate to the complexity characteristics of our corpus and also imple-mented a binary classifier to evaluate the behavior of the indices as complexity features for texts written in Spanish (Section 4.2.).
2.
Related Works: Coh-Metrix
Coh-metrix is a language analysis tool developed in the University of Memphis. It assess texts via cohesion1,
coher-ence relations2 and readability measures. The main
differ-ence between readability formulae and Coh-Metrix is that the former is sensitive to a broad profile of language and cohesion characteristics (Graesser et al., 2004).
Coh-Metrix 3.0 provides 110 indices in its free version. These indices are classified in 11 groups: Descriptives, used to analyze patterns in the texts such as number of para-graphs, words or sylables per word;Text easability princi-pal components scores, which assesses linguistic features in the text such as temporality, narrativity and connectivi-ness; Referential cohesion, which assesses the number of cohesion relations that a human reader could do based on the propositions and sentences of the text; Latent seman-tic analysis, which assesses the similarities of the sentences and paragraphs;Lexical diversity, which measures the type token ratios to deduce high cohesion; Connectives, which counts the incidence of connectives in the text; Situation model, with indices related to the reader’s mental repre-sentation of the text; Syntactic complexity, which syntac-tically analyzes the sentence and assesses the word density; Syntactic pattern density, which assesses the incidence of different types of patterns in the texts; Word Information, which shows the word type density in the text; and
Read-1
Cohesion: gives information about the degree that ideas in the text are explicitly related to each other, facilitating a unified situation model for the reader (Lightman et al., 2006)
2Coherence: the ideas constructed in the mind of the reader
ability, which assesses the text readability with formulae such as Flesch Reading Ease and Flesch-Kincaid Grade Level (Graesser et al., 2005).
For Portuguese, Coh-Metrix-Port was developed to support complexity textual analysis and text simplification (Scarton and Alu´ısio, 2010). This tool is based on Coh-Metrix 2.0 and the authors adapted 40 Coh-Metrix indices related to cohesion, coherence and the difficulty of text comprehen-sion, using the different linguistic levels.
3.
Building Coh-Metrix-Esp
In this section we describe how Coh-Metrix-Esp was devel-oped. First, we outline the resources and tools used in the implementation process, and then we overview the indices that the tool can compute.
3.1.
Tools and resources
We used Freeling (Atserias et al., 2006) for most of our NLP needs. It is an open source library that provides text analysis services for many languages, including Spanish. We used Freeling’stokenizerandsplitter to process plain text into word and sentence objects, and itsmorfological analyzerto detect and tag numbers, dates, multiwords, etc. ItsPoS-taggerwas also used to detect the morphosyntactic category of each word. This tagger has two engines, but we used the one based on HMMs (Brants, 2000) that has an accuracy of 97% (Padr´o and Stanilovsky, 2012). This module helped us detect adjectives, adverbs, determinants, pronouns and conjunctions.
To detect syntactic structures (like nominal phrases and ver-bal phrases), we used Freeling’schunker parser, which pro-duces a shallow parse tree for each sentence. This is a chart parser based on a set of rules. We used Freeling’s default list of rules that detect noun phrases and provide informa-tion about temporality.
Additionally, we elaborated a list of connectives and its categories, merging some online sources. Each connective was tagged as adversative, causal, temporal, logical and/or additive. This list was necessary because Freeling’s tagger doesn’t support this type of labeling.
Finally, we implemented a syllable splitter based on regular expressions and using rules stablished for Spanish by the Real Academia Espa˜nola (Warck, 2005).
3.2.
Adapting and implementing indices
In order to decide which metrics to implement for the tool, we analyzed the indices provided by Coh-Metrix 3.0 and Coh-Metrix-Port. First, we determined, for each metric in the English version, if there was an equivalent for Spanish or if it need to be adapted. Then, for each metric, we ver-ified if it had been implemented in the Portuguese version and checked for the details in its implementation. After that, we determined the tools and external resources that would be required to implement each index in our tool. Af-ter taking all this into account, we adapted 45 Coh-Metrix indices for the Spanish version.
• Descriptive: number of paragraphs,number of sen-tences, number of words, number of sentences per paragraph, words per sentence, syllables per word
andletters per word. A paragraph was defined as sen-tences separated by a hard break. Also, the point and exclamation symbols were considered as sentence sep-arators allowing nesting. We also used the syllable splitter described previously.
• Referential Cohesion:noun overlap,argument over-lap,stem overlap,content word overlapandanaphor overlap. These indices measure the conexions that ex-ist within the text. Each index evaluates a particular type of conexion between adjacent pairs or all pairs of sentences. In each conexion category, counting is done without repetition3. Comparison between each
pair of sentences can be slow, but allowing repetitions speeds up this process.
• Lexical Diversity: type-token ratio of content words andbetween all words. These indices estimate vocab-ulary diversity in the text. In our implementation, con-tent words can be nouns, verbs, adjetives or adverbs.
• Connectives: casual connectives incidence, logical connectives incidence, adversative connectives inci-dence,temporal connectives incidence,additive con-nectives incidence, all connectives incidence. “Inci-dence” is the number of classified units per one thou-sand words. Here we used the list of connectives and its categories described in the previous section.
• Syntactic Complexity:number of modifiers per noun phrase. We considered modifiers as the adjectives within a noun phrase.
• Syntactic Pattern Density:noun phrase density, ver-bal phrase densityandnegations. The rationale here is that the relative density of each of these could affect how difficult it is to process a text, particularly with respect to other features in a text. Negations were de-termined by the use of Spanish negation words, like
No.
• Word information: noun incidence,verb incidence, adjective incidence,adverb incidence, pronoun inci-denceandall variations for pronouns (first person sin-gular, plural, etc). Freeling’s tagset supports all of them.
• Readability: Flesch Grade Level. We used the adapted version for Spanish of this index called Flesh-Fernandez Huertas:
F lesh= 206.84−60∗meanSyllabelsP erW ord−
102∗meanW ordP erSentence
For a detailed explanation of the rationale behind each of these metrics, we refer the reader to the Coh-Metrix docu-mentation4. Coh-Metrix-Esp was implemented using Java because of it was easier to integrate with Freeling. We also used the statistics library Common-Math (Andersen et al., 2011).
3A variant could be explored, because the index can also be
interpreted as a relation each time a word in a overlap occurs
4
4.
Complexity Assesment of Texts in Spanish
In order to validate the correctness of the values calculated by the implemented tool, we gathered a corpus of “simple” and “complex” texts and analyzed the indices’ values on them. Then, we decided to test if the indices could also be used as features for classifiers that could automatically categorize a text according to its complexity level. This section describes both application tests.4.1.
Analyzing the complexity of texts in a
corpus
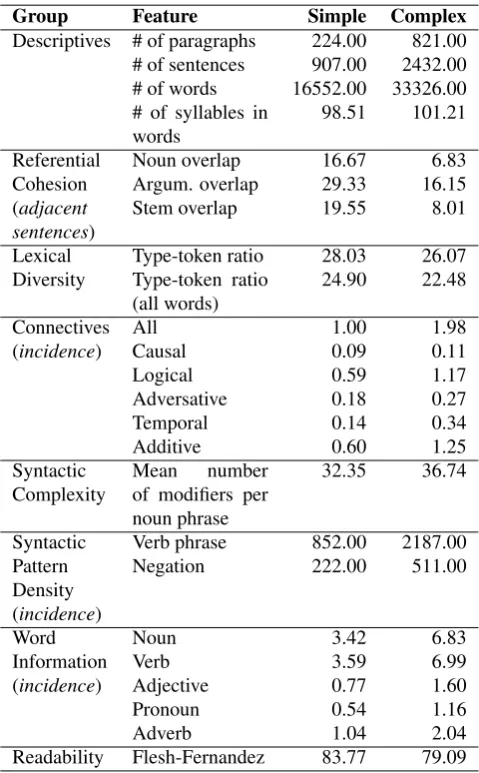
We used a corpus composed of 100 texts in Spanish clas-sified as either simple or complex (50 texts for each cate-gory). Our “simple” texts are mainly children’s fables while the “complex” ones are stories for adults. Table 1 shows the average values of some indices, for each category of texts in the corpus.
Table 1: Corpus analysis with Coh-Metrix-Esp indices
Group Feature Simple Complex
Descriptives # of paragraphs 224.00 821.00 # of sentences 907.00 2432.00 # of words 16552.00 33326.00 # of syllables in
words
98.51 101.21
Referential Noun overlap 16.67 6.83
Cohesion Argum. overlap 29.33 16.15
(adjacent sentences)
Stem overlap 19.55 8.01
Lexical Type-token ratio 28.03 26.07 Diversity Type-token ratio
(all words)
24.90 22.48
Connectives All 1.00 1.98
(incidence) Causal 0.09 0.11
Logical 0.59 1.17
Syntactic Verb phrase 852.00 2187.00 Pattern
Density (incidence)
Negation 222.00 511.00
Word Noun 3.42 6.83
Information Verb 3.59 6.99
(incidence) Adjective 0.77 1.60
Pronoun 0.54 1.16
Adverb 1.04 2.04
Readability Flesh-Fernandez 83.77 79.09
As expected, indices that do basic counting (descriptive and word information) have higher values for the complex texts, because these are generally longer than the simple ones. For referencial cohesion, there is a higher overlap in con-tent words for the simple texts. That may be because, in simpler texts, the writer tends to repeat the nouns between
adjacent sentences to make it easier to understand. Also, connectives incidence measures in complex texts are higher for every category. Looking at the syntactic pattern density, we see that the verb phrase incidence is much higher in the case of complex sentences. This is also expected because, according to the Coh-Metrix documentation,“if a text has a higher verb phrase incidence, it is more likely to be infor-mationally dense with complex syntax”. Finally, the Flesh-Fernandez index gives a standard measure for readability of the text, with a higher score indicating easier reading. As such, results show a higher value for the simple texts.
4.2.
Building automatic complexity classifiers
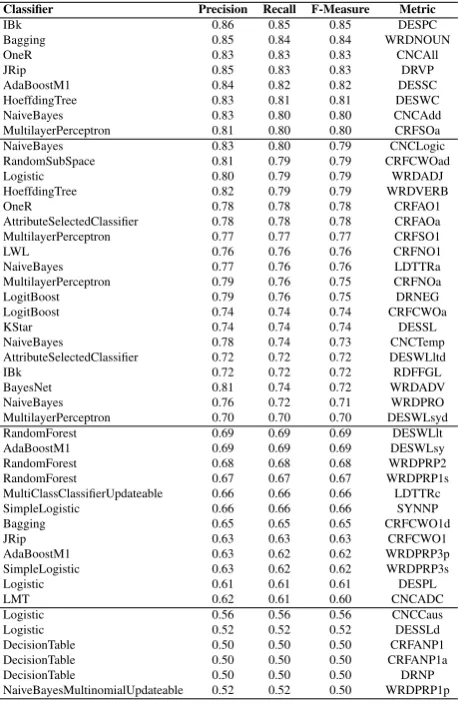
We wanted to test if Coh-Metrix-Esp indices could be used to build a tool that could automatically assses the readabil-ity of a text and determine its complexreadabil-ity level according to certain predefined categories. For that reason, we imple-mented a classifier that uses the calcutated indices as fea-tures for its predictions.In our first experiment, we tested the metrics individually to analyze how well each one helps in the complexity classifi-cation task. The corpus used for training and testing was the one described in Section 4.1., which has two classes: sim-ple and comsim-plex. We trained and tested several classifiers provided by WEKA(Witten and Frank, 2005) with 10-fold cross-validation. Table 2 presents the classifier with the best result for each individual metric, sorted by F-Measure. Results show that Descriptives and Connectives metrics are the ones with better performance values when used individ-ually, with 8 metrics getting an F-Measure of at least 0.8. Also, almost half of all metrics obtained an F-measure be-tween 0.7 and 0.79, and most of them are in Referential Cohesion and Lexical Diversity groups. This can be ex-plained because there are no significant differences in aver-age between the two classes (simple and complex) as seen in Table 1. Moreover, the worst results were obtained using metrics involving first person pronouns and anaphors. Fi-nally, the classification models that most frequently get the best results were NaiveBayes (5 metrics) and MultiLayer-Perceptron (4 metrics).
For our second experiment, we evaluated all metrics to-gether as features for text complexity classification. Once again, we tested several Machine Learning algorithms pro-vided by WEKA on the corpus cited in Subsection 4.1.. The OneR and ZeroR algorithms were used as baselines. Results of the top three algorithms are presented in Table 3. As it can be seen, the SMO5algorithm obtained the best
re-sults (0.9 F-measure). Even though the rere-sults of the SMO algorithm outperformed the baselines, we should highlight that the OneR algorithm6 got a good result as well (0.8
F-measure). This may be due to two reasons: this binary text classification task on the simple/complex corpus is too easy to be performed, or the implemented indices provide signif-icant information about texts, making the classification task fairly easy.
5
Sequential Minimal Optimization for support vector ma-chines
6
Table 2: Best classifiers using only one metric at time sorted by F-Measure
Classifier Precision Recall F-Measure Metric
IBk 0.86 0.85 0.85 DESPC
Bagging 0.85 0.84 0.84 WRDNOUN
OneR 0.83 0.83 0.83 CNCAll
JRip 0.85 0.83 0.83 DRVP
AdaBoostM1 0.84 0.82 0.82 DESSC HoeffdingTree 0.83 0.81 0.81 DESWC NaiveBayes 0.83 0.80 0.80 CNCAdd MultilayerPerceptron 0.81 0.80 0.80 CRFSOa NaiveBayes 0.83 0.80 0.79 CNCLogic RandomSubSpace 0.81 0.79 0.79 CRFCWOad
Logistic 0.80 0.79 0.79 WRDADJ
HoeffdingTree 0.82 0.79 0.79 WRDVERB
OneR 0.78 0.78 0.78 CRFAO1
AttributeSelectedClassifier 0.78 0.78 0.78 CRFAOa MultilayerPerceptron 0.77 0.77 0.77 CRFSO1
LWL 0.76 0.76 0.76 CRFNO1
NaiveBayes 0.77 0.76 0.76 LDTTRa MultilayerPerceptron 0.79 0.76 0.75 CRFNOa LogitBoost 0.79 0.76 0.75 DRNEG LogitBoost 0.74 0.74 0.74 CRFCWOa
KStar 0.74 0.74 0.74 DESSL
NaiveBayes 0.78 0.74 0.73 CNCTemp AttributeSelectedClassifier 0.72 0.72 0.72 DESWLltd
IBk 0.72 0.72 0.72 RDFFGL
BayesNet 0.81 0.74 0.72 WRDADV
NaiveBayes 0.76 0.72 0.71 WRDPRO MultilayerPerceptron 0.70 0.70 0.70 DESWLsyd RandomForest 0.69 0.69 0.69 DESWLlt AdaBoostM1 0.69 0.69 0.69 DESWLsy RandomForest 0.68 0.68 0.68 WRDPRP2 RandomForest 0.67 0.67 0.67 WRDPRP1s MultiClassClassifierUpdateable 0.66 0.66 0.66 LDTTRc SimpleLogistic 0.66 0.66 0.66 SYNNP
Bagging 0.65 0.65 0.65 CRFCWO1d
JRip 0.63 0.63 0.63 CRFCWO1
AdaBoostM1 0.63 0.62 0.62 WRDPRP3p SimpleLogistic 0.63 0.62 0.62 WRDPRP3s
Logistic 0.61 0.61 0.61 DESPL
LMT 0.62 0.61 0.60 CNCADC
Logistic 0.56 0.56 0.56 CNCCaus
Logistic 0.52 0.52 0.52 DESSLd
DecisionTable 0.50 0.50 0.50 CRFANP1 DecisionTable 0.50 0.50 0.50 CRFANP1a DecisionTable 0.50 0.50 0.50 DRNP NaiveBayesMultinomialUpdateable 0.52 0.52 0.50 WRDPRP1p
On the other hand,the ZeroR algorithm7got 0.33 F-measure
(too low in comparison with the SMO algorithm). This re-sult was obtained because text distribution in the training corpus was balanced (considering that the ZeroR algorithm uses the class with the higher number of instances as refer-ence).
Table 3: Classifiers with the best results + Simple/Complex corpus
Algorithm Precision Recall F-Measure
SMO 0.9 0.9 0.9
SimpleLogistic 0.88 0.88 0.88
LMT 0.88 0.88 0.88
OneR 0.82 0.8 0.8
ZeroR 0.25 0.5 0.33
For our last experiment, we collected 31 texts written for students of Spanish as a foreign language. Of those texts, 12 were considered as “basic”, 18 as “intermediate” and 3 as “advanced”. We performed a similar experiment as the previous one. The results of this experiment are presented in Table 4.
7This method makes choices using only the class with the
higher number of instances as reference.
Table 4: Classifiers with the best results + Ba-sic/Intermediate/Advanced corpus
Algorithm Precision Recall F-Measure FilteredClassifier 0.72 0.77 0.73
AdaBoostM1 0.7 0.74 0.69
DecisionTable 0.7 0.74 0.69
OneR 0.69 0.71 0.68
ZeroR 0.27 0.52 0.35
In general, the performance of the algorithms decreased when a new class was added and the best result was ob-tained by the FilteredClassifier algorithm (0.73 F-measure). However, the OneR algorithm8got a high F-measure (near
to FilteredClassifier algorithm). One disvantage of this ex-periment was the unbalancing of classes (3 for advanced class), which significantly affected the classifiers’ perfor-mance.
To solve this unbalancing problem, we performed the ex-periment a second time, with just the texts of the first two categories. The results are presented in Table 5. In com-parison with the previous experiment (using three classes), the performance of the classifiers was improved. The Lo-gistic Regression algorithm obtained the best result (0.82 F-measure), outperforming the baselines (OneR and ZeroR algorithms) one more time.
Table 5: Classifiers with the best results + Ba-sic/Intermediate corpus
Algorithm Precision Recall F-Measure
Logistic 0.84 0.82 0.82 MultiClassClassifier 0.84 0.82 0.82 MultiClassClassifierUpdateable 0.8 0.79 0.79 OneR 0.71 0.71 0.71 ZeroR 0.33 0.57 0.42
5.
Conclusions and Future Work
This paper provides basic work on complexity analysis of texts in Spanish. We adapted 45 indices of Coh-Metrix, a system that can help estimate the difficulty of written texts. These indices proved to be useful and significant when comparing texts considered as simple or complex. In addi-tion, they can be used to implement automatic complexity classifiers using standard machine learning algorithms. As future work, more Coh-Metrix indices could be adapted. Of special interest are the text easability component scores(likenarrativity,syntactic simplicityandword con-creteness) which should provide a more complete picture of text ease (and difficulty). Furthermore, more studies should be performed on how to use the indices as features for automatic complexity classifiers. For example, we could carry out a feature selection process to determine which in-dices provide more information and are more useful for the classification task. Finally, it is important to mention that both training/test corpora and Coh-Metrix-Esp are publicly available as open source resources9.
8
We used the ”Noun Incidence” indice in this experiment.
9
6.
Bibliographical References
Andersen, M., Barker, B., Chou, A., Diggory, M., Donkin, R., OBrien, T., Maisonobe, L., Pietschmann, J., Pour-baix, D., Steitz, P., et al. (2011). Commons Math: The Apache Commons Mathematics Library. online. Techni-cal report, accessed 28/9.
Atserias, J., Casas, B., Comelles, E., Gonz´alez, M., Padr´o, L., and Padr´o, M. (2006). FreeLing 1.3: Syntactic and semantic services in an open-source NLP library. In Pro-ceedings of LREC, volume 6, pages 48–55.
Brants, T. (2000). TnT: a statistical part-of-speech tagger. InProceedings of the sixth conference on Applied natu-ral language processing, pages 224–231. Association for Computational Linguistics.
Fern´andez Huerta, J. (1959). Medidas sencillas de lectura-bilidad. Consigna, 214:29–32.
Fisher, D., Frey, N., and Lapp, D. (2012).Text Complexity: Raising Rigor in Reading. International Reading Asso-ciation.
Graesser, A. C., McNamara, D. S., Louwerse, M. M., and Cai, Z. (2004). Coh-Metrix: Analysis of text on cohe-sion and language. Behavior Research Methods, Instru-ments, & Computers, 36(2):193–202.
Graesser, A. C., Petschonek, S., Lenderking, W., and Re-vicki, D. (2005). Automated systems that analyze text and discourse: QUAID, Coh-Metrix, and AutoTutor. Ad-vancing health outcomes research methods and clinical applications, McLean, VA: Degnon Associates.
Lightman, E. J., McCarthy, P. M., Dufty, D. F., and Mc-Namara, D. S. (2006). Using Coh-Metrix to assess the structural organization of narratives. InSociety for Text and Discourse conference, Minneapolis, MN.
Padr´o, L. and Stanilovsky, E. (2012). Freeling 3.0: To-wards wider multilinguality. InProceedings of the Lan-guage Resources and Evaluation Conference (LREC 2012), Istanbul, Turkey, May. ELRA.
PISA. (2009). Student Preformance in reading, mathemat-ics and science, 2009. Technical report, Organization for Economic Co-operation and Development.
Scarton, C. E. and Alu´ısio, S. M. (2010). An´alise da Intel-igibilidade de textos via ferramentas de Processamento de L´ıngua Natural: adaptando as m´etricas do Coh-Metrix para o Portuguˆes. Linguam´atica, 2(1):45–61.
Warck, J. A. (2005). Segmentaci´on de palabras en s´ılabas. Tesis de Licenciatura.