P R O C E E D I N G S
Open Access
Testing optimally weighted combination of
variants for hypertension
Xingwang Zhao
2†, Qiuying Sha
1†, Shuanglin Zhang
1, Xuexia Wang
2*From
Genetic Analysis Workshop 18
Stevenson, WA, USA. 13-17 October 2012
Abstract
Testing rare variants directly is possible with next-generation sequencing technology. In this article, we propose a sliding-window-based optimal-weighted approach to test for the effects of both rare and common variants across the whole genome. We measured the genetic association between a disease and a combination of variants of a single-nucleotide polymorphism window using the newly developed tests TOW and VW-TOW and performed a sliding-window technique to detect disease-susceptible windows. By applying the new approach to unrelated individuals of Genetic Analysis Workshop 18 on replicate 1 chromosome 3, we detected 3 highly susceptible windows across chromosome 3 for diastolic blood pressure and identified 10 of 48,176 windows as the most promising for both diastolic and systolic blood pressure. Seven of 9 top variants influencing diastolic blood pressure and 8 of 9 top variants influencing systolic blood pressure were found in or close to our top 10 windows.
Background
Hypertension is a common chronic destructive disease with unknown complex etiology [1]. More than1billion people worldwide have hypertension, defined as blood pressure (BP)≥140 mm Hg systolic (SBP) or≥90 mm Hg diastolic (DBP) [2], which is a major risk factor for stroke, myocardial infarction, heart failure, and a cause of chronic kidney disease [3-5]. Both genetic and environ-mental bases are likely to contribute to this disease. Ehret et al. conducted a large-scale genome-wide association study of hypertension in 2011 and identified 10 novel loci related to BP physiology [6]. Although numerous com-mon genetic variants with small effects on BP have been identified [6-8], the identified variants account for only a small fraction of disease heritability [9]. One potential source of missing heritability is the contribution of rare variants. Recently, next-generation sequencing technolo-gyhas enabled the sequencing of the whole genome of large groups of individuals,which makes directly testing rare variants feasible. The Genetic Analysis Workshop 18
(GAW18) data, which consists of a whole genome sequencingdata set, is a large-scale pedigree-based sam-ple with 959 individuals, 464 directly sequenced and the rest imputed.
Several statistical methods have been proposed to detect associations of rare variants, including the com-bined multivariate and collapsing (CMC) method [10] and the weighted sum statistic (WSS) [11]. We have pro-posed a novel test for measuringthe effect of an optimally weighted combination of variants (TOW) [12]. In addi-tion, based on the TOW, we proposed a variable weight-TOW (VW-weight-TOW) aiming to test effects of both rare and common variants. Both TOW and VW-TOW are applic-able to quantitative and qualitative traits, allow covari-ates, and are robust to directions of effects of causal variants.
In this article, we report a novel whole genome sliding window approach to detect genetic association between a trait and single-nucleotide polymorphism (SNP) regions across the entire genome. This approach integrates TOW and VW-TOW with the concept of sliding window [13]. Applied to the GAW18 replication 1, chromosome 3 data set, our approach yielded results consistent with the top genes influencing simulated SBP and DBP, which were generated from the GAW18 simulation model.
* Correspondence: [email protected]
†Contributed equally 2
Joseph J.Zilber School of Public Health,University of Wisconsin, P.O. Box 413, Milwaukee, WI 53201, USA
Full list of author information is available at the end of the article
Methods
Consider a sample ofnindividuals. Each individual has been genotyped at Mvariants in a genomic region. Denote yi as the quantitative trait value. Denote
Xi= (xi1, ...,xiM)Tas the genotypic score of the ith
indi-vidual, where xim∈ {0, 1, 2} is the number of minor
alleles that theithindividual has at themth variant. Suppose we havepcovariates. Let(zi1, ...,zip)Tdenote
covariates of theithindividual. We adjust both trait value
yiand genotypic scoreximfor the covariates by applying
linear regressions. That is,yi=α0+α1zi1+ ... +αpzip+i
andxim=α0m+α1mzi1+ ... +αpmzip+τim.
Let ˜yi and x˜im denote the residuals of yi and xim,
respectively. Denote X˜i= (x˜i1,. . .,x˜iM)as the residuals
of the genotypic score of theithindividual.
Using the generalized linear model (GLM) to model the relationship between trait values and genotypes is equiva-lent to modeling the relationship between the residuals of trait values and the residuals of genotypes through GLM (1), whereg()is a monotone“link”function.
g(E(y˜i| ˜Xi)) =β0+β1x˜i1+· · ·+βMx˜iM (1)
Under the GLM, the score test statistic to test the null hypothesis H0:β= 0 is given by
statistic Sasymptotically follows a chi-square distribu-tion with k=rank(V)degrees of freedom (DF). For rare variants, however, the score test may lose power as a result of the sparse data and a large DFk. In rare variants association studies, to test for the effect of the
weighted combination of variants, xi= M
Because rare variants are essentially independent, we have
Then, the score test statistic is approximately equal to
S0(w1,· · ·,wM) =n
We propose the new test statistic TOW to test the effect of the optimally weighted combination of variants
M
The optimal weightwomwill put big weights to the variants that have strong associations with the traits of interest and adjust the direction of the association. Also,womwill put big weights to rare variants. TOW targets rare variants and will lose power when testing for the effect of both rare and common variants. For testing the effects of both rare and common variants, we propose a new statistic, VW-TOW. We divide variants into rare (minor allele frequency [MAF] <the rare variant threshold [RVT]) and common (MAF > RVT), and apply TOW to the rare and common variants separately.
Define the test statistic of VW-TOW as
TVW−T= min0≤λ≤1pλ, where pλ is the p value of Tλ.
Tr,TrandTcdenote the test statistics of TOW for rare and
common variants, respectively. Here, we evaluate the minimization by dividing the interval [0, 1] intoK subin-tervals of equal-length. Letλk=k/K fork= 0, 1,· · ·,K.
Then,min0≤λ≤1pλ= min0≤k≤Kpλk.
We use permutation tests to evaluatepvalues of both
TTandTVW−T. To evaluate thepvalue of the testTT, let
TT0denote the value of the test statistic based on the ori-ginal data set. For each permutation, we randomly resample from residuals of trait values and denote the value of the test statistic based on the permuted data setby TTper. We perform the permutation procedure many times. Then thepvalue of the test is the propor-tion of the number of permutapropor-tions withTTper>T0T. We permuteBtimes of permutations to evaluate the pvalue of TVW−T. Let Tr(b)and Tc(b)denote the values of Tr and
I()is the indicator function.
entire chromosome 3, we propose a sliding-window approach [13]. To use sliding windows, we divide all SNPs into contiguous windows and apply TOW and VW-TOW in each window. Suppose that we use windows with a dow size of S, then, all the SNPs can be divided into win-dows: 1 to S, S+1 to 2S, 2S+1 to 3S, and so on.
To analyze the data set of GAW18 replication 1, chro-mosome 3 for unrelated individuals, we set the window size as 20. First we performed quality control tests for the genotype data with the PLINK toolset. We used 10,000,000 permutations to evaluate the empirical pvalues of TOW for DBP and SBP data, and 100,000 permutations to evaluate the empiricalpvalues of VW-TOW for DBP and SBP data. Becausethe sample of unre-lated individuals in GAW18 is relatively small, it is not so reasonable to claim the significance either by the false-discovery rate or by the Bonferroni-corrected threshold. Therefore, we recommend the top 10 most promising windows with the smallestpvalues for follow-up studies.
Results
We applied TOW and VW-TOW incorporating the sliding window approaches to analyze the hypertension unrelated individuals’data set of GAW18. To facilitate comparisons among GAW18 contributions, we analyzed only replicate 1 on chromosome 3. To evaluate type I error rates of TOW and VW-TOW, we used all 200 replicates of simulated phenotype data. There are 157 unrelated individuals in the GAW18 pedigree-based sample. Among the 157 individuals, 142 have observa-tions for SBP, DBP, and other demographic/clinical vari-ables at exam 1. Our analysis was based on the 142 individuals and their genotypes, quantitative trait SBP, DBP, and other characteristicsat exam 1.
The total genotyping rate in the 142 individuals is 0.9997. We did not find any duplicated samples or
sample contamination. No individual was filtered out from the multidimensional scaling (MDS) analysis. Of the 1,215,399 SNPs on chromosome 3, we removed 251,892 completely missing SNPs and retained 963,507 SNPs for final analysis. Because SBP and DBP varied by sex and increased with age, age and sex were considered as covariates in this study.
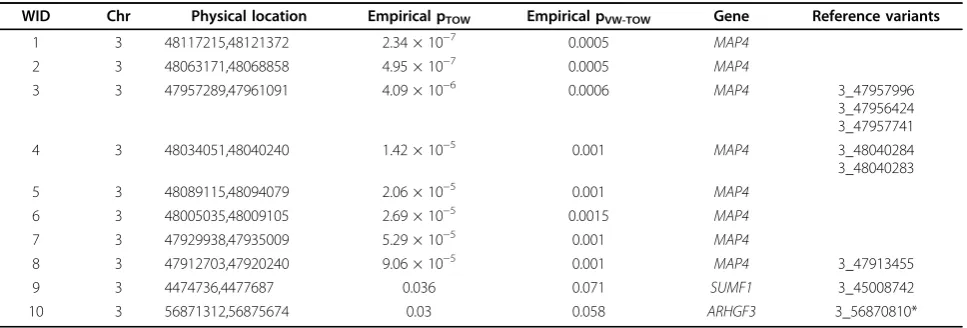
We listed the top 10 most promising windows out of 48,176 windows across the entire chromosome 3. The top 8 windows all reside in gene MAP4, which is the most susceptible gene on chromosome 3 for hyperten-sion. Seven of 9 top variants influencing DBP and 8 of 9 top variants influencing SBP on chromosome 3 were found in or close to our top windows. Tables 1 and 2 show the top 10 most promising windows by TOW that are associated with DBP and SBP, respectively. Thep values of TOW in the top 3 windows of Table 1 are very small. SNP 3_47957996, 3_ 47956424, and 3_47957741 are the third, fourth, and ninth variants in Table 2 of the GAW18 answer sheet. They all fell into our third window in Table 1 and the first window in Table 2.
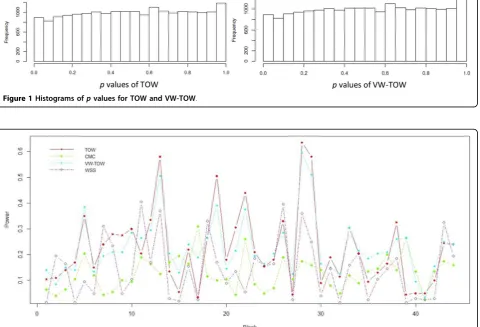
To evaluate the type I error rates of the proposed slid-ing window approach, we chose 100 blocks (20 variants in each block) from chromosome 3 that are far from causal variants. In each block, we applied TOW and VW-TOW to each of the 200 replicates to test associa-tion between genotypes and the trait DBP. We obtained 1 p value for each replicate and each block. Figure 1 shows the histograms of TOW and VW-TOW. The his-tograms indicate that the type I error rates of both TOW and VW-TOW are under control.
Discussion
In this article, we proposed a sliding-window-based opti-mal weighted approach to test for the effects of both rare and common variants across the whole genome. In
Table 1 Top 10 most promising windows associated with DBP
WID Chr Physical location Empirical pTOW Empirical pVW-TOW Gene Reference variants
1 3 48117215,48121372 2.34 × 10⁻⁷ 0.0005 MAP4
2 3 48063171,48068858 4.95 × 10⁻⁷ 0.0005 MAP4
3 3 47957289,47961091 4.09 × 10⁻⁶ 0.0006 MAP4 3_47957996
3_47956424 3_47957741
4 3 48034051,48040240 1.42 × 10⁻⁵ 0.001 MAP4 3_48040284
3_48040283
5 3 48089115,48094079 2.06 × 10⁻⁵ 0.001 MAP4
6 3 48005035,48009105 2.69 × 10⁻⁵ 0.0015 MAP4
7 3 47929938,47935009 5.29 × 10⁻⁵ 0.001 MAP4
8 3 47912703,47920240 9.06 × 10⁻⁵ 0.001 MAP4 3_47913455
9 3 4474736,4477687 0.036 0.071 SUMF1 3_45008742
10 3 56871312,56875674 0.03 0.058 ARHGF3 3_56870810*
Chr, Chromosome;empirical pTOW,pvalue of TOW;empirical pVW-TOW,pvalue of VW-TOW;reference variants, top 55 variants influencing SBP and DBP in Table 2 of the answers of GAW18;WID, window ID.
each window, our recently developed TOW and VW-TOW were applied to test genetic association between a disease and a combination of variants. Then, we applied the method to unrelated individuals of GAW18 on
replicate 1, chromosome 3. We detected 3 susceptible windows across chromosome 3 for DBP and identified 10 out of 48,176 windows as the most promising win-dows for DBP and SBP. Becausethis is a simulated Table 2 Top 10 most promising windows associated with SBP
WID Chr Physical location Empirical pTOW Empirical pVW-TOW Gene Reference variants
1 3 47957289,47961091 0.005 0.004 MAP4 3_47957996
3_47956424 3_47957741
2 3 48034051,48040240 0.003 0.007 MAP4
3 3 47990787,47999337 0.01 0.013 MAP4
4 3 48040283,48046708 0.02 0.01 MAP4 3_48040284
3_48040283
5 3 47912703,47920240 0.03 0.017 MAP4 3_47913455
6 3 48121395,48126740 0.015 0.032 MAP4
7 3 47929938,47935009 0.025 0.04 MAP4
8 3 48063171,48068858 0.015 0.01 MAP4
9 3 58104877,58108614 0.01 0.031 FLNB 3_58109162
10 3 15664089,15667215 0.039 0.011 BTD 3_15686693
Chr, Chromosome;empirical pTOW,pvalue of TOW;empirical pVW-TOW,pvalue of VW-TOW;reference variants, top 55 variants influencing SBP and DBP in Table 2 of the answers of GAW18;WID, window ID.
Figure 1Histograms ofpvalues for TOW and VW-TOW.
dataset, it is possible that the other genes identified were not listed in the top 10 windows but are actually related to SBP or DBP.
In this study, we use each window of size 20 across the entire chromosome 3. How to choose an appropriate window size is a critical question. We evaluated the effect of window size by running window sizes at 30, 40, and 50, respectively. However, the power of TOW was not increased when using a larger window size. Although the power of VW-TOW was slightly increased when using a larger window size, no window can pass the entire chromosome 3 Bonferroni-corrected threshold.
TOW and VW-TOW can be robust to population stratification by adjusting the first K principalcompo-nents (PCs) of genotypes at genomic markers as covari-ates when calculating the residuals of trait and of genotype matrix. In this GAW18 data analysis, we did not adjust for PCsbecausewe believed that population stratification was not severe in this data based on our MDS analysis.
To further assess our new approach, we compared the power of TOW, VW-TOW, CMC, and WSS to detect association between gene MAP4and DBP. The MAP4 was split into 44 windows (blocks) with 20 variants in each window. In each window, we calculated the power of each method based on 200 replicates. The power comparisons based on phenotype measurement DBP are given in Figure 2. This figure shows that in most of the windows, TOW is the most powerful test; VW-TOW is the second most powerful test.
Competing interests
The authors declare that they have no competing interests.
Authors’contributions
XW designed the overall study. XZ and XW conducted statistical analysis. XZ, QS, and SZ drafted the manuscript. All authors read and approved the final manuscript.
Acknowledgements
We thank Dr. Claire L. Simpson (funded by the Intramural Research Program of the National Human Genome Research Institute, National Institutes of Health) for helpful PLINK format GAW18 genotype data. QS and SZ were supported by the National Human Genome Research Institute of the National Institutes of Health under Award Number R03HG006155. The content is solely the responsibility of the authors and does not necessarily represent the official views of the National Institutes of Health.
The GAW18 whole genome sequence data were provided by the T2D-GENES Consortium, which is supported by NIH grants U01 DK085524, U01 DK085584, U01 DK085501, U01 DK085526, and U01 DK085545. The other genetic and phenotypic data for GAW18 were provided by the San Antonio Family Heart Study and San Antonio Family Diabetes/Gallbladder Study, which are supported by NIH grants P01 HL045222, R01 DK047482, and R01 DK053889. The Genetic Analysis Workshop is supported by NIH grant R01 GM031575.
This article has been published as part ofBMC ProceedingsVolume 8 Supplement 1, 2014: Genetic Analysis Workshop 18. The full contents of the supplement are available online at http://www.biomedcentral.com/bmcproc/
supplements/8/S1. Publication charges for this supplement were funded by the Texas Biomedical Research Institute.
Authors’details
1
Department of Mathematical Sciences, Michigan Technological University, 1400 Townsend Drive, Houghton, MI 49931, USA.2Joseph J.Zilber School of Public Health,University of Wisconsin, P.O. Box 413, Milwaukee, WI 53201, USA.
Published: 17 June 2014
References
1. Beevers G, Lip GYH, O’Brien E:ABC of Hypertension.London,BMJ Books
2007.
2. Kearney PM, Whelton M, Reynolds K, Muntner P, Whelton PK, He J:Global burden of hypertension: analysis of worldwide data.Lancet2005,
365(9455):217-223.
3. World Health Organization:Global Health Risks: Mortality and Burden of Disease Attributable to Selected Major Risks.Geneva, WHO Press; 2009. 4. Lewington S, Clarke R, Qizilbash N, Peto R, Collins R, Prospective Studies
Collaboration:Age-specific relevance of usual blood pressure to vascular mortality: a meta-analysis of individual data for one million adults in 61 prospective studies.Lancet2002,360:1903-1913.
5. Singer DR, Kite A:Management of hypertension in peripheral arterial disease: does the choice of drugs matter?Eur J Vasc Endovasc Surg2008,
35(6):701-708.
6. International Consortium for Blood Pressure Genome-Wide Association Studies, Ehret GB, Munroe PB, Rice KM, Bochud M, Johnson AD, Chasman DI, Smith AV, Tobin MD,et al:Genetic variants in novel pathways influences blood pressure and cardiovascular disease risk. Nature2011,478:103-109.
7. Newton-Cheh C, Johnson T, Gateva V, Tobin MD, Bochud M, Coin L, Najjar SS, Zhao JH, Heath SC, Eyheramendy S,et al:Genome-wide association study identifies eight loci associated with blood pressure. Nat Genet2009, ,41:666-676.
8. Levy D, Ehret GB, Rice K, Verwoert GC, Launer LJ, Dehghan A, Glazer NL, Morrison AC, Johnson AD, Aspelund T,et al:Genome-wide association study of blood pressure and hypertension.Nat Genet2009,41:677-687. 9. McCarthy MI, Abecasis GR, Cardon LR, Goldstein DB, Little J, Ioannidis JP,
Hirschhorn JN:Genome-wide association studies for complex traits: consensus, uncertainty and challenges.Nat Rev Genet2008,9:356-369. 10. Li B, Leal SM:Methods for detecting associations with rare variants for
common diseases: application to analysis of sequence data.Am J Hum Genet2008,83:311-321.
11. Madsen BE, Browning SR:A group-wise association test for rare mutations using a weighted sum statistic.PLoS Genet2009,5:e1000384. 12. Sha Q, Wang X, Wang XL, Zhang SL:Detecting association of rare and
common variants by testing an optimally weighted combination of variants.Genet Epidemiol2012,36:561-571.
13. Yang H, Lin C, Fann C:A sliding-window weighted linkage disequilibrium test.Genet Epidemiol2006,30:531-545.
doi:10.1186/1753-6561-8-S1-S59