R E S E A R C H A R T I C L E
Open Access
Prediction of maternal quality of life on preterm
birth and low birthweight: a longitudinal study
Panchalli Wang
1, Shwu-Ru Liou
2and Ching-Yu Cheng
2*Abstract
Background:Preterm birth is a significant cause of newborn morbidity and mortality and strains society’s healthcare resources due to its long-term effects on the health of the newborn. Prenatal maternal quality of life (QoL) may be related to the occurrence of preterm birth and low birthweight infants. Few studies, however, have investigated maternal QoL, especially throughout the continuum of pregnancy and the immediate postpartum period. Therefore, the purposes of this longitudinal study were to measure the levels of QoL during and
immediately after pregnancy in women with uncomplicated pregnancies, investigate the relationships between the dimensions of QoL, and determine whether prenatal QoL can predict preterm birth and low birthweight.
Methods:Using convenience sampling in one hospital in Taiwan, we recruited 198 pregnant women without pregnancy complications after 24 gestational weeks and followed up monthly until one-month postpartum. The Duke Health Profile was used to measure QoL. Data were analyzed using descriptive statistics, the Mann–WhitneyU test, the Kruskal-Wallis test, generalized estimation equations, Pearson correlations, and hierarchical logistic
regression.
Results:Pregnant women did not perceive that they had a high level of QoL. Women at late pregnancy experienced a significant decrease in their level of physical and general health. After childbirth, although the mothers had better physical health, they had poorer social health. Poor QoL at late pregnancy predicted preterm birth. Employment, parity, educational level, and happiness about pregnancy were related to prenatal maternal QoL; employment was a factor related to postpartum maternal QoL.
Conclusions:Early assessment of QoL, including its dimensions, of pregnant women may help us to understand women’s health status. Based on this understanding, healthcare professionals can develop interventions to promote pregnant women’s QoL and to lessen the occurrence of preterm birth and low birthweight infants. Further, an emphasis on the positive aspects of pregnancy may increase maternal QoL.
Keywords:Quality of life, Preterm birth, Low birthweight, Pregnancy, Postpartum
Background
It is well known that preterm birth is a significant cause of newborn death. Moreover, the costs of hospitalization and treatments for a premature birth (before 37 gesta-tional weeks) or low birthweight baby (body weight less than 2500 grams) are high [1], and, if the infant survives, the long-term effects on the health of the baby create additional strains on society’s healthcare resources. In 2010, the worldwide preterm birth rate, when combining rates in countries of all developmental levels, excluding
Taiwan, was 11.1% [2]. In Taiwan in 2010, the preterm birth rate was 9.3%, and, of these preterm babies, 53.3% were low birthweight babies [3].
Maternal physical, mental, and social health are related to preterm birth or low birthweight infants and include such factors as maternal stress, negative affects, low psy-chosocial health status, previous or present pregnancy complications, genitourinary infections, multiple fetuses, and lack of perceived social support [4-7]. Thus, overall maternal quality of life (QoL) has become a focus of research that aims to provide a more in-depth under-standing of the role of QoL on maternal morbidity and mortality as well as on the incidence of preterm birth. * Correspondence:[email protected]
2
Chang Gung University of Science and Technology, 2 Chiapu Rd. West Sec. Putz, Chiayi 613, Taiwan
Full list of author information is available at the end of the article
The QoL of pregnant women affects maternal health as well as fetal and infant health. The majority of previ-ously published studies, however, have focused on spe-cific maternal and/or fetal health issues or complications in pregnancy, and few studies have investigated either overall maternal QoL, including its physical, mental, and social health dimensions, throughout pregnancy and the postpartum period or the effect of QoL on maternal and birth outcomes.
Overall quality of life
Several instruments that measure QoL including the Short Form-36, Short Form-12, and the World Health Organization Quality of Life Scale, have been used in studies on maternal QoL. All these scales have several dimensions of QoL, for example physical health, psycho-logical health, and social relationships. However, rather than the overall QoL of pregnant women, dimensions of QoL were reported in those studies [8-13]. Through the use of the WHO-5 Well-Being Index in a study of German women, researchers found that 18.6% of those who were between 28 and 35 weeks pregnant and 21.6% of those who were postpartum experienced low well-being, while the rates were 12.8% and 31.3%, respect-ively, for American women [14]. Using the Maternal Postpartum Quality of Life scale, Hill found that American postpartum women at week 3 had better QoL than women at week 1 [15].
Maternal physical health
Among the few published studies that have investigated the QoL of pregnant and/or postpartum women, the findings suggest that these women are likely to experi-ence poor physical health [9,16-18]. In a study conduc-ted in Canada, researchers found that pregnant women in their third trimester had lower physical function and vitality and higher role limitation, due to poor physical health and bodily pain, than did non-pregnant women [16]. In a Swedish study, Schytt and Hildingsson found that 20.4% of women at mid-pregnancy (17–19 gesta-tional weeks) perceived having poor physical health; the rate increased to 36.9% at late pregnancy (32–34 gesta-tional weeks) and was 33.7% at one-year postpartum. The researchers also reported that pregnant women who experienced neck/shoulder pain or back pain were more likely to perceive having poor physical health [17]. In an earlier study conducted in the United States, Haas and colleagues found that pregnant women’s physical func-tioning and vitality decreased from pre-pregnancy to late pregnancy [18]. Australian researchers found that, com-pared to the general population, pregnant women at 30–32 weeks of gestation perceived having poorer phys-ical health, yet they had better general health [9]. A large study in Turkey found that postpartum mothers had a
median high score on a QoL scale and that age, educa-tional level, economic status, method of delivery, and number of children were related to maternal QoL [19].
Studies indicate that mothers’ physical health affects their infants’ health and well-being. For example, poor maternal health has a negative impact on the mothers’ infant care behaviors [20,21], and, as a result, their chil-dren experience poor physical health, emotional diffi-culty, and behavioral problems at three years of age [22].
Maternal mental health
Postpartum depression has been widely studied and is known to negatively affect women’s QoL status [12]. Few investigations, however, have examined overall ma-ternal mental health and QoL during and after preg-nancy. Among this research, a few studies have found that pregnant and/or postpartum women may experi-ence poor mental and emotional health. Although Canadian researchers found that pregnant women per-ceived that they had about the same level of mental health as non-pregnant women [16], researchers in Australia found that pregnant women at 30–32 weeks of gestation perceived having poorer mental health than did the general population [9]. In a Swedish study, 14.3% of women at mid-pregnancy (17–19 gestational weeks) perceived having poor emotional health; the rate in-creased to 22.2% in late pregnancy (32–34 gestational weeks) and was 23.9% at one-year postpartum [17].
Poor maternal mental health during pregnancy not only affects pregnant women’s QoL but can also influ-ence their birth outcomes. In the United States, researchers found that pregnant women with low psy-chosocial health status or negative affects at 22–24 weeks of gestation were more likely to have a preterm birth and low birthweight baby [6].
Maternal social health
during pregnancy and resulted in somatic symptoms in the third trimester [25] and preterm birth [5].
Despite the effect of maternal QoL on birth outcomes, few studies have examined the relationship of QoL with its dimensions, especially over time [11,15]. Therefore, we conducted a longitudinal study to explore the levels of QoL in women during and after pregnancy, the rela-tionships between dimensions of QoL, and the poten-tially predictive ability of prenatal maternal QoL for preterm birth and low birthweight. The following re-search questions guided our study: (a) What are the levels and changes of maternal QoL during and after pregnancy? (b) Do levels of maternal QoL differ by demographic variables? (c) How do dimensions of QoL relate to each other? and (d) Can prenatal QoL predict preterm birth (less than 37 gestational weeks) and low birthweight (less than 2,500 grams)?
Methods Design
This report is part of a larger study that survey maternal health status and birth outcomes. The study was conducted in two stages. In the first stage, we used a cross-sectional design to translate, back-translate, and test psychometric properties of questionnaires if the questionnaires have no Chinese version. In the second stage of the study, we used a prospective longitudinal design to explore levels of QoL in women from preg-nancy to the postpartum period. The participants were recruited when they were over 24 gestational weeks, and they were interviewed four separate times during monthly follow-up visits until one-month postpartum.
Setting
Participants were recruited from a hospital in southern Taiwan. Data were collected from interviews with the participants while they were in the hospital waiting for their prenatal checkups. Data collection occurred from February 2010 to October 2011.
Sample
The population of the study was pregnant women in the city of Chiayi, Taiwan. Inclusion criteria for participation were women who: (a) were over 17 years old; (b) could read and write Chinese; and (c) were over 24 weeks of gestation without pregnancy complications, including a diagnosis of prenatal depression or anxiety disorder.
The sample size for the pilot study was 130 pregnant women. Using the G*Power statistical power analysis software program [26], with a power of 90% and correl-ation coefficient between physical, mental, and social health (r=−.31 to -.86) found in the pilot study of this current study, the sample size needed for this current study was determined to be 105. Because the study used
a longitudinal design, which can often have a high attri-tion rate of participants, we recruited as many pregnant women as we could during the study period.
Of the 265 pregnant women who were invited to par-ticipate in the study, 56 declined, and 209 completed the initial survey. Eleven participants dropped out after completing the second survey, leaving 198 participants who completed all four surveys (as described below). The attrition rate was 6.2%. The women who dropped out of the study and who remained in the study did not significantly differ in any of the demographic variables, which included age, marital status, parity, educational level, employment, whether they were happy about their pregnancy, and whether they had a planned pregnancy.
Instruments
The Duke Health Profile (DUKE) was used to measure the QoL of the study participants. The DUKE measures physical, mental, social, general, and perceived health. It is a 17-item, three-point measure derived from the Duke-UNC Health Profile (available at http:// healthmeasures.mc.duke.edu/). The scores on all sub-scales of the DUKE are converted to range from 0 to 100, with higher scores indicating better health. The reli-ability of the scale is supported by Cronbach’s alpha and test-retest correlations. Concurrent and discriminant val-idity of the scale also is evidenced in the scale develop-ment study [27]. For our study, the Chinese version of the DUKE that was provided by the scale developer was used in our study, and the Cronbach’s alpha of the DUKE was tested (alpha = .75) only at initial data collection.
The demographic information was collected through questions that concerned age, educational level, employ-ment, parity, whether the pregnancy was planned, and whether they were happy about the pregnancy. After childbirth, the participants were asked about their baby’s sleep pattern and whether they had someone to take care of them. Their medical records also were reviewed to collect information about the infants.
Procedure
Ethical considerations
Before beginning the study, the research protocol was approved by the Ditmanson Medical Foundation Chia-Yi Christian Hospital (IRB# 098058) in Taiwan, where the data were collected. In addition to participants’being formed about the research procedure, they also were in-formed about confidentiality, privacy, the right to end their participation, and potential benefits and risks. A signed consented form was obtained before data collec-tion. All questionnaires were anonymous, and files that included the participants’ contact information were shredded after all data were collected. Only research-related personnel could access and use the data.
Data analysis
All collected data were managed and analyzed using SPSS, Version 18.0. Descriptive statistics were used to examine the participants’ demographic information and levels of the measured variables. The Mann–Whitney U test and the Kruskal-Wallis test were used to com-pare differences in measured variables by demographic groups. Pearson correlations and hierarchical logistic regression were used to test the relationships between variables and the predictive ability of variables for new-born preterm birth and low birthweight. Generalized estimation equations (GEE) were used to test changes in measured variables over time. Measured variables were tested for their differences by demographic variables; demographic variables that showed differences on mea-sured variables were controlled for in the GEE analyses.
Results Demographics
The mean age of the participants was 29.74 (SD= 4.43, range = 19–42) years, and the mean gestational age at the first data collection time period was 27.34 (191 days, SD = 1.08, range = 25–29) weeks. The majority of the participants were primiparas (n = 111, 56.1%), and ap-proximately one-third were pregnant with their second child (n= 64, 32.3%). Most of the participants were mar-ried (n = 195, 93.4%) and had planned their pregnancy (n= 102, 51.5%). Additionally, 50.0% (n= 99) were“very happy”and 30.8% (n= 61) were“generally happy”about their pregnancy.
Approximately one-third of the participants had a bachelor’s degree or higher (n= 75, 37.9%) or had com-pleted some college (n= 60, 30.3%) or high school (n= 59, 29.8%). Nearly two-thirds were employed (n = 126, 63.6%). Of those who were employed, 74.6% (n = 93) had paid maternity leave, whereas 1.6% (n= 2) did not.
Nearly three-fourths of the participants gave birth va-ginally (n = 141, 71.2%). The mean birthweight of their newborn was 3,021.86 (SD = 358.18, range = 1,968– 3,940) grams, and the mean gestational age at birth was
38.16 (267 days,SD= 1.37, range = 32–40) weeks. Nine-teen babies (9.6%) were born prematurely, and 11 babies (5.6%) were low birthweight.
The majority of the participants breastfed their baby (n = 186, 93.7%). A large majority reported that their baby woke up several times during the night (n = 177, 89.7%). In regard to their baby’s sleep pattern, 44.4% (n = 88) thought it was a small problem, and 36.5% (n= 72) thought that, although serious, the problem was manageable. The majority of the participants had some-one taking care of them (n= 194, 98.4%) and their baby (n= 161, 81.7%) during their first month postpartum.
Differences in quality of life by demographic variables
As shown in Table 1, at T1, unemployed participants scored lower on mental, social, and general health than did employed participants. Participants who were happy about their pregnancy perceived having better mental and general health than did participants who were not happy about their pregnancy. Participants who had a higher educational level had better mental health than did their counterparts. Primiparas had a higher score on general health. However, age was not related to any dimension of QoL (r ranged from -.13 to .09). At postpartum (T4), employed participants were generally, mentally, and socially healthier.
Level of quality of life by time
Quality of life was analyzed through participants’scores in general health, physical health, mental health, and so-cial health by using the GEE method and controlling for demographic variables that showed differences on the QoL variables. As shown in Table 2, participants did not have very high scores in any dimension of QoL at all four data collection time periods. Compared to their perceptions of physical health at T1 (M ± SD= 59.55 ± 17.72), participants perceived that they had poorer phys-ical health at T2 (M ± SD = 55.8 4 ± 18.49, p = .001) and T3 (M ± SD = 50.77 ± 18.58, p < .001); however, they perceived having better physical health at T4 (M ± SD= 70.00 ± 19.92,p< .001). Participants’mental health did not change from T1 to T4 after controlling for demographic variables (M ± SD= 68.99 ± 18.11, 70.41 ± 18.48, 69.28 ± 20.89, and 69.60 ± 20.94 for T1, T2, T3, and T4 respectively;p > .05). Participants’scores for so-cial health were lower at postpartum than at T1 (M ± SD = 65.20 ± 17.06 and 60.25 ± 16.45 for T1 and T4 respect-ively; p< .001). Compared to their general health at T1, participants had poorer general health at T3 after control-ling for employment and happiness about pregnancy.
Table 1 Differences on quality of life by demographic variables at T1 and T4
Physical health Mental health Social health General health
n M±SD Z/X2 p M±SD Z/X2 p M±SD Z/X2 p M±SD Z/X2 p
T1
Parity -.77 .44 −1.80 .07 −1.62 .10 −2.06 .04
Primipara 111 60.90±15.29 71.26±16.24 67.30±16.29 66.49±11.70
Multipara 87 57.82±20.37 66.09±19.96 62.53±17.73 62.15±14.77
Employment -.51 .61 −4.05 <.001 −3.06 .002 −3.39 .001
Employed 126 60.16±17.43 72.78±18.09 67.94±16.94 66.96±13.11
Unemployed 72 58.47±18.28 62.36±16.23 60.42±16.31 60.42±12.61
Education -.24 .81 −2.10 .04 −1.52 .13 −1.15 .25
Lower than college 63 59.84±20.12 64.76±19.25 62.22±16.50 62.28±14.87
College or higher 135 59.41±16.56 70.96±17.27 66.59±17.20 65.65±12.38
Happy or unhappy about the pregnancy 1.07 .59 8.70 .01 3.59 .17 6.94 .03
Happy 160 60.06±17.43 70.25±17.55 66.06±17.20 65.46±12.77
Unhappy 13 54.62±15.06 56.92±10.32 57.69±14.23 56.41±8.97
Uncertain 25 58.80±20.88 67.20±22.46 63.60±17.05 63.20±16.82
T4
Parity -.71 .48 -.24 .81 −1.09 .28 -.09 .93
Primipara 111 59.55±19.42 69.19±20.85 61.62±15.46 66.79±15.54
Multipara 87 70.57±20.65 70.11±21.16 58.51±17.56 66.40±16.27
Employment −1.51 .13 −3.21 .001 −2.71 .01 −3.02 .003
Employed 116 71.81±19.32 73.45±20.26 63.19±14.12 69.48±14.94
Unemployed 82 67.44±20.60 64.15±20.78 56.10±18.58 62.56±16.24
Being taken care of -.17 .87 -.68 .50 -.18 .86 -.21 .83
Yes 192 70.10±19.66 69.43±20.70 60.31±16.37 66.61±15.63
No 6 66.67±29.44 75.00±29.50 58.33±20.41 66.67±23.29
Baby sitter −1.66 .10 −1.59 .11 −1.77 .08 −1.84 .07
Yes 155 71.23±19.72 70.90±20.24 61.35±16.00 67.83±15.22
No 43 65.58±20.27 64.88±22.93 56.28±17.60 62.25±17.35
Baby’s gender -.67 .51 −1.73 .08 -.34 .73 −1.32 .19
Male 106 70.94±20.07 71.98±20.54 60.75±15.16 67.89±15.65
Female 91 69.23±19.68 67.14±21.10 59.67±17.98 65.35±15.95
Baby’s sleep patterns 3.70 .16 1.49 .48 2.81 .25 3.39 .18
Serious problem 15 60.00±25.07 64.67±24.75 56.67±13.45 60.44±18.38
Manageable 73 69.04±18.12 67.81±21.42 57.67±15.14 64.84±14.98
Small problem 89 71.46±19.57 71.24±19.70 61.24±16.91 67.98±15.56
Not a problem 21 74.29±22.26 72.38±21.89 67.62±18.95 71.43±16.88
Maternity leave .20 .91 2.24 .33 4.00 .14 1.55 .46
Paid leave 96 73.33±18.33 74.58±19.41 64.79±13.69 70.90±13.83
No-pay leave 26 69.62±22.36 69.23±22.96 56.92±18.28 65.26±19.05
No leave/not employed 76 65.92±20.47 63.42±20.69 55.66±17.61 61.67±15.68
Birth method −1.63 .10 -.19 .85 -.30 .77 -.68 .50
Vaginal delivery 143 60.98±17.21 69.51±17.78 65.38±17.11 65.29±12.61
Cesarean section 54 56.48±18.14 68.15±18.84 64.44±17.12 63.02±14.81
57.4% at T1, T2, and T3, respectively, and decreased to 22.0% at T4. The rates of poor/fair mental health remained stable throughout pregnancy and postpartum (23%, 20.6%, 26.9%, and 26% at T1, T2, T3, and T4 re-spectively). Different from the trend for physical health, rates of poor/fair social health remained stable through-out pregnancy (27.4%, 28.4%, and 27.2% at T1, T2, and T3, respectively) and increased at postpartum (37.1%). For general health, the rate of poor/fair general health increased from 15.5% at T1 to 20.1% at T2 and 26.9% at T3, and decreased to 21.0% at T4. Figure 1 shows the trends for perceived poor/fair health from pregnancy to postpartum.
Correlations between dimensions of quality of life
As shown in Table 3, the majority of general, physical, mental, and social health data at all collection time periods were significantly and positively intercorrelated except for T1 physical health and T4 social health (r= .11,p= .13). If one uses Cohen’s criteria for statistical power, where correlation coefficients lower than .30 denote a medium relationship and .10 a weak relationship [28], many corre-lations between prenatal variables and postpartum vari-ables (except for prenatal and postpartum general health) were weak. In contrast, the majority of correlations among prenatal variables were medium or strong.
Prediction of newborn preterm birth and low birthweight
The dimensions of QoL were tested for their predictive ability for preterm birth and infant low birthweight using two hierarchical logistic regressions. Before the analysis, demographic variables were tested for their relation-ships with preterm birth and low birthweight by the Mann–Whitney U test or Kruskal-Wallis test. Results showed that only parity (Z=−3.73,p< .001) was related to preterm birth; none of the other demographic
Table 2 Comparison of dimensions of quality of life by data collection time period
Range M±SD B Wald X2 p 95% CI
Physical health
T1 (referent) 0–100 59.55±17.72 - - -
-T2 0-100 55.84±18.49 −3.66 11.53 .001 −5.77, -1.55
T3 0-90 50.77±18.58 −8.82 48.01 <.001 −11.32, -6.33
T4 10-100 70.00±19.92 10.46 41.33 <.001 7.27, 13.65
Mental health
T1 (referent) 10–100 68.99±18.11 - - -
-T2 20–100 70.41±18.48 1.52 1.63 .20 -.81, 3.85
T3 20–100 69.28±20.89 .30 .06 .81 −2.04, 2.63
T4 20–100 69.60±20.94 .61 .15 .70 −2.47, 3.69
Unhappy (referent) 50-80 56.92±10.32 - - -
-Happy 20-100 70.25±17.55 3.61 1.05 .31 −3.29, 10.51
Uncertain 10-100 67.20±22.46 -.60 .02 .90 −9.64, 8.44
Lower than college (referent) 10-100 64.76±19.25 - - -
-Equal to or higher than college 20-100 70.96±17.27 .10 .001 .97 −4.90, 5.09
Unemployed 20-100 62.36±16.23 - - -
-Employed 10-100 72.78±18.09 8.26 11.33 .001 2.46, 3.45
Social health
T1 (referent) 20–100 65.20±17.06 - - -
-T2 10–100 64.87±18.70 -.27 .07 .80 −2.35, 1.80
Demographic variables that showed differences on the quality of life variables were controlled for in these analyses. T1 = 25–29 gestational weeks; T2 = 30–34 gestational weeks; T3= over 34 gestational weeks; T4 = 4–6 weeks postpartum.
0% 10% 20% 30% 40% 50% 60% 70%
T1 T2 T3 T4
Time
Percentage
Physical health Mental health
Social health General health
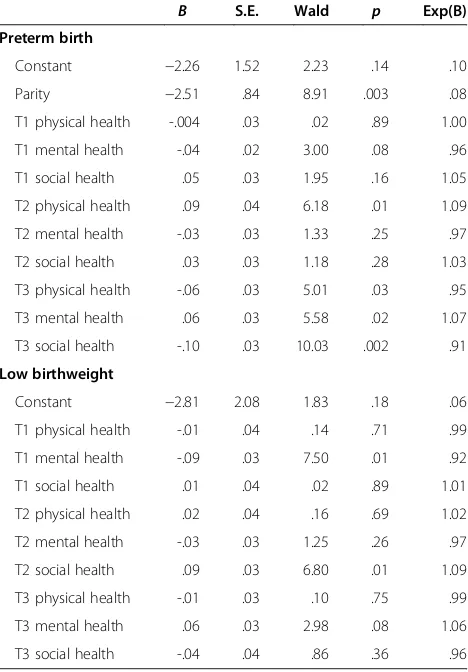
variables showed a significant relationship. Therefore, in the regression analysis for preterm birth, parity was con-trolled for by entering in the first set, while variables measured at T1 were in the second set, variables at T2 in the third set, and variables at T3 in the fourth set. For low birthweight analysis, neither parity nor any other variable was controlled for because no demographic variable was related to low birthweight. The results showed that physical health at T2 and all dimensions of QoL at T3 could predict preterm birth (Table 4). In other words, after controlling for all other variables in the ana-lysis, pregnant women who had a higher score on T2 physical health had a higher risk of giving birth prema-turely by 1.09 times. After controlling for all other vari-ables in the analysis, those who had a lower score on T3 physical health and social health had a lower risk of giving birth prematurely by 5% and 9%, respectively, whereas those who had a higher score on T3 mental health had a higher risk of giving birth prematurely by 1.07 times.
The finding that higher T3 mental health score (better mental health) could predict preterm birth was incon-sistent with other study findings [6], we therefore conducted a further analysis and found that 40% (n = 2 out of 5) of pregnant women who had a low mental health score at T3 (scored 0–25) gave birth prematurely. Additionally, the rate of women who gave birth prema-turely was 4.2% (n = 2 out of 48) for those who scored median low (scored 25.1–50), 6.8% (n = 4 out of 59) for those who scored median high (scored 50.1–75), and 10.6% (n = 9 out of 83) for those who scored high
Table 3 Correlations between measured variables at different data collection time periods
1 2 3 4 5 6 7 8 9 10 11 12 13 14 15
1. T1 physical health 1
2. T1 mental health .39** 1
3. T1 social health .21* .44** 1
4. T1 general health .71*** .82*** .72*** 1
5. T2 physical health .65*** .29* .34** .57*** 1
6. T2 mental health .40** .58*** .45** .64*** .37** 1
7. T2 social health .26* .49** .66*** .62*** .27* .49** 1
8. T2 general health .57*** .59*** .63*** .80*** .72*** .81*** .77*** 1
9. T3 physical health .52*** .36** .29* .52*** .68*** .37** .28* .58*** 1
10. T3 mental health .34** .64*** .46** .64*** .40** .71*** .50*** .71*** .44** 1
11. T3 social health .23* .41** .62*** .56*** .32** .51*** .63*** .64*** .27* .57*** 1
12. T3 general health .46** .60*** .58*** .73*** .59*** .68*** .60*** .82*** .72*** .87*** .77*** 1
13. T4 physical health .26* .20* .22* .30** .43** .23* .23* .39** .36** .27* .22* .36** 1
14. T4 mental health .18* .35** .29* .36** .34** .41** .32** .47** .27* .41** .29* .42** .58*** 1
15. T4 social health .11 .26* .44** .36** .23* .27* .50*** .44** .21* .24* .42** .36** .40** .57*** 1
16. T4 general health .23* .33** .37** .41** .41** .37** .41** .52*** .35** .38** .37** .46** .82*** .89*** .77***
All correlations were significant atp< .05 except for correlation between T1 physical health and T4 social health (p=.13).*
weak relationship,**
medium relationship,***
strong relationship based on Cohen’s criteria of power. T1 = 25–29 gestational weeks; T2 = 30–34 gestational weeks; T3= over 34 gestational weeks; T4 = 4–6 weeks postpartum.
Table 4 predictive ability of quality of life for preterm birth and low birthweight
B S.E. Wald p Exp(B)
Preterm birth
Constant −2.26 1.52 2.23 .14 .10
Parity −2.51 .84 8.91 .003 .08
T1 physical health -.004 .03 .02 .89 1.00
T1 mental health -.04 .02 3.00 .08 .96
T1 social health .05 .03 1.95 .16 1.05
T2 physical health .09 .04 6.18 .01 1.09
T2 mental health -.03 .03 1.33 .25 .97
T2 social health .03 .03 1.18 .28 1.03
T3 physical health -.06 .03 5.01 .03 .95
T3 mental health .06 .03 5.58 .02 1.07
T3 social health -.10 .03 10.03 .002 .91
Low birthweight
Constant −2.81 2.08 1.83 .18 .06
T1 physical health -.01 .04 .14 .71 .99
T1 mental health -.09 .03 7.50 .01 .92
T1 social health .01 .04 .02 .89 1.01
T2 physical health .02 .04 .16 .69 1.02
T2 mental health -.03 .03 1.25 .26 .97
T2 social health .09 .03 6.80 .01 1.09
T3 physical health -.01 .03 .10 .75 .99
T3 mental health .06 .03 2.98 .08 1.06
(scored 75.1–100), and the rate was significantly differ-ent by groups (X2= 9.86,p= .02). These results showed that, in fact, the pregnant women who had a very low score on mental health (score lower than 25) had higher risk of giving birth prematurely than women had higher scores (score higher than 25).
For low birthweight, only mental health at T1 and so-cial health at T2 were included in the regression model (Table 4). In other words, after controlling for other var-iables in the analysis, pregnant women who had a higher score on T1 mental health had a lower risk of giving birth to a low birthweight infant by 8%. while those who had a higher score on T2 social health had a higher risk of giving birth to a low birthweight infant by 1.09 times.
Discussion
Maternal physical health
Throughout their pregnancy and early postpartum period, the women in this study did not perceive having a high level of QoL, which included physical, mental, so-cial, and general health. In fact, the women’s perceived level of physical health decreased as their pregnancy progressed. This finding is consistent with results from previous studies in other countries, which suggests that pregnant women, regardless of their ethnicity and cul-ture, perceive having poorer physical health later in their pregnancy. In a study conducted in the United States, Hass et al. found that pregnant women’s physical func-tion and vitality, which can be considered factors related to physical health, declined during pregnancy, especially at late pregnancy [18]. Lau and Yin’s survey of the QoL of Chinese pregnant women in their second trimester found that, overall, the pregnant women had a low score on physical health when measured with the SF-12, a scale for health-related QoL [10]. In Sweden, Schytt and Hildingsson found that 20.4% of the pregnant women in their study perceived having poor/fair physical health at mid-pregnancy, and the rate increased to 36.9% in late pregnancy [17]. Our study revealed similar findings, spe-cifically that the rate of poor/fair physical health in-creased from T1 to T3. The increase in pregnancy-related physical symptoms, especially symptoms that occur or become severe at late pregnancy, may explain these changes in the level of women’s perceived physical health throughout their pregnancy. For example, in Rodriguez et al.’s longitudinal study, 8% of women pregnant at 20 weeks frequently experienced difficulty sleeping, while the rate increased to 17% at 28 weeks and 25% at 32–36 weeks of gestation [29].
At one-month postpartum, the women in our study perceived having better physical health compared to their physical health during pregnancy. We found the rate of poor/fair physical health at T4 dramatically de-creased from the rate at T3. This result is similar to that
of Schytt and Hildingsson, who found that, at two-months postpartum, the rate of poor/fair physical health of the women in their study decreased to 19.9% from the 36.9% rate at late pregnancy [17]. Perhaps the mothers perceived having better physical health after childbirth because they no longer had the burden of pregnancy-related physical health challenges.
Maternal mental health
The women in our study had a median high score on mental health (mean scores ranged from 69.25 to 70.60), and the score did not change significantly throughout the women’s pregnancy or into their postpartum period. We also found that the rate of perceived poor/fair men-tal health of women remained similar from pregnancy to postpartum. The poor mental health status of the women in our study throughout their pregnancy and into their early postpartum period is similar to what was found in research from other countries. Schytt and Hildingsson found that 14.3% to 23.9% of pregnant women perceived having poor mental health from mid-pregnancy to postpartum; the women also perceived having poorer mental health than that of the general population [17]. Gartland et al. also found that Australian pregnant women perceived having poorer mental health at 30–32 weeks of gestation than that of the general population [9].
Among the studies on mental health issues in women throughout pregnancy and postpartum, depression or depressive symptoms have been the main focus, and postpartum depression has been examined more often than has prenatal depression. In a community-based study conducted in Canada, researchers found that 14.1%, 10.4%, and 8.1% of women in early pregnancy, late pregnancy, and postpartum, respectively, experi-enced depressive symptoms [30]. In a study conducted in China, the rate of depression and/or anxiety was 15% among women at all stages of pregnancy [31]. The high rate of pregnant and postpartum women’s experiencing poor mental health, as evidenced in our study and in previous studies, and the relationship between poor mental health and preterm birth and low birthweight, as found in our study, highlight the need for more research that, in addition to a focus on depression or anxiety, focuses on other negative affects as well.
Maternal social health
social health score of the participants might be consist-ent with results from those earlier studies. An explan-ation for the decreased perception of social health among the Taiwanese participants in our study may be the trad-itional Chinese cultural practice of “doing the month,” which confines the new mother at home for a month while someone takes care of her [32,33]. It might also explain why study participants who were employed per-ceived having better social health, both during pregnancy and after childbirth, than did unemployed participants.
Maternal general health
In our study, the pregnant women’s perceived level of general health decreased at late pregnancy. Using a score of 50 as the cutoff point (DUKE scale score ranges from 0 to 100) for poor/fair general health or good/excellent general health, we determined that the rate of poor/fair general health was 15.5%, 20.1%, 26.9%, and 21.0% at T1, T2, T3, and T4, respectively. Although the use of differ-ent measuring tools makes it difficult to compare our re-sults with rere-sults from other studies, the rate of poor/ fair health experienced by the Chinese/Taiwanese preg-nant women in our current study was higher than the rate of American pregnant women in Hass et al.’s study. The perceived general health status of the participants in Hass et al.’s study did not change significantly over the course of pregnancy and included a rate of less than 15% for poor/fair health [18]. The reason for the difference in rates between our study and that of Hass et al. may be that people from different cultures and ethnicities per-ceive health differently.
In our study, women who were employed and happy about their pregnancy perceived having better general health than did women who were unemployed and un-happy about their pregnancy. This finding suggests that encouraging women to view the positive aspects of their pregnancy may help promote their general health status.
Predictors of newborn preterm birth and low birthweight
The results from our study suggest that all dimensions of maternal QoL at late pregnancy can predict preterm birth and that maternal physical health at mid-preg-nancy can predict infant low birthweight. Although no research has reported on the relationships of maternal QoL with preterm birth and with low birthweight, some studies have found that previous or present pregnancy complications, multiple fetuses, low psychosocial health, more negative affects, a lower level of perceived social support, and several social health issues are related to premature birth or low birthweight [4-6,24]. Similarly, our study found that poor physical health and poor so-cial health at late pregnancy can predict preterm birth and that poor mental health at early pregnancy can pre-dict low birthweight.
One finding in our study that was inconsistent with other studies is that better, rather than poorer, mental health at late pregnancy can predict preterm birth. We also found that, in fact, the pregnant women who had a very low score on mental health had a higher risk of giv-ing birth prematurely than did women who had higher scores. We therefore suggest that assessing maternal mental health actively and paying more attention on pregnant women with very poor mental health status.
Study limitations
The strengths of this study are its longitudinal design and the participants’ low attrition rate. However, the generalizability of the study’s findings is limited due to the use of convenience sampling in just one hospital located in Taiwan. To increase the generalizability of our findings, we recommend that future longitudinal investi-gations involve other sampling methods of women throughout their pregnancy and postpartum periods as well as participants from more hospitals.
Conclusions
The findings from our study fill a gap in the literature and provide an important longitudinal view of maternal QoL dimensions during pregnancy and the postpartum period as well as their influences on maternal health and birth outcomes. Increasing the understanding of these factors and implementing appropriate interventions can help reduce not only maternal morbidity and mortality but also the incidence of preterm birth and low birth-weight infants.
mental health scores at earlier pregnancy tended to pre-dict infants born with a low birthweight.
Based on our study’s findings, we suggest that additional research is needed to provide a more thorough under-standing of all the dimensions of QoL among women throughout pregnancy and the postpartum period and, especially, of the significant effect of these factors on ma-ternal health and birth outcomes. An emphasis on the positive aspects of pregnancy may increase maternal QoL. We also recommend devoting more attention to develop-ing preventive interventions that specifically address preg-nant women’s QoL and to implementing them early in pregnancy to prevent pregnant women’s low levels of per-ceived QoL and to promote high levels of QoL at late pregnancy and beyond. These interventions may help pre-vent preterm birth and low birthweight infants. In our study, we used the Chinese version of the DUKE provided by the scale developer and tested the reliability of the scale only when used with Chinese/Taiwanese in Taiwan. We also suggest that, if future studies use instruments devel-oped in a language other than the language used by the study population, the researchers need to follow the process for translation and validation [34].
Competing interest
The authors declare that they have no competing interests.
Authors’contributions
PW participated in the study design, collected the data, and finalized the manuscript. SRL designed the study and drafted the manuscript. CYC participated in the study design, collected the data, analyzed the data, and finalized the manuscript. All authors read and approved the final manuscript.
Acknowledgments
This work was funded by an award from the Chang Gung Medical Research Program (CMRPF680042).
Author details 1
Department of Obstetrics and Gynecology, Chia-Yi Christian Hospital, 539 Jhongsiao Rd, Chia-yi City 600, Taiwan.2Chang Gung University of Science
and Technology, 2 Chiapu Rd. West Sec. Putz, Chiayi 613, Taiwan.
Received: 21 August 2012 Accepted: 29 May 2013 Published: 2 June 2013
References
1. Russell RB, Green NS, Steiner CA, Meikle S, Howse JL, Poschman K, Dias T, Potetz L, Davidoff MJ, Damus K, Petrini JR:Cost of hospitalization for preterm and low birth weight infants in the United States.Pediatr2007,
120:e1–e9.
2. Blencowe H, Cousens S, Chou D, Oestergaard MZ, Say L, Moller AB, Kinney M, Lawn J:15 million preterm births: priorities for action based on national, regional and global estimates. InBorn Too Soon: The Global Action Report on Preterm Birth.Edited by Howson CP, Kinney MV, Lawn JE. Geneva: World Health Organization; 2012:6–31.
3. Health Statistics Database.https://olap.bhp.doh.gov.tw/search/ShowReport. aspx?mode=7&tarId=106&year=99&com_year=100&ftype=&fvals=& fpage=0&CityWhere=&CityName=&chart=0&addType=&NoLevel=1. 4. Goldenberg R, Culhane J, Iams J, Romero R:Epidemiology and causes of
preterm birth.Lancet2008,371(9606):75–84.
5. Gungor I, Oskay U, Beji N:Biopsychosocial risk factors for preterm birth and postpartum emotional well-being: a case–control study on Turkish women without chronic illnesses.J Clin Nurs2011,20:653–665.
6. Neggers Y, Goldenberg R, Cliver S, Hauth J:The relationship between psychosocial profile, health practices, and pregnancy outcomes. Acta Obstet Gynecol Scand2006,85:277–285.
7. Nobile C, Raffaele G, Altomare C, Pavia M:Influence of maternal and social factors as predictors of low birth weight in Italy.BMC Publ Health2007,
7:192–200.
8. Chang PJ, Tseng YC, Chuang CH, Chen YC, Hsieh WS, Hurng BS, Lin SJ, Chen PC:Use of Sheng-Hua-Tang and health-related quality of life in postpartum women: a population-based cohort study in Taiwan. Int J Nurs Stud2010,47:13–19.
9. Gartland D, Brown S, Donath S, Perlen S:Women's health in early pregnancy: Findings from an Australian nulliparous cohort study.Aust N Z J Obstet Gynaicol2010,50:413–418.
10. Lau Y, Yin L:Maternal, obstetric variables, perceived stress and health-related quality of life among pregnant women in Macao, China. Midwifery2011,27:668–673.
11. Setse R, Grogan R, Pham L, Cooper L, Strobino D, Powe N, Nicholson W:
Longitudinal study of depressive symptoms and health-related quality of life during pregnancy and after delivery: the Health Status in Pregnancy (HIP) study.Matern Child Health J2009,13(5):577–587.
12. De Tychey C, Briançon S, Lighezzolo J, Spitz E, Kabuth B, de Luigi V, Messembourg C, Girvan F, Rosati A, Thockler A, Vincent S:Quality of life, postnatal depression and baby gender.J Clin Nurs2008,17(3):312–322. 13. Webster J, Nicholas C, Velacott C, Cridland N, Fawcett L:Quality of life and
depression following childbirth: impact of social support.Midwifery2011,
27:745–749.
14. Hellmers C, Schuecking B:Primiparae's well-being before and after birth and relationship with preferred and actual mode of birth in Germany and the USA.J Reprod Infant Psychol2008,26(4):351–372.
15. Hill P, Aldag J:Maternal perceived quality of life following childbirth. J Obstet Gynecol Neonatal Nurs2007,36(4):328–334.
16. Da Costa D, Dritsa M, Verreault N, Balaa C, Kudzman J, Khalifé S:Sleep problems and depressed mood negatively impact health-related quality of life during pregnancy.Arch Women Ment Health2010,13(3):249–257. 17. Schytt E, Hildingsson I:Physical and emotional self-rated health among
Swedish women and men during pregnancy and the first year of parenthood.Sex Reprod Health2011,2:57–64.
18. Haas BK:A multidisciplinary concept analysis of quality of life.West J Nurs Res1999,21:728–742.
19. Akýn B, Ege E, Koçodlu D, Demirören N, Yýlmaz S:Quality of life and related factors in women, aged 15–49 in the 12-month post-partum period in Turkey.J Obstet Gynaecol Res2009,35:86–93.
20. Tarkka MT, Paunonen M, Laippala P:Social support provided by public health nurses and the coping of first-time mothers with child care. Public Health Nurs1999,16:114–119.
21. Turner C, Boyle F, O’Rourke P:Mothers’health post-partum and their patterns of seeking vaccination for their infants.Int J Nurs Pract2003,9:120–126. 22. Kahn RS, Zuckerman B, Bauchner H, Homer CJ, Wise PH:Women’s health
after pregnancy and child outcomes at age 3 years: a prospective cohort study.Am J Public Health2002,92:1312–1318.
23. Larson JS:The World Health Organization's definition of health: social versus spiritual health.Soc Indic Res1996,38:181–192.
24. Brown S, Yelland J, Sutherland G, Baghurst P, Robinson J:Stressful life events, social health issues and low birthweight in an Australian population-based birth cohort: challenges and opportunities in antenatal care.BMC Publ Health2011,11:196–207.
25. Paarlberg KM, Vingerhoets AJJM, Passchier J, Heinen AGJJ, Dekker GA, van Geijn HP:Psychosocial factors as predictors of maternal well-being and pregnancy-related complaints.J Psychosom Obstet Gynaecol1996,17:93–102. 26. Faul F, Erdfelder E, Buchner A, Lang AG:Statistical power analyses using
G*Power 3.1: Tests for correlation and regression analyses.Behav Res Methods2009,41:1149–1160.
27. Parkerson GR, Broadhead WE, Tse CKJ:The Duke Health Profile: A 17-item measure of health and dysfunction.Medical Care1990,28:1056–1072. 28. Cohen J:A power primer.Psychol Bull1992,112(1):155–159. 29. Rodriguez A, Bohlin G, Lindmark G:Symptoms across pregnancy in
relation to psychosocial and biomedical factors.Acta Obstet Gynecol Scand2001,80:213–223.
31. Qiao Y, Wang J, Li J, Ablat A:The prevalence and related risk factors of anxiety and depression symptoms among Chinese pregnant women in Shanghai.Aust N Z J Obstet Gynaecology2009,49(2):185–190.
32. Dennis CL, Fung K, Grigoriadis S, Robinson GE, Romans S, Ross L:Traditional postpartum practices and rituals: a qualitative systematic review. Womens Health2007,3:387–502.
33. Leung SSK, Arthur D, Martinson IM:Perceived stress and support of the Chinese postpartum ritual“doing the month.Health Care Women Int
2005,26:212–224.
34. Kirkpatrick P, van Teijlingen E:Lost in translation; reflecting on a model to reduce translation and interpretation bias.The Open Nurs J2009,3:25–32.
doi:10.1186/1471-2393-13-124
Cite this article as:Wanget al.:Prediction of maternal quality of life on preterm birth and low birthweight: a longitudinal study.BMC Pregnancy and Childbirth201313:124.
Submit your next manuscript to BioMed Central and take full advantage of:
• Convenient online submission
• Thorough peer review
• No space constraints or color figure charges
• Immediate publication on acceptance
• Inclusion in PubMed, CAS, Scopus and Google Scholar
• Research which is freely available for redistribution