R E S E A R C H
Open Access
Multiclass EEG motor-imagery classification
with sub-band common spatial patterns
Javeria Khan
1, Muhammad Hamza Bhatti
1, Usman Ghani Khan
1,2and Razi Iqbal
1*Abstract
Electroencephalogram (EEG) signal classification plays an important role to facilitate physically impaired patients by providing brain-computer interface (BCI)-controlled devices. However, practical applications of BCI make it difficult to decode motor imagery-based brain signals for multiclass classification due to their non-stationary nature. In this study, we aim to improve multiclass classification accuracy for motor imagery movement using sub-band common spatial patterns with sequential feature selection (SBCSP-SBFS) method. Filter bank having bandpass filters of different overlapped frequency cutoffs is applied to suppress the noise signals from raw EEG signals. The output of these sub-band filters is sent for feature extraction by applying common spatial pattern (CSP) and linear discriminant analysis (LDA). As all of the extracted features are not necessary for classification therefore, selection of optimal features is done by passing the extracted features to sequential backward floating selection (SBFS) technique. Three different classifiers were then trained on these optimal features, i.e., support vector machine (SVM), Naïve-Bayesian Parzen-Window (NBPW), and k-Nearest Neighbor (KNN). Results are evaluated on two datasets, i.e., Emotiv Epoc and wet gel electrodes for three classes, i.e., right-hand motor imagery, left hand motor imagery, and rest state. The proposed model yields a maximum accuracy of 60.61% in case of Emotiv Epoc headset and 86.50% for wet gel electrodes. The computed accuracy shows an increase of 7% as compared to previously implemented multiclass EEG classification.
Keywords: EEG, Common spatial pattern, Filter bank, Sequential backward floating selection, Motor imagery
1 Introduction
Brain signals, produced as a result of interneuronal brain activity, can be measured using neuroimaging technique known as an electroencephalogram (EEG) [1]. Brain-computer interface (BCI) translates these electrical signals into control commands thus providing a communication pathway between the brain and outside world devices such as BCI wheelchair, neuro-gaming, and prosthetics. BCI facilitates physically impaired patients by capturing their brain signals which after preprocessing, major features are extracted and then on the basis of classified results, outside world devices are controlled [2]. There are two most common approaches to BCI based on measur-ing methods of EEG signals, i.e., invasive and noninvasive BCIs. The invasive technique is more complex and dan-gerous as electrodes are directly implanted into the brain
by neurosurgery, as a result, firing of neurons can be read without any external interference which detects high-quality signal [3]. Conversely, in non-invasive BCI, the electrodes are placed on the human scalp. Although, these signals have reduced spatial resolution and have more noise contents but due to its easiness, safety, and cost ef-fectiveness, it is used widely [4]. For non-invasive BCI, EEG data can be acquired in two ways, i.e., by using wet gel electrodes and dry electrodes. Contact impedance measured between the skin and an electrode represents the quality of EEG signal. High contact impedance can result in increased noise, as a result, gives poor signal quality. This impedance can be reduced by applying con-ductive gel paste but require extensive skin preparation which involves extensive skin abrasion and dead cells removal from the skin surface [5].
Acquisition of EEG signals by using non-invasive tech-niques has an influence of external noise; therefore, the ac-quired signal is contaminated with artifacts such as signals produced as a result of muscle movement, cable noise, and
© The Author(s). 2019Open AccessThis article is distributed under the terms of the Creative Commons Attribution 4.0 International License (http://creativecommons.org/licenses/by/4.0/), which permits unrestricted use, distribution, and reproduction in any medium, provided you give appropriate credit to the original author(s) and the source, provide a link to the Creative Commons license, and indicate if changes were made.
* Correspondence:[email protected]
1Al-khawarizmi Institute of Computer Science, University of Engineering and
Technology, Lahore, Pakistan
environment noise [6]. These artifacts make the process of BCI signal translation very complex because pure EEG sig-nal has low amplitude and frequency components as com-pared to those of artifacts. So, after EEG signal acquisition, first of all, the noise is suppressed from the signal using dif-ferent spatial filters [7]; this process of noise suppression is known as preprocessing. This signal can directly be fed to the classifier but this will make the process of classifier training very time-consuming. Moreover, EEG signal has a low spatial resolution, low signal-to-noise ratio (SNR) and its measurement mainly attribute to the volume conduc-tion, which signifies the electrical field of the brain that is conducted from the source to the scalp [8]. To measure this low SNR and spatial resolution, common spatial pattern (CSP) was proposed to efficiently extract spatial fea-tures for motor imagery brain signals. This method com-putes the maximum ration of variances between different classes of data by applying filters on it. Research shows that common spatial patterns (CSP) is proved an efficient and widely used technique to extract feature from EEG signal [9]. As CSP is mainly carried out on the complete data while whole EEG data does not contain useful infor-mation; therefore it ignores the importance of features. So, to overcome this problem, EEG signal is divided into dif-ferent sub-bands to extract information from difdif-ferent portions of the signal and then the selection of features from extracted features on the basis of different informa-tion produces better results [10–14].
The paper is organized as follows: the “Related work” section presents the detailed literature review, the
“Methodology” section provides the details about pro-posed methodology while the “Results and discussion” section describes the findings of this paper. Finally, the last section presents the conclusion.
1.1 Related work
Recently, various machine learning (ML) approaches for BCI have been developed to circumvent the complexity of brain signals. These different methods have shown remarkable results for binary class EEG classification [10– 14] while for better and more control commands of real-time applications such as BCI controlled wheelchair, neuro-gaming, and prosthetics, binary class is not suffi-cient; therefore, a requirement for multiclass classification arises. Nicolas et al. implemented adaptive generalization method for classification of multiclass motor imagery (MI)-based EEG signals, by the selection of optimal ex-tracted subband CSP features using mutual-information best individual features (MIBIF) [15]. Classification is done by using stacked regularized linear discriminant analysis (SRLDA) [16]. The resulted accuracy has shown better re-sults for binary class rather than for multiclass, i.e., 85% and 74% respectively. Shiratori et al. [17] included “rest state”as a third class along with other two classes for MI
movement of the left and right hand. They extracted CSP features from the EEG signal is divided into subbands. Support vector machine (SVM) [18] was used as a classi-fier to train the system on selected features based on mu-tual information. Although the implemented methodology has shown 88.7% results for classification of EEG signals produced as a result of finger tapping, it did not show good results for multiclass MI data, i.e., 56.7%.
A lot of research has been conducted for the classifica-tion of multiclass EEG signals of same limb movements. Yong and Menon [19] applied a bandpass filter to pre-process raw data while both CSP and Filter bank common spatial pattern (FBCSP) [11] were used to extract features from multiclass EEG signal acquired from the same limb. This approach showed better results for data acquired from the same limb than data from different limbs but the overall accuracy of the system was reported 60.7%. Shi-man et al. [20] investigated that MI-based brain signals produced as a result of the imagination of movement from the same limb produce more results than the signals ac-quired from different limbs. They applied FBCSP having unique frequency cutoffs, i.e., (7 to 15 Hz, 15 to 25 Hz, 25 to 30 Hz) on the acquired same limb EEG data for feature extraction. Then, linear discriminant analysis (LDA) [21] is trained for classification on the basis of extracted fea-tures. The results show an accuracy of 69.1% and 62.75% for 3 and 4 class MI-based brain signal respectively.
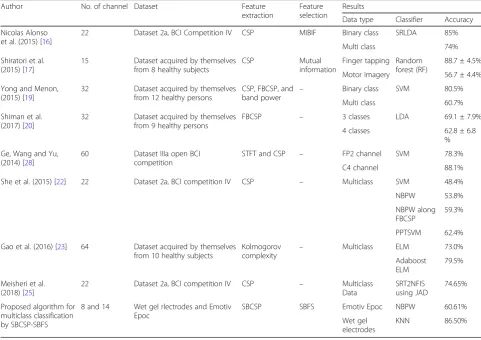
[26] in preprocessing of the MI-based EEG data. Fast Fro-benius Diagonalization (FFDIAG) [27] was applied on the EEG signal for obtaining spatial filters by JAD then CSP is applied on the resulted signal for feature extraction. Self-regulated interval type 2 neuro fuzzy inference system (SRIT2NFIS) is used for classification of these extrated features. The implemented technique have shown good results on the produced algorithm, i.e., maximum of 74.65% accuracy for a single subject. Table1shows a brief comparison of previous researches for classification of multiclass MI based brain signals.
The related work for multiclass EEG classification shows that most of the results were evaluated by using one versus rest approach which is considered as a binary class classifi-cation. Therefore, for run-time control of BCI-controlled devices, multiclass classification is required [24]. This paper aims to implement multiclass classification to improve the results of motor imagery brain signals by using sub-band common spatial patterns with sequential backward floating selection (SBCSP-SBFS). Feature extraction and then selec-tion of optimal features on the basis of the final perform-ance of the classifier is the principle of this approach. The motor imagery-based EEG signal is decomposed into
different subbands using a filter bank which contains filters of different frequency cutoffs. Once the signal is decom-posed, then CSP is applied on it to extract sub-band CSP features, these features are fed into LDA for eigenvector computation. All of the features are not optimal for getting better accuracy from classifier; therefore, sequential back-ward floating selection (SBFS) technique is used to select‘k’
optimal features from‘n’extracted features. Different classi-fiers SVM, k-nearest neighbor (KNN) [29] and naïve Bayes-ian Parzen window (NBPW), are trained and tested on these ‘k’ optimal features for evaluation of the proposed model.
2 Methodology
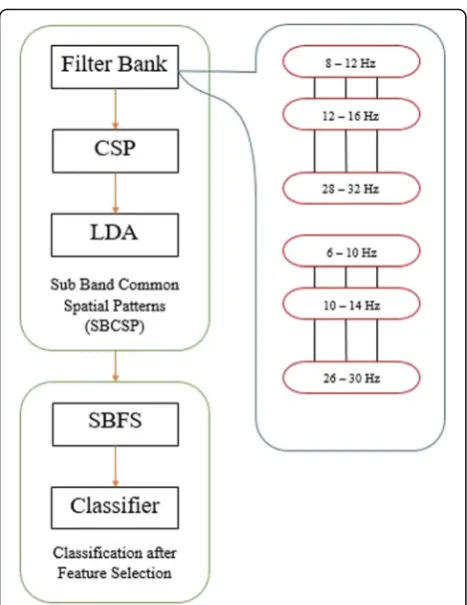
In this section, the proposed methodology implemented to classify multiclass motor imagery EEG signal is presented. The complete block diagram is shown in Fig.1. In the first stage, preprocessing is done using a filter bank by decom-posing EEG signal into sub-bands. In the second stage, CSP is applied to every bandpass filtered signal. Then LDA is applied to these features to acquire scores which represent the classification capability of every frequency band. The third stage involves feature extraction in which SBFS is
Table 1Comparison of related work in literature
Author No. of channel Dataset Feature extraction
22 Dataset 2a, BCI Competition IV CSP MIBIF Binary class SRLDA 85%
Multi class 74%
Shiratori et al. (2015) [17]
15 Dataset acquired by themselves from 8 healthy subjects
Motor imagery 56.7 ± 4.4%
Yong and Menon, (2015) [19]
32 Dataset acquired by themselves from 12 healthy persons
32 Dataset acquired by themselves from 9 healthy persons
60 Dataset IIIa open BCI competition
STFT and CSP – FP2 channel SVM 78.3%
C4 channel 88.1%
She et al. (2015) [22] 22 Dataset 2a, BCI competition IV CSP – Multiclass SVM 48.4%
NBPW 53.8%
NBPW along FBCSP
59.3%
PPTSVM 62.4%
Gao et al. (2016) [23] 64 Dataset acquired by themselves from 10 healthy subjects
22 Dataset 2a, BCI competition IV CSP – Multiclass Data
8 and 14 Wet gel rlectrodes and Emotiv Epoc
SBCSP SBFS Emotiv Epoc NBPW 60.61%
Wet gel electrodes
implemented to pick out the most effective features from all of the sub-band features resulted via LDA. This feature selection is carried out on the basis of best accuracy of the classifier for specific combinations from extracted sub-band features. Finally, three classifiers, i.e, SVM, KNN, and NMPW are applied for training and testing of the proposed system. EEG processing blocks of the proposed model are explained in the following section.
2.1 Bandpass filtering by overlapping filter bank
For preprocessing, filter bank having each bandpass filter is implemented instead of applying one wide bandpass filter of 8–30 Hz on raw EEG signal. The proposed filter bank in-cludes 12 filters of two distinct categories having unique frequency edges between 6 and 32 Hz. Every category in filter bank has 6 filters, and cutoffs of the filters in every category are different in a manner that there is an overlap-ping of 2 Hz between frequencies of both categories. One filter bank category has a gap of 4 Hz in a range of 8 to 32 Hz, at the same time another category has also a gap of 4 Hz ranging from 6 to 30 Hz. The overlapping of 2 Hz helps to avoid the possible information loss between two con-secutive bands.
2.2 Feature extraction by common spatial pattern and linear discriminant analysis
Common spatial pattern (CSP) is applied after filter bank in order to extract the features which are utilized for classification of multiclass data. It yields excellent outcomes by means of extracting considerable EEG fea-tures for MI-based signal. The goal of CSP is to grasp the spatial filters for maximizing the converted data vari-ance ration among distinctive classes in EEG data. Basic-ally, CSP is used for a binary class problem, but in the proposed approach, it is used for the multiclass problem by using one-vs-rest (OVR) algorithm.
Multiclass EEG data is generally assumed to be cen-tered without generality loss, i.e., Ej, 1, Ej, 2, and Ej, n. Shape of the acquired data matrix represents “channels by number of samples,” where j = unique trail in data. For‘n’classes, Eq. (1) can be used to compute the com-posite spatial covariance matrixE.
E¼X
Mn
j¼0
Ej;nETj;n ð1Þ
Where,Mn= All trials in‘n’classes
n¼1;2……n
Here, the classification of three classes is done; therefore,
n= 3 results three covariance matrices, i.e., E1, E2and E3 which results in the composite covariance matrix, i.e.,E=
E1,E2andE3. This matrix is further factored by using (2).
E¼P0∂PT0 ð2Þ
Where, P0 = L × L unitary matrix of principal
components
∂=L×Ldiagonal matrix of eigenvalues
The major goal of CSP is to find transformed data variance between distinct multiclass data which is com-puted by using (3)
maxsW sð Þ ¼s TE
c1s sTE
c2ss:t: s
k k2¼1 ð3Þ
Where,W(s) = Rayleigh quotient maximization
s= Spatial filter
‖s‖2= then2normal
Ec1= Covariance matrix of class 1
Ec2= Covariance matrix of class 2
The solution of the generalized eigenvalue Eq. (4) re-sults inW(s).
X
1s¼λ
X
2s ð4Þ
Finally, from the learned spatial filter matrix‘S’, the ei-genvectors are calculated to compute the projection of an EEG signal using Eq. (5).
Pn¼STn G ð5Þ
Where
P= EEG signal’s CSP projections matrix
S= Learned spatial matrix G = EEG signal
After CSD, sub-band scores are generated by applying LDA which are then used as features. These features are computed by using the projection matrix that guarantees maximum separability by maximizing the ratio of the variance between and within different classes [21]. The cost function for the projection matrix is generated by LDA using Eq. (6).
Where, C = cost function for LDA projection matrix
of EEG signal
Slda= Projection matrix generated by LDA
VB= Variance among MI-based right and left hand classes
VW= Variance within MI-based right or left hand classes
VBandVWare calculated by (7) and (8) respectively.
VB¼ðf2−f1Þðf2−f1ÞT ð7Þ
Wheref1andf2represent means of CSP computed fea-tures for empirical classes. Finally, the one-dimensional score by LDA can be calculated by (9). These scores are then sent to the feature selector.
O¼STldazp ð9Þ
2.3 Feature SBFS
Optimal features are selected using selection using se-quential backward floating selection (SBFS). It is a feature selection technique which selects among all the provided features in such a way that the overall performance of the system could be improved. For example,‘k’ optimal fea-tures are selected from‘n’total features in a way that the performance of the classifier should be maximized due to selected features. Let us assumeFis a set of all features,
F¼ff1;f2;……;fng
If ‘F’set is given to the SBFS technique as input then the selection of set‘P’(set of output features) is done in such a way that, first of all, the classifier will be trained on all of the provided features, i.e., set ‘F.’ In the next iterations, those features are removed from the input set which causes the low average accuracy of the system. These iterations for feature elimination are carried out until the ‘k’ number of features is not obtained. Once
the iterations are finished, then the set ‘P’ (a subset of
‘F’) containing‘k’selected features is returned.
P¼ pjjj¼1;2;……;k;pj∈B
n o
wherek ¼ð0;1;2;……;n−1Þ
2.4 Classification
After feature selection, the classifier is trained which es-timates the accuracy of the system by predicting each class label from the testing model. The classifiers used in the proposed methodology are explained in this section.
2.5 SVM
Support vector machine (SVM) is called the supervised technique of machine learning because it requires la-beled training dataset. It acts as a linear classifier be-cause it draws a separating line known as hyperplane between data samples of different classes in a dataset. For margin maximization of training data, measurement of an optimal hyperplane is the goal of SVM. Hyperplane can be calculated by equation (10),
vTy¼0 ð10Þ
Wherevandy= vectors containing EEG samples As the hyperplane is a line which separates different classes in data, the equation for hyperplane is the same as the equation of a line which can be calculated by the dot product ofvandywhere
v¼
Once the hyperplane is computed then the distance among hyperplane and the closest data sample is calcu-lated, which is known as margin value. Double of the cal-culated margin value is known as margin, no data sample occurs in this region. After hyperplane calculation, the classifier is considered ready for classification purpose. Now, when a test data is passed through the trained classi-fier it calculates the distance of the data sample from the margin. Then that class label is assigned to the data from which the computed distance is nearest.
2.6 KNN
samples. Euclidean distance is used as the most popular way to find the distance between the data samples. The equation for this method is
d p;ð p0Þ ¼
ffiffiffiffiffiffiffiffiffiffiffiffiffiffiffiffiffiffiffiffiffiffiffiffiffiffiffiffiffiffiffiffiffiffiffiffiffiffiffiffiffiffiffiffiffiffiffiffiffiffiffiffiffiffiffiffiffiffiffiffiffiffiffiffiffiffiffiffiffiffiffiffiffiffiffiffiffiffi
p1þp01
ð Þ þðp2þp02Þ þ…þ pnþp0n
q
Þ ð12Þ
The algorithm is also known as lazy learning algorithm because it refers to the decision to generalize the training data samples until a new query is faced. The major
assumption of this algorithm is that the class probabilities are locally constant approximately, so it is one of the sim-plest machine learning algorithms.
2.7 NBPW
Naïve Bayesian Parzen window (NBPW) is a fast classifica-tion algorithm as compared to other classificaclassifica-tion algo-rithms which follow the principle of Bayes theorem of probability. A major assumption in this algorithm is that one feature in the data does not relate to any other feature. As NBPW is based on Bayes theorem which provides the methodology to calculate posterior probability P (a | y) fromP(a),P(y) andP(y|a) using Naive Bayesian equation
P að jyÞ ¼P yð jaÞP að Þ
P yð Þ ð13Þ
Where
a= target class
y= predictor
P(a|y) = posterior probability
P(a) = prior probability of class
P(y) = prior probability of predictor
P(y|a) = probability of predictor given class
The working principle of NBPW is that, firstly the dataset is converted into a frequency table then prob-abilities are computed to create a likelihood table. In the end, the posterior probability is computed by using the naïve Bayesian equation.
3 Results and discussion
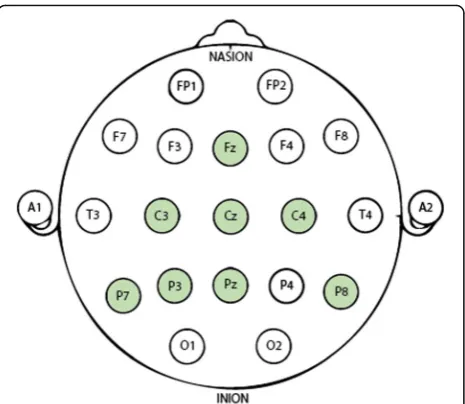
For the evaluation of the proposed system, results are validated on two different datasets i.e., dry and wet gel Fig. 2Electrode placement according to 10–20 electrode system.
Different electrode placement positions where the electrodes are placed for EEG data acquisition are shown in this picture. The shaded ones represent the electrodes that are used to acquire EEG data for this study
electrodes. Dry electrodes consist of Emotiv Epoc which is a 14-channel device with 128 Hz sampling fre-quency, whereas, wet gel electrodes consist of 8-channel EEG device and data was sampled at 256 Hz. Figure 2 shows the 10–20 electrode system used for placement of wet gel electrodes. EEG signals were ac-quired for three distinct MI tasks (neutral, the imagin-ation of left and right-hand movements). The subjects were instructed to stay calm and imagine their hand movements according to different stimulus shown on the screen. For each trial of 8 s,“blank screen”for 4 s,
“+sign” for 2 s, and a “specific stimulus” for 2 s were shown on the screen. In each session, there were 240 trails, i.e., 80 trials for each task. Figure 3 shows the scheme used for data acquisition used for acquisition of both datasets. EEG data of those electrodes which add eye artifact data in the whole dataset (i.e., electrodes placed at frontal lobe) are not included so that noise could be minimized.
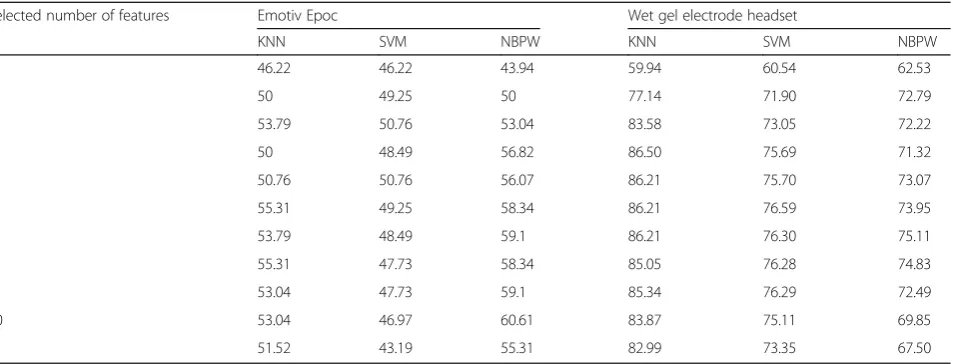
After preprocessing by filter bank, 12 features are extracted from CSP and LDA. Optimal features are then selected from these extracted features. Then the accuracy
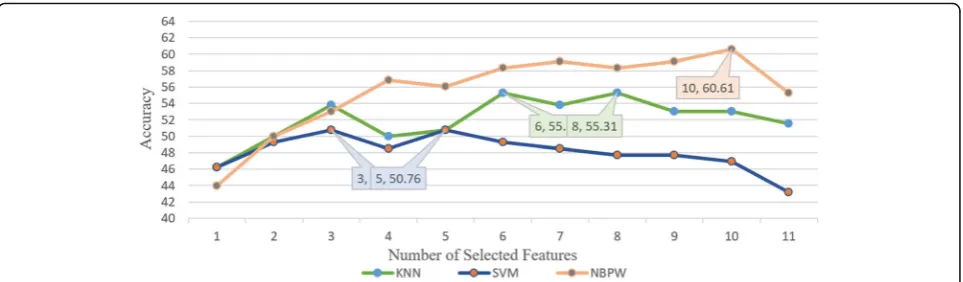
of the system is compared for different classifiers (i.e., SVM, KNN & NBPW) by varying number of selected fea-tures. Figures 4 and 5 show a graphical comparison for the accuracy results of cross-validations performed on proposed model with various classification algorithms. For dry electrodes, the proposed approach shows a maximum accuracy of60.61%for 10 selected features with NBPW as classifier as shown in Figure 4. In the case of SVM and KNN, maximum system output is 55.31% and 50.76% which are resulted for 6 and 3 selected features respect-ively. Figure 5 shows that for MI-based EEG signals
ac-quired using wet gel electrode, a maximum of 86.50%
accuracy is yielded. This accuracy resulted for four se-lected features with KNN as a classifier. For the same dataset, the maximum system output for SVM and NBPW is 76.59% with 6 selected features and 75.11% with 7 se-lected features respectively. Table 2 provides a tabular comparison of the accuracy of the proposed model for dif-ferent selected features on SVM, KNN, and NBWP classi-fiers for both dry and wet gel electrodes.
The proposed system yields 7% increase in accuracy as compared to literature which shows that the use of filter Fig. 4Graphical comparison of accuracies by different classifiers for Emotiv Epoc dataset. This figure represents the graphical representation of calculated results for EEG dataset acquired by using Emotiv Epoc headset. These results are computed by varying number of selected features for three different classifiers. The gradual increase in the accuracies shows the importance of classifier
bank, optimal feature selection, and classifier in the pro-posed methodology has a remarkable influence on the classification accuracy of the system. The results for Emotiv Epoc dataset shows that NBPW produces better results than SVM and KNN with the proposed model but for wet gel electrode dataset, KNN outperforms in comparison to SVM and KNN.
4 Conclusion
This paper presents a framework for the classification of multiclass MI-based EEG signals. In the proposed model, results were evaluated on two different headsets. The proposed methodology shows a maximum of
60.61% and 86.50% accuracy for classification of motor
imagery signals by using Emotiv Epoc and wet gel elec-trode headset respectively. The overall performance of the system shows a 7% increase in accuracy than previ-ously used techniques for multiclass EEG classification. The results show that the use of overlapped filter bank, optimal feature selection, and classifier for multiclass classification have the capability to control BCI applica-tions and can be tested for controlling BCI applicaapplica-tions in the real world. Currently, further research is being done on the improvement of results by optimal channel selection.
Abbreviations
Adaboost-ELM:Adaboost extreme learning machine; BCI: Brain-computer interface; CSP: Common spatial pattern; EEG: Electroencephalogram; FBCSP: Filter bank common spatial pattern; FFDIAG: Fast Frobenius Diagonalization; JAD: Joint approximate diagonalization;Kc: Kolmogorov
complexity; KNN: k-nearest neighbor; LDA: Linear discriminant analysis; MI: Motor imagery; MIBIF: Mutual-information best individual features; NBPW: Naïve Bayesian Parzen window; RF: Random forest; SBCSP-SBFS: Sub-band common spatial patterns with sequential feature selection; SBFS: Sequential backward floating selection; SRIT2NFIS: Self-regulated interval type2 neuro fuzzy inference system; SRLDA: Stacked regularized linear discriminant analysis; STFT: Short-time Fourier transform; SVM: Support vector machine
Acknowledgements
We would like to acknowledge our subjects who helped us with EEG data acquisition.
Authors’contributions
JK participated in the development of the proposed design and its implementation, coordinated in the study, and helped out for document drafting. MH participated in the EEG data acquisition, design and implementation of the proposed study, and drafted the manuscript. UGK supervised, coordinated, and helped out for study and manuscript draft completion. RI supervised the study and helped out for manuscript draft completion. All authors read and approved the final manuscript.
Authors’information
Not applicable.
Funding
Not applicable.
Availability of data and materials
The data and materials used in this study are not publicly available. EEG data acquisition requires a lot of resources and work, i.e., EEG device and trained staff for headset placement. As the authors have acquired EEG data on their own by bearing all costs therefore, they have copyrights. But data can be provided on request with proper reason on email and with permission of Dr. Usman Ghani Khan.
Competing interest
The authors declare that they have no competing interests.
Author details
1Al-khawarizmi Institute of Computer Science, University of Engineering and
Technology, Lahore, Pakistan.2Department of Computer Science, University
of Engineering and Technology, Lahore, Pakistan.
Received: 6 March 2019 Accepted: 24 June 2019
References
1. M.A. Jatoi, N. Kamel, A.S. Malik, I. Faye, T. Begum, Biomed. Signal Process. Control (2014)
2. L. Bi, X.-A. Fan, Y. Liu, IEEE Trans. Human-Machine Syst.43, 161 (2013) 3. T. Ball, M. Kern, I. Mutschler, A. Aertsen, A. Schulze-Bonhage, Neuroimage46,
708 (2009)
4. B. Zhang, J. Wang, and T. Fuhlbrigge, in 2010 IEEE Int. Conf. Autom. Logist. (IEEE, 2010), pp. 379–384.
5. T. Alexandra-Maria, V. Mihajlovic, Y.-H. Chen, B. Grundlehner, J. Penders, S. Wouter,Biodevices(2014), pp. 12–22
6. A.B. Usakli, Comput. Intell. Neurosci.2010(2010) Table 2Comparison of results for different selected features, classifiers, and datasets
Selected number of features Emotiv Epoc Wet gel electrode headset
k KNN SVM NBPW KNN SVM NBPW
1 46.22 46.22 43.94 59.94 60.54 62.53
2 50 49.25 50 77.14 71.90 72.79
3 53.79 50.76 53.04 83.58 73.05 72.22
4 50 48.49 56.82 86.50 75.69 71.32
5 50.76 50.76 56.07 86.21 75.70 73.07
6 55.31 49.25 58.34 86.21 76.59 73.95
7 53.79 48.49 59.1 86.21 76.30 75.11
8 55.31 47.73 58.34 85.05 76.28 74.83
9 53.04 47.73 59.1 85.34 76.29 72.49
10 53.04 46.97 60.61 83.87 75.11 69.85
7. P. Sarma, P. Tripathi, M.P. Sarma, K.K. Sarma, ADBU-Journal Eng. Technol. Sarma5, 2348 (2016)
8. I. Xygonakis, A. Athanasiou, N. Pandria, D. Kugiumtzis, P.D. Bamidis, Comput. Intell. Neurosci.2018, 1 (2018)
9. F. Lotte, C. Guan, IEEE Trans. Biomed. Eng.58, 355 (2011)
10. Q. Novi, C. Guan, T.H. Dat, P. Xue, Proc. 3rd Int. IEEE EMBS Conf. Neural Eng.
204(2007)
11. K.K. Ang, Z.Y. Chin, H. Zhang, C. Guan, 2008 IEEE Int. Jt. Conf. Neural Networks (IEEE World Congr. Comput. Intell.)2390(2008) 12. H. Higashi, T. Tanaka, IEEE Trans. Biomed. Eng.60, 1100 (2013)
13. Y. Zhang, G. Zhou, J. Jin, X. Wang, A. Cichocki, J. Neurosci. Methods255, 85 (2015)
14. S. Kumar, A. Sharma, T. Tsunoda, BMC Bioinformatics18, 545 (2017) 15. K.K. Ang, Z.Y. Chin, C. Wang, C. Guan, H. Zhang, Front. Neurosci.6(1) (2012) 16. L.F. Nicolas-Alonso, R. Corralejo, J. Gomez-Pilar, D. Álvarez, R. Hornero, IEEE
Trans. Neural Syst. Rehabil. Eng.23, 702 (2015)
17. T. Shiratori, H. Tsubakida, A. Ishiyama, and Y. Ono, 3rd. Int. Winter Conf. Brain-Computer Interface, BCI 2015 3 (2015).
18. A. Mammone, M. Turchi, N. Cristianini, Adv. Rev.1, 283 (2009) 19. X. Yong, C. Menon, PLoS One10(1) (2015)
20. F. Shiman, E. López-Larraz, A. Sarasola-Sanz, N. Irastorza-Landa, M. Spüler, N. Birbaumer, A. Ramos-Murguialday, J. Neural Eng.14(2017)
21. J. Pylkkönen, P.A. Conf, Int. Speech Commun. Assoc. INTERSPEECH1, 389(2006) 22. Q. She, Y. Ma, M. Meng, Z. Luo, Comput. Intell. Neurosci.2015(2015) 23. L. Gao, W. Cheng, J. Zhang, J. Wang, Rev. Sci. Instrum.87, 1 (2016) 24. W. Chmielnicki, K. Stąpor, Int. J. Appl. Math. Comput. Sci.26, 191 (2016) 25. H. Meisheri, N. Ramrao, and S. Mitra, (2018).
26. X. Shi,Blind Signal Process(Springer, Berlin Heidelberg, Berlin, Heidelberg, 2011), pp. 175–204
27. S.R. Liyanage, J.X. Xu, C.T. Guan, K.K. Ang, T.H. Lee, Proc. Int. Jt. Conf. Neural Networks (2010)
28. S. Ge, R. Wang, D. Yu, PLoS One9, e98019 (2014)
29. A. Bablani, D.R. Edla, S. Dodia, Procedia Comput. Sci.143, 242 (2018)
5 Publisher’s Note