R E S E A R C H
Open Access
Market segmentation of wireless sensor
system in network commodity selection
Fuxiang Liu
Abstract
Online product recommendation and market segmentation are directly related to the consumer experience and the healthy development of the e-commerce market. In order to improve the selection of network products and the effect of market segmentation, this study introduced a wireless sensing system based on the recommendation of traditional network products and combined the operational conditions of the network commodity market to construct a personalized recommendation e-commerce system. Meanwhile, a series of representative WSN congestion control strategies are designed by dynamically adjusting the network topology, routing algorithm, channel allocation protocol, and channel resource utilization, and the system structural components and functions are implemented. The research shows that the proposed algorithm and system have certain practical effects and can provide theoretical reference for subsequent related research.
Keywords:Wireless sensing system, Network commodity, Application, Market segmentation, Commodity selection
1 Introduction
Similar to shopping on e-commerce sites, many organiza-tions are now launching online product recommendation services. Faced with a large number of online products, how to choose the most suitable product recommendation service for users is the key research direction of e-commerce development. In the e-e-commerce website, the user’s interest and preferences are predicted by collecting and analyzing the user’s purchase record, browsing history, and other related information, thereby recommending the products that he may be interested in [1]. Similarly, the user-specific intelligent push system proposed in this paper will focus on how to intelligently push suitable online com-modity services for users. In this system, the user profile data collected in the Internet of Things and some other personal information of the user will be combined with the idea of data mining to analyze the health services and com-modities required by the target users, and finally push the recommendation results to the user browsing interface.
In the e-commerce industry, providing products ac-cording to customer needs and enabling customers to easily find the products they want to buy is the key to gaining competitive advantage. The practice of foreign
e-commerce enterprises shows that category managment is a very effective managemanagment method for e-commerce enterprises to gain competitive advantage and increase market share. Although category management has only been born for 20 years, the effectiveness of cat-egory management has attracted the interest of many domestic and foreign scholars. Through continuous practice and research, many representative viewpoints have been proposed. Fader and Lodish [2] found that consumer characteristics such as the frequency of pur-chase have a certain explanatory power for the pricing and promotion environment of supermarket goods. Hoch [3] and others studied the relationship between the market price elasticity of various commodities and the demographic characteristics of customer groups. Raiu [4] studied the difference in sales of different types of goods and established its relationship with category characteristics and marketing groups and variables. The results of Poel [5] and others show that the complemen-tarity between commodities is directly proportional to the interaction of promotions. These studies strongly support the rational identification of commodity classifi-cation theories based on consumer demand. Compared with European and American countries, China’s research is later. In 1997, the Hong Kong Supply Chain Manage-ment Advisory Committee was established, and the
© The Author(s). 2019Open AccessThis article is distributed under the terms of the Creative Commons Attribution 4.0 International License (http://creativecommons.org/licenses/by/4.0/), which permits unrestricted use, distribution, and reproduction in any medium, provided you give appropriate credit to the original author(s) and the source, provide a link to the Creative Commons license, and indicate if changes were made.
Correspondence:[email protected]
category management experiment was carried out. Then, the Taiwan area was actively promoted. The category management in the mainland is promoted by the China ECR (Efficient Consumer Response) committee estab-lished in 2001. Zhang Hongxia and Zhang Songjie [6] first analyzed the significance, basic steps, and key fac-tors of product category management in category man-agement in 1999, and the application prospects of category management are promising. He Yun [7] dis-cussed the optimization management of category, and he believes that the purpose of the optimization manage-ment of the real category is to make the shelf most valu-able, and the product portfolio placed on the shelf is the customer’s favorite product. Xia Weichao [8] deeply ana-lyzed the relationship between satisfying customer needs and supplier management and believed that category management should be based on category accounting, which is designed to meet consumer needs and manage suppliers’new management methods. Wu Zikai [9] em-phasized the importance of category tactics.
On the whole, the focus of the above research is differ-ent. It provides a reference for the research of the cat-egory management model from various angles, which is very helpful for the next step. In the enterprise manage-ment category managemanage-ment process, because there is no corresponding category management software system to help enterprises to manage the process, system, and actualization, the enterprise lacks effective information technology support, which leads to the time-consuming and unsatisfactory decision-making process of the egory management decision-making process. The cat-egory management model system is a business information management system. From the perspective of developed countries, the business information man-agement system is divided into six stages: automatic settlement management of cash registers, sales analysis management of POS machines, inventory management, storage and transportation management, integrated management, data warehousing, and data mining [10]. In other words, the computer information management system can be roughly divided into three levels: one is the POS system, the second is the point-of-sale sales management system, and the third is the decision sup-port system [11]. At present, domestic supermarket en-terprises have realized the coverage of POS machines and can monitor the sales situation, inventory situation, and storage and transportation situation of goods in real time, and can monitor and dynamically manage the quantity, location, and price of goods. That is to say, the computer management system of most supermarket re-tail enterprises still stays in the collection of basic data. However, with the improvement of marketing manage-ment level, the current point-to-point sales service of the system can no longer meet the needs of supermarket
managers. Therefore, managers want the system to auto-matically analyze sales data, mine customer preferences, and provide decision support. However, in practice, en-terprises lack confidence in information systems, and they believe that information systems cannot solve the practical problems of category management. As a result, companies are struggling to deploy a category manage-ment system. On the other hand, it can be seen in the enterprises that have already been implemented that based on the information management software cur-rently used, most enterprises can collect basic internal data required for category management. However, the system has not been used in the analysis of data or does not have the ability to analyze data and report data re-quired by category management [12].
In summary, current network products require a cat-egory management software that meets the actual char-acteristics. The software provides systematic and scientific services that improve the relationship between suppliers and retailers, improve customer satisfaction, reduce costs, and increase profits.
2 Classical congestion algorithm of wireless sensor networks
WSN is a wireless network with no data center, its nodes form a network through white organization and adap-tive, and there is no control center. In order to improve the quality of network services and prolong the service life of the network, based on the above-mentioned causes of congestion caused by WSN, researchers around the world have designed a series of representa-tive WSN congestion control strategies by dynamically adjusting network topology, routing algorithms, and introducing channel allocation protocols to improve channel resource utilization [13].
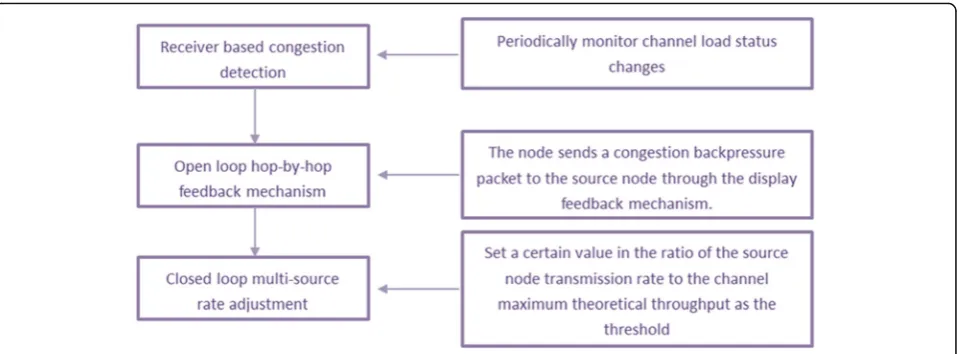
2.1 CODA
Congestion detection avoidance (CODA) also known as congestion prediction and avoidance algorithm, is a clas-sic WSN congestion control scheme. The program is mainly divided into three major operational mechanisms (Fig.1) [14].
performance) and fairness, and the channel sensing also consumes a lot of energy [15].
2.2 ESRT
Event-to-sink reliable transport (ESRT) is a reliable event transmission protocols. The congestion control strategy of ESRT realizes the reliability of network data transmission and the effectiveness of congestion control by changing and transforming the network state. The sensor nodes and the aggregation nodes in the network directly transmit data. The ESRT acts on the SINK node to obtain the network congestion detection by adjusting the network transmission status to obtain the source node transmission rate, and the number of packets re-ceived by the aggregation node in each period deter-mines the reliability of the network transmission. The ESRT congestion control policy operation relies on the following five network states: Reliability statesR= (LR, HR), network congestionC= (NC,C)
S¼RTC
network states Si∈{(LR, NC), (LR, C), (HR, NC), (HR, C), OOR}, LR—low reliability, HR—high reliability, NC—no congestion, C—congestion, and OOR—best state. The ESRT strategy can guarantee the reliability of the network and the quality of network services. How-ever, the SINK node communicates directly with the source node and does not support multi-hop clustering routing and topology mechanisms and is not suitable for large wireless sensor networks [16].
2.3 Congestion control strategy of adaptive resource
When detecting that the network is in a congested state, waking up the dormant node (increase network re-sources), changing the network topology, and forming a multi-emission route can alleviate the many-to-one data
transmission mode, and achieve network congestion cancellation through multi-channel communication. After the congestion is released, the node without data transmission continues to sleep (reducing network re-sources), and the multi-route and multi-channel com-munication modes are released. The algorithm improves energy utilization, extends network lifetime, and ensures network stability and OOS performance.
2.4 DCCP-data packet congestion control protocol
The DCCP congestion control protocol establishes, maintains, and disassembles the reliable handshake ne-gotiation mechanism at both ends and users can adopt different congestion control mechanisms according to different applications. Different congestion control pol-icies are described by the congestion control flag (CCID), and CCID2 implements congestion mitigation and release by adopting a cache queue date packet of a drop node similar to the AIMD protocol. CCID3 imple-ments congestion control by adjusting the transmission rate of source node data, which is similar to the TFRC protocol. However, the DCCP protocol cannot guarantee the high reliability of the network. The high bit error rate leads to an increase in network data packet loss rate and reduces the throughput of the DCCP congestion control protocol.
2.5 An algorithm for avoiding node congestion in line sensor networks
The strategy adopted by the algorithm is to allocate the congestion avoidance of the sending window to the source node and to set the priority for the data packet scheduling. The upstream node allocates a transmission window for the downstream node according to a certain policy, and the node sets the priority for the data packet in the cache queue, and the data packet with the highest priority is al-ways transmitted in the effective transmission window.
Although the algorithm effectively achieves congestion avoidance and improves energy utilization and improves the fairness of network transmission and reduces network transmission delay, it still lacks efficient congestion detec-tion mechanism and time synchronizadetec-tion algorithm for end-to-end data transmission.
2.6 COMUTl is a cluster-based data traffic congestion control algorithm
During the operation of the COMUT, the node detects its own data transmission traffic and reports it to the cluster head node within a certain time interval. The cluster head node determines whether the local traffic is greater than the threshold according to the received data. If it is greater than the threshold, the AIMD mechanism is used to adjust the transmission rate of the upstream node to implement congestion control and release. This algorithm affects the stability of network throughput and improves data trans-mission delay [17].
Based on the specific application scenarios, these algo-rithms establish an efficient WSN congestion control strat-egy system for congestion detection, congestion avoidance, and congestion cancellation.
(1) Nodes close to the SINK node area are used as relay nodes for network-wide data transmission and become
“hot spots”for power consumption and congestion. (2) Due to the limited bandwidth of nodes and the low level of end-to-end communication links, network congestion may occur in some cluster head nodes or common nodes.
3 Congestion control strategy based on CCBDC-RSUL algorithm
This paper is a wireless sensor network model based on clustering topology. In the case of a sudden increase in data volume, it is easy to cause two phenomena of in-cluster and cluster head congestion and cluster head congestion in SINK area. For the problem of congestion in the intra-cluster, a sub-cluster head VCH (Vice Cluster Head) is se-lected in the non-cluster head node CM to share the data stream for the cluster head node CH, and the congestion in the intra-cluster can be implemented. For the problem of inter-cluster congestion (SINK area congestion problem), the network area is non-uniformly layered, and the dor-mant nodes near the congested nodes are awakened and become cluster heads. Then, the two major strategies of the LEMPT optimized communication path implement inter-cluster congestion cancellation.
The network determines whether it is in a congested state by using periodic congestion detection. If conges-tion is not detected in the period, it enters congesconges-tion detection in the next network period. If a congestion trend is detected, the network determines whether the congestion is intra-cluster or inter-cluster by the size of theP. WhenP∈(0, 0.5) is detected, the network is in an
intra-cluster congestion state, and the clustering-based data traffic congestion control algorithm (COMUT) al-gorithm is used in the intra-cluster to obtain the sub-cluster head (VCH). Moreover, the nodes in the intra-cluster choose which intra-cluster head to join according to the minimum value of the communication link energy consumption and update the node route to clustered. After that, it is judged whether there is congestion of inter-cluster. If there is, it will enter the inter-cluster congestion control link, otherwise it will detect whether the congestion is released. If it is judged that the work is in a state of inter-cluster congestion, the net-work is first non-uniformly layered, and a LEMPT tree-like optimization path is established between the clusters and the cluster head. Next, it is checked whether con-gestion has been alleviated or released. If the concon-gestion is not alleviated, the node (CM) that is adjacent to the congestion cluster head (CH) and has the highest energy is awaked and become the cluster head, and the LEMPT is updated. After that, it is detected whether the tion is released. If it is not released, it enters the conges-tion control loop again, and if congesconges-tion has been removed, the congestion control resource is deleted [18]. According to the congestion detection of the network by combining the queue length of the node buffer and the congestion degree, it can be seen that when Bp1<
Bp≤Bp2∩(C(n) > 1) or Bp>Bp2, the network CH node
will be congested, and the congestion control link needs to be entered. The congestion type is determined ac-cording to the ratio P from the intra-cluster data traffic to the inter-cluster data traffic. When the data traffic from the cluster is much larger than the data traffic from the cluster, it is determined that the congestion belongs to intra-cluster congestion; when 0 <P< 0.5, the data traffic from the inter-cluster is much larger than the data traffic from the inter-cluster, and the congestion is de-termined to belong to intra-cluster congestion. When 0.5≤P≤1.5, the network is judged to be intra-cluster and inter-cluster congestion. In both cases, the network must first enter the congestion control phase in the intra-cluster.
We divide the nodes of the whole network into im-portant, minor and general three levels according to their priorities. The areas where the node timers ran-domly select the set values are sequentially increased. The division of each area is shown in equation (1) [19]:
According to the principle of formula (1), the set value is randomly selected for each node timer, and if the node data times out in the node cache queue, the node becomes a VCH.
In the clustering process of nodes, the coordinates of CH are (xch,ych), the coordinates of VCH are (xvc,
yvc), and the coordinates of CM are (xi,yi). The principle of adding the corresponding cluster heads and clustering is shown in Eqs. (2), (3), and (4).
di−ch¼
ffiffiffiffiffiffiffiffiffiffiffiffiffiffiffiffiffiffiffiffiffiffiffiffiffiffiffiffiffiffiffiffiffiffiffiffiffiffiffiffiffi
ðxi−xchÞ2þ ðyi−ychÞ2 q
(2)
di−vch¼
ffiffiffiffiffiffiffiffiffiffiffiffiffiffiffiffiffiffiffiffiffiffiffiffiffiffiffiffiffiffiffiffiffiffiffiffiffiffiffiffiffi
ðxi−xvcÞ2þ ðyi−yvcÞ2 q
(3)
Ui¼ Uch;di−ch<di−vch Uvch;di−vch<di−ch
ð4Þ
In formula (4), Uch denotes a cluster set with CH
as a cluster head, U denotes a cluster set with VCH as a cluster head, and Ui denotes a node element within the cluster. di-ch and di-vch respectively
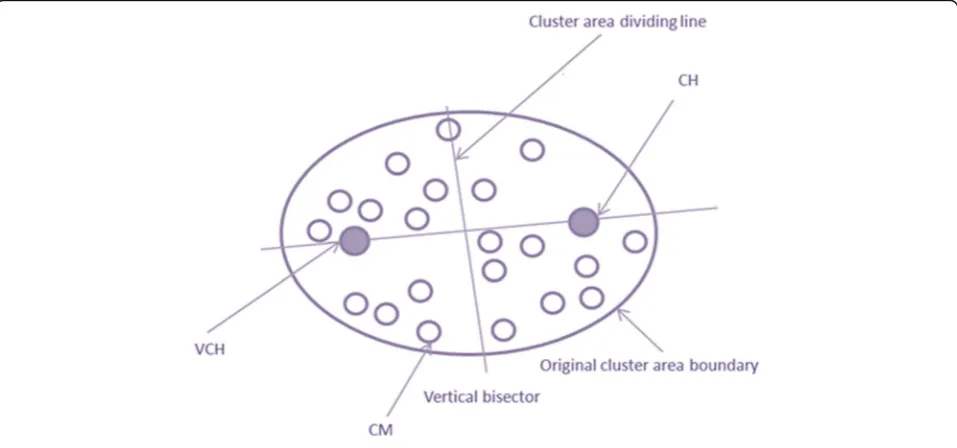
repre-sent the distance between the nodes CM to CH and VCH. The two cluster regions are segmented as shown in Fig. 2 [20].
First, the distances di−ch and di−vch of the nodes i
to CH and VCH in the cluster are respectively deter-mined, and the sizes of the two are determined. Which of the distance values is small, then node i is added to the cluster head. If the distance between the two is equal, the remaining energy of the two cluster heads is judged, and the node i is added to the clus-ter head with the larger remaining energy.
When (Bp1<Bp≤Bp2)∩(C(n) > 1)∩(P> 1.5) or Bp>
Bp2∩(P> 1.5), network congestion belongs to
inter-cluster congestion, and the network directly enters the inter-cluster congestion control phase.
When (Bp1<Bp≤Bp2)∩(C(n) > 1)∩(0.5≤P≤1.5) or
Bp>Bp2∩(0.5≤P≤1.5), network congestion belongs to
cluster-to-cluster congestion.
After the network releases, the congestion within the cluster through intra-cluster congestion control, the network can enter the cluster congestion control phase (congestion mitigation and congestion cancellation).
Our work introduces the ULEE algorithm to achieve non-uniform stratification of the network, aiming to solve the “hot spot” problem near the SINK node area. Li Chengfa and others proposed the EEUC agreement, whose main ideas are: Since multi-hop communication between WSN clusters is used to realize data transmission between the cluster head and the SINK node and the nodes in the network are equivalent, the closer to the nodes in the SINK node area, the more data relay pressure is assumed. Fur-thermore, it is completed by introducing two major parameters of C and Rcmax.
For the non-uniform layered design of the network, the closer to the SINK node, the smaller the layer, the smaller the cluster size, and the fewer the number of nodes in the intra-cluster. By alleviating the load of data acquisition, processing, and transmission of nodes in the area, more energy and transmission re-sources are used for data relay transmission of the whole network, and congestion reduction is imple-mented by using UL (uneven layer). Formula (5) is
the formula for calculating the competition radius
is, the smaller the value ofc, the greater the difference be-tween the two.dmaxanddminare the maximum and
mini-mum values of the nodes to the BS in the WSN, respectively. The distance from nodesito the base station is d(si, BS), andRcmax is the maximum competition radius
of the node set by the network. The above algorithm lacks the theoretical derivation of each hierarchical boundary (node competition radius). Therefore, a theoretical deriv-ation method for obtaining the node competition radius by the energy consumption of each layer node is proposed. The energy consumption of each layer node is shown in Eq. (6). layer, kis the data packet size sent by each node, and R
is the average distance from the first layer to the sink node (base station). When En≈En−1≈ ⋯ ≈E2≈E1, the
competition radius of each layer node can be approxi-mated, thus dividing the network. The closer the net-work layer is to the base station, the smaller the area of the layer, that is, the fewer the number of nodes, the less the local energy consumption, and communication re-sources are occupied, so that more energy and commu-nication resources are used for relay transmission. After the network layering ends, the cluster head creates a LEMPT optimized path that passes through multiple hopskto all cluster heads in the network.
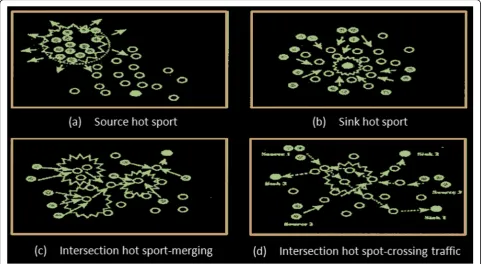
Topology-Aware Resource Adaptation to Alleviate Con-gestion in Sensor Networks (TARA) is shown in Fig.3
In the low-energy routing design, by controlling the minimum distancerminbetween the cluster head nodes,
the cluster head nodes can be evenly distributed in the network with the greatest possibility, and the variance of the cluster size is minimized. Therefore, the hot spot phenomenon in which cluster head nodes are too con-centrated in Fig.3ais unlikely to occur in the WSN net-work designed in this paper. Figure3dindicates that the cross-hotspots with overlapping traffic are unlikely to
occur in more obvious application occasions of various areas. Figure 3c shows the cross-hotspot situation of traffic surge, which is mainly caused by the fact that the number of child nodes (neighbor nodes) of some nodes is large due to multi-hop within the cluster. Since the node bandwidth is narrow and the number of available channels with small interference is small, the amount of cached data of the node is large. It is highly likely to cause loss and congestion caused by packet overflow and packet wait timeout, which is explained and resolved. Figure3b indicates a hot spot situation in the base sta-tion (sink node) area. The main reason for this phenomenon is that the network cluster head node transmits data to the base station based on multi-hop multi-path transmission. The nodes near the base station have to bear the energy consumption and communica-tion resources (channel allocacommunica-tion, occupacommunica-tion) pressure of data acquisition, processing, and transmission of nodes within the cluster. At the same time, it also bears the energy consumption of the relay transmission of al-most all network data between other cluster heads and the base station and the load of the communication resources.
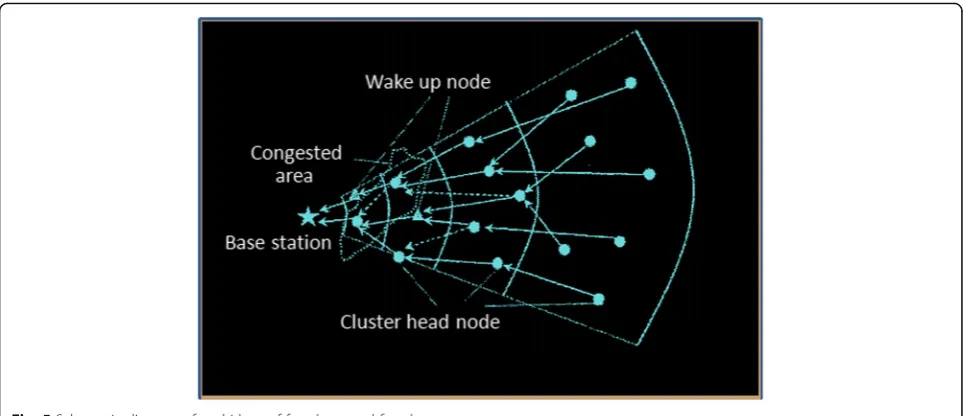
Figures4and5respectively show a schematic diagram of a communication model of a four-layer network and a two-hop inter-cluster and a communication diagram of a four-layer network and four-hop inter-cluster. The cluster head labeled by the triangle in the figure is the wake-up node. Some cluster head nodes need to accept and output more nodes’data. These nodes are consumed too much, and the link quality is degraded due to communication interference, which is likely to cause hot spot-congestion. To solve this problem, the base station becomes a cluster head by waking up the hot spot neighbor sleeping node, and the base sta-tion creates and updates the LEMPT path, and the newly added cluster head will be awakened and share part of the data traffic of the congested cluster head, which can largely alleviate or even cancel the network congestion.
4 Network commodity selection system based on wireless sensor system
On the server, the system deploys and adopts B/S three-tier architecture design, including data layer, functional layer, and presentation layer. Through layered design, each layer only needs to complete the functions of this layer and complete the functions provided for other layers, and the layers are independent of each other.
Figure6is a general structural diagram of the person-alized commodity intelligent push system described by this paper.
4.1 Presentation layer
product information, view personal feature informa-tion, view push services, and product information on the browser page.
4.2 Functional layer
According to the user’s personal information and col-lected feature data, the data mining related algorithm is used to process and recommend appropriate services and products to the user. After the user logs in to the
system, the calculated recommendation result is pushed to the interface browsed by the user.
4.3 Data layer
The system data layer mainly stores data information in the system. The data of the system includes (1) data re-lated to the user: user name, login password, personal information filled in, user personal health characteristic data collected by the wireless sensor network, and health
Fig. 4Schematic diagram of intra-clusters multi-hop of four-layer and two-hop
service and product information previously selected by the user. (2) Information related to services and com-modities. This type of information is mainly entered and maintained by the administrator in the background.
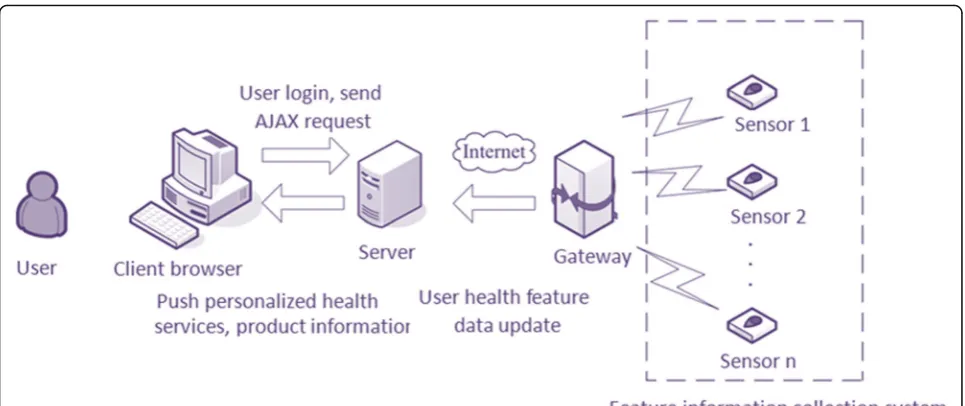
Figure 7 is a network architecture diagram of a con-sumer intelligent push system based on a wireless sens-ing system. The system mainly uses the idea of data mining to analyze and process the target user feature
data collected by the sensor terminal and obtain the set of neighboring users that are close to the target user sta-tus, and recommends the goods to the target users ac-cording to the products selected by other users in the past. Finally, the calculated and obtained recommenda-tion results are actively pushed from the server to the user browsing interface.
5 Analysis and discussion
The quality of wireless sensor network communication services is mainly affected by network congestion. Re-searchers often use a variety of metrics such as cache queue length, cache rate, throughput, packet loss rate, net-work transmission delay, and netnet-work efficiency. However, these metrics are based on different application environ-ments of wireless sensor networks. Therefore, there is al-ways no single metric that can systematically and comprehensively evaluate the network congestion com-pletely. In the general sense, network congestion means that the node accepts data packets faster than the sending rate, so that the data queue of the node buffer grows con-tinuously. Network congestion will cause data throughput to drop, loss rate to increase, transmission delay to in-crease, network energy consumption to inin-crease, and even more network failures and crashes.
Wireless sensor network congestion can seriously affect the reliability of network service quality (QOS) and data transmission, reduce energy utilization, and accelerate the decline of the network. Therefore, network congestion control strategy has become one of the key technologies in wireless sensor network design. While designing the network congestion algorithm, we must also consider the network transmission quality, dynamic adaptability, ro-bustness, energy utilization, timely prediction, network
Fig. 5Schematic diagram of multi-hop of four-layer and four-hop
congestion avoidance, and cancellation in different appli-cation scenarios. Each type of congestion control strategy uses congestion detection to achieve network congestion prediction and timely discovery, and further achieves net-work congestion mitigation through congestion avoidance. Finally, network congestion or local congestion elimin-ation is achieved through data transmission mode adjust-ment during congestion cancellation.
5.1 Congestion detection
In different application scenarios of the WSN, the con-gestion prediction of the network concon-gestion is often im-plemented by monitoring parameters such as the length and rate of the cache queue, the time at which the node CPU processes the data packet, the ratio of the data packet input rate, and the ratio of the packet processing or forwarding rate. In addition, congestion detection can be realized by monitoring parameters such as increased network packet loss rate, network delay time increase, channel communication load increase, or interference enhancement.
5.2 Congestion avoidance
After the WSN is discovered, the congestion control data packet is sent to the upstream node or directly to the node where the entire network is congested. The network has the following two types of congestion feed-back: one is that the sensor network generates conges-tion control packets and is sent directly to the congestion source node, and the other is that the sensor network uses the control packet or the congestion trol bit in the data packet and feeds back it to the con-gestion source node. After that, the concon-gestion source node judges the congestion state by receiving different
data packets or control packets, and then executes the corresponding congestion control strategy.
5.3 Congestion lifted
The upstream node that receives the congestion packet uses a series of congestion control methods to imple-ment congestion mitigation and release. In order to eliminate the congestion caused by the wireless link layer, WSN mostly adopts strategies such as optimizing the topology and introducing a wireless channel alloca-tion protocol such asCSMA/CA. For node-level network congestion, the congestion control strategy basically adopts methods such as reducing the data transmission rate or dropping the congestion data packet. In addition, some congestion control strategies are designed to achieve congestion mitigation and release by designing corresponding routing algorithms.
6 Conclusion
Wireless sensors are used to collect product information viewed by consumers. After late data processing and data mining, more potential information can be ob-tained, such as color preference and commodity turn-over rate. This information can provide data support, quantitative analysis, and effective estimates for the mer-chants to do the next marketing plan and strategy, store layout planning, and other initiatives. Moreover, this paper focuses on the wireless sensor network data acqui-sition system in the network commodity sales system and combines the operating conditions of the network commodity store to develop wireless sensor network hardware design, routing design, network congestion control strategy, database design, and construction. In addition, the system mainly uses the idea of data mining
to analyze and process the target user feature data col-lected by the sensor terminal and obtain a set of neigh-boring users close to the target user. After that, the target user is recommended according to the previously selected product status of other users in the neighbor-hood user group. Finally, the calculated recommendation results are actively pushed from the server to the user browsing interface.
Acknowledgements
The authors gratefully acknowledge the helpful comments and suggestions of the reviewers, which have improved the presentation.
Authors’contributions
All authors take part in the discussion of the work described in this paper.
Funding
This work was supported by Humanity and Social Science foundation of MOE of China (No.20171304).
Availability of data and materials
Please contact the corresponding author for data requests.
Competing interests
These no potential competing interests in our paper.
Received: 30 May 2019 Accepted: 20 August 2019
References
1. A. Hentati, E. Driouch, J.F. Frigon, et al., Fair and low complexity node selection in energy harvesting wireless sensor networks [J]. IEEE Systems Journal2017, 1–11
2. A. Al-Baz, A. El-Sayed, A new algorithm for cluster head selection in LEACH protocol for wireless sensor networks [J]. International Journal of Communication Systems31(1), 01–13 (2018)
3. F. Haleem, J. Huma, J. Bilal, et al., Analytical network process based optimum cluster head selection in wireless sensor network [J]. PLOS ONE
12(7), e0180848 (2017)
4. K. Nitesh, M. Azharuddin, P. Jana, Minimum spanning tree-based delay-aware mobile sink traversal in wireless sensor networks: delay-delay-aware mobile sink traversal in WSN [J]. International Journal of Communication Systems
30(13), e3270 (2017)
5. A. Keshavarz-Mohammadiyan, H. Khaloozadeh, Interacting multiple model and sensor selection algorithms for manoeuvring target tracking in wireless sensor networks with multiplicative noise [J]. International Journal of Systems Science48(5), 10 (2017)
6. M. Taherian, M. Maeen, M. Haghparast, Promoting the quality level of signaling in railway transportation system taking advantage from wireless sensor networks technology [J]. Computers6(3), 26 (2017)
7. Y.C. Chou, M. Nakajima, A clonal selection algorithm for energy-efficient mobile agent itinerary planning in wireless sensor networks [J]. Mobile Networks and Applications (2017)
8. V. Talla, M. Hessar, B. Kellogg, et al., LoRa Backscatter [J]. Proceedings of the ACM on interactive, mobile, wearable and ubiquitous technologies1(3), 1– 24 (2017)
9. S.D. Trapasiya, H.B. Soni, Energy efficient policy selection in wireless sensor network using cross layer approach [J]. IET Wireless Sensor Systems7(6), 191–197 (2017)
10. H. Zhu, F. Xiao, L. Sun, et al., R-TTWD: Robust device-free through-the-wall detection of moving human with WiFi [J]. IEEE Journal on Selected Areas in Communications, 1–1 (2017)
11. GPU Parallel Implementation of Spatially Adaptive Hyperspectral Image Classification [J]. IEEE Journal of Selected Topics in Applied Earth Observations & Remote Sensing, 2017, PP(99):1-13.
12. M. Hosseini, H. Mcnairn, Using multi-polarization C- and L-band synthetic aperture radar to estimate biomass and soil moisture of wheat fields [J]. International Journal of Applied Earth Observation and Geoinformation58, 50–64 (2017)
13. J. Yang, H. Zou, H. Jiang, et al., CareFi: sedentary behavior monitoring system via commodity WiFi infrastructures [J]. IEEE Transactions on Vehicular Technology67(8), 7620–7629 (2018)
14. X. Zheng, J. Wang, L. Shangguan, et al., Design and implementation of a CSI-based ubiquitous smoking detection system [J]. IEEE/ACM Transactions on Networking25(6), 3781–3793 (2017)
15. H. Deng, J. Wu, L. Zhu, et al., Texture edge-guided depth recovery for structured light-based depth sensor [J]. Multimedia Tools and Applications
76(3), 4211–4226 (2017)
16. Y. Lu, J. Zhang, B. Li, et al., Harnessing commodity wearable devices to capture learner engagement [J]. IEEE Access, 99):1–99):1 (2019, PP) 17. G. Yu, Z. Yifan, L. Jie, et al., Sleepy: wireless channel data driven sleep
monitoring via commodity WiFi devices [J]. IEEE Transactions on Big Data, 1–1 (2018)
18. R. Zhang, N. Zhang, C. Du, et al., From electromyogram to password [J]. ACM Transactions on Intelligent Systems and Technology9, 1):1–1)20 (2017) 19. M. Karar, S. Paul, A. Mallick, et al., Interaction behavior between active
hydrogen bond donor-acceptors as a binding decoration for anion recognition: experimental observation and theoretical validation [J]. ChemistrySelect2(9), 2815–2821 (2017)
20. H. Rueda, C. Fu, D.L. Lau, et al., Single aperture spectral+ToF compressive camera: toward hyperspectral+depth imagery [J]. IEEE Journal of Selected Topics in Signal Processing11(7), 992–1003 (2017)
Publisher’s Note