R E S E A R C H
Open Access
Node importance evaluation method based
on multi-attribute decision-making model
in wireless sensor networks
Rongrong Yin
1,2*, Xueliang Yin
1,2, Mengdi Cui
1and Yinghan Xu
1Abstract
Identifying important nodes is very crucial to design efficient communication networks or contain the spreading of information such as diseases and rumors. The problem is formulated as follows: given a network, which nodes are the more important? Most current studies did not incorporate the structure change as well as application features of a network. Aiming at the node importance evaluation in wireless sensor networks, a new method which ranks nodes according to their structural importance and performance impact is proposed. Namely, this method
considers two aspects of the network, network structural characteristics and application requirements. This method integrates four indicators which reflect the node importance, namely, node degree, number of spanning trees, delay, and network energy consumption. Firstly, the changes in the four indicators are analyzed using the node deletion method. Then, the TOPSIS multi-attribute decision-making method is applied to merge these four evaluation indicators. On this basis, a more comprehensive evaluation method (MADME) for node importance is obtained. Theory study reveals MADME method saves computational time. And the simulation results show the superiority of the MADME method over various algorithms such as the N-Burt method, betweenness method, DEL-Node method, and IE-Matrix method. The accuracy of the evaluation can be improved, and the key nodes
determined by the MADME method have a more obvious effect on the network performance. Our method can provide guidance on influential node identification in the network.
Keywords:Wireless sensor networks, Node importance, Multi-attribute decision-making, Node deletion, Structural importance, Application performance
1 Introduction
Wireless sensor networks are composed of a large number of sensors equipped with radio communication capabilities [1]. Owing to their simple deployment and flexible and fast distribution, they have been widely applied in intelligent home, agricultural production, and other fields. Wireless sensor networks have the capability of self-organizing, where a large number of nodes are used to make up multi-hop ad-hoc networks for information transmission by means of initial communications and negotiation [2]. The failure of some nodes in the network usually causes changes to the network structure and performance. Especially, the
failure of the key nodes [3] in the network often leads to the collapse of the whole network. Therefore, in the dy-namic and complex network environment, current wireless sensor network research must urgently address methods of determining the key node quickly and accurately and pro-vide targeted protection, thus ensuring the reliability and stability of the network [4].
The problem of node importance evaluation [5] origi-nates from the complex network, and the problem of node importance evaluation is mainly studied in terms of the structural characteristics and application requirements of the network. For example, previous researches [6,7] used the structural characteristic indicators such as the degree and the K-shell, respectively, to quantify the importance of a node. Furthermore, the application requirement indica-tors such as the network transmission efficiency and the
© The Author(s). 2019Open AccessThis article is distributed under the terms of the Creative Commons Attribution 4.0 International License (http://creativecommons.org/licenses/by/4.0/), which permits unrestricted use, distribution, and reproduction in any medium, provided you give appropriate credit to the original author(s) and the source, provide a link to the Creative Commons license, and indicate if changes were made.
* Correspondence:[email protected] 1
School of Information Science and Engineering, Yanshan University, Qinhuangdao, China
2The Key Laboratory of Special Fiber and Fiber Sensor of Hebei Province,
load flow, respectively, were also used to assess the import-ance of nodes in a complex network [8,9].
However, for the actual wireless sensor network, the performance indicator of the network application require-ments is the direct target of the network optimization. In terms of indicators of the network structure importance, there are some limitations when analyzing the actual ap-plication requirements for network timeliness or network lifetime. But at the same time, network performance is es-sentially information transfer processes along nodes or links. Thus, network topology plays an important role. The local and global structure characteristics of a node directly reflect the efficiency of information transmission and the energy loss in the network. If we only consider the performance indicators of the network application re-quirements, and the influence of structural importance on network performance is ignored, it would lead to a weak robustness of the network topology. From the above dis-cussion, we can easily find that node importance evalu-ation in a network is a result of the structural importance and performance impact jointly. Therefore, the node im-portance in wireless sensor networks cannot be evaluated with only a single indicator and requires a combination of the structural characteristics and application requirements as the two aspects for comprehensive evaluation.
Our main contributions are summarized as follows.
1. In terms of the structural characteristics of the network, consider the change in the sum of the node degree and the change in the number of spanning trees before and after removing nodes as evaluation indicators.
2. With regard to the application requirements of the network, consider the amount of delay changes and the amount of energy consumption changes when a node is removed as evaluation indicators.
3. The TOPSIS multi-attribute decision-making model is constructed, which combines the above four indi-cators. A novel method for node importance evalu-ation in wireless sensor network is proposed based on the model.
4. Through the simulation analysis, the method is more comprehensive and accurate than other methods based on a single indicator, and some key nodes with small differences can be discovered. In addition, it is also verified that this method can improve the evaluation validity and is significant for deliberate attacks.
The rest of the paper is organized as follows. Section2 describes the key design methods of MADME and the experiments. Section3 describes the related works. Sec-tion4 introduces the attributes determination of the de-cision model and respectively takes two evaluation
indicators from the structural characteristics and the ap-plication requirements as the attributes. Section 5 mainly introduces the construction process of the TOP-SIS multi-attribute decision-making model and the steps of the node importance evaluation method based on this decision model. Section 6 presents the experiment re-sults and discussion. Finally, Section 7 concludes the paper.
2 Methods/experimental
The aim of this paper is to identify the key nodes in wireless sensor networks. To solve this problem, an evaluation model for node importance based on multi-attribute decision-making is proposed. This model incor-porates the structural features as well as the application requirements of a node in wireless sensor networks. In addition, based on information entropy method, this model analyzes the weight influence of the evaluation in-dicators. Finally, a comprehensive evaluation method MADME, which jointly considers node degree, the num-ber of spanning trees, delay, and energy consumption, is designed to reflect the node importance. To analyze the performance of MADME, extensive simulations are car-ried out. The simulations consider two aspects, accuracy and validity. Simulation results confirm that MADME can distinguish the important nodes with slight differ-ence, and according to the key nodes obtained by the MADME method to deliberately attack the network, the network is quickly disintegrated.
3 Related works
The structural characteristics and application require-ments are the two main aspects of the network. Here-with, we present previous research on the node importance evaluation from these two aspects.
Fourier transform centrality (GFT-C) is introduced to quantify how important a particular node is to other nodes in a network. GFT-C utilizes not only the local properties, but also the global properties of a network topology. However, the time complexity is still higher. To lower the time complexity, reference [15] introduces the least square support vector machine (LS-SVM) method to establish the evaluation model. LS-SVM method selects four complicated importance indicators and finds the relationship of simple attributes from local properties and node importance obtained from global at-tributes. The computational complexity is decreased significantly.
Based on the application requirements of the network, reference [16] evaluates node importance from the per-spective of delay. It shows that removing the most im-portant node always results in a maximum increase in the shortest distance from the source node to the sink node and has the largest transmission delay of network. Reference [17] proposes an approach based on an energy field model which evaluates the node importance by analyzing the status of data transmission among associ-ated nodes. In reference [18], a weighted minimum path tree is used as the metric. It determines whether the node is important based on the weighted path tree func-tion. The method extends the life of the network to a certain extent, but each node has to rebuild the shortest path tree of the whole network after removing nodes, resulting in a waste of energy. To solve this problem, reference [19] comprehensively considers the remaining lifetime of nodes and the increase in energy consump-tion caused by removing a node. And a method is pro-posed based on an energy indicator. It can find the key nodes with faster energy consumption and important position in the network, which is of great significance to enhance the invulnerability and prolong the life of the network. On the basis of a “no return” node deletion method, reference [20] uses the network efficiency, lar-gest component size, and network flow as the indicators of network performance. Evaluating node importance is done by comparing the change of network overall per-formance before and after deleting nodes.
In the research of node importance evaluation, the concepts of “structural characteristics” and “application requirements”have been well studied, but these research results mentioned for node importance evaluation only consider the impacts of structural characteristics or ap-plication requirements, which ignore the compositive in-fluence of both aspects. In recent years, considering there is a relation between the location of a node in the network and its influence in network performance, some scholars have also considered comprehensively both as-pects of the evaluation method. In reference [21], some-one believes that the important node in road traffic
network is related to the traffic flow through the node and the location of the node. And a method based on node contraction is obtained by combining two indica-tors. Reference [22] gives a new centrality called density centrality to identify and rank the node importance. The density centrality is computed by considering the degree and the distance between two nodes. Reference [23] uses the node efficiency and the node degree to evaluate the node importance. Reference [24] studies the bi-objective critical node detection problem and finds a set of solutions which minimize the pairwise connectivity of the induced graph and the cost of removing these critical nodes at the same time. These methods improve the comprehensive-ness of critical node judgment, but ignore the weight problem of the various indicators, which makes the ob-tained important nodes far from reality. The accuracy of their evaluation requires improvement. Therefore, to re-search the node importance evaluation, the evaluation model should switch from the unilateral indicators to combined indicators, and the weight of the various indica-tors on the node importance should be considered.
Taking into account the above description, in this paper, we propose a multi-attribute decision-making model to evaluate the node importance from both these two perspectives. There are two goals need to be reached, one is to improve the evaluation comprehen-siveness, and the other is to increase the evaluation ac-curacy. This study takes the node degree and the number of spanning trees as the structural characteris-tics, and takes the delay and energy consumption as the application requirements, and the information entropy method is adopted to obtain the weight of each indica-tor. Then, we integrate the contribution degree of the four indicators to the node importance and construct the multi-attribute decision-making model. Finally, a more comprehensive method for node importance evaluation is proposed. This method not only overcomes the limitations of using a unilateral evaluation, but also takes into account the weight influence of the evaluation indicators, which makes the node importance evaluation more comprehensive and accurate.
4 Attribute determination of the decision model
removing nodes are analyzed. And four indicators are used as the attributes of a decision model.
4.1 Structural characteristic indicators of the network The structural characteristics of the network affect the robustness of the network topology. By analyzing the re-lationship between the node itself and the location infor-mation in the network, the local and global indicators are obtained. This study takes the node degree and the number of spanning tree as the evaluation indicators of the structural characteristics. The changes in the node degree and the number of spanning trees are calculated when a node is removed, and are chosen as the attri-butes in the decision model.
4.1.1 Node degree
The node degree refers to the local attribute of the structural characteristics, which indicates the number of neighbor nodes. By analyzing the relationship between the nodes, it can reflect the direct influence of a node on other nodes in the network.
Set up a network G= (V,E), where V= {v1,v2,…,vn} corresponds to the set of nodes and E= {e1,e2,…,em} corresponds to the collection of edges. It has a total ofn
nodes and medges and is a non-looped non-connected map.
Its total node fully associative matrix is defined asAc= [aij]n×m, where n corresponds to the number of nodes andmcorresponds to the number of edges in the graph. The elementsaijcan be expressed as [25]
aij¼ 10 nodenodeiis associated with edgej iis not associated with edge j
ð1Þ
The node degree of nodeiis calculated as
k ið Þ ¼X j∈m
aij ð2Þ
where the change in node degree for the entire network before and after removing nodei depends on the sum of the changes both the nodeiand its neighbor nodes.
Ki¼2k ið Þ ð3Þ
4.1.2 Number of spanning trees
The number of the spanning tree is considered to be the global attribute of the structural characteristics. This means that some edges of the connected graph are re-moved, the nodes in the graph can be connected, and the whole graph does not appear in the ring structure. By analyzing the number of spanning trees after remov-ing nodes and related edges, the node importance based on network topology is reflected.
According to the matrix theory of the Binet-Cauchy theorem [13], the formula for the number of spanning trees can be obtained. SetGas an undirected graph and τ is the number of spanning trees for graphG. For the associative matrix Ac, each row corresponds to a node and each column corresponds to an edge. Arbitrarily re-moving thei row of Ac (nodei is used as the reference node) will obtain the matrixA. The number of spanning trees is
τð Þ ¼G detAAT ð4Þ
Begin to delete the node in the matrix Ac, for the ith node, removing theith row and the columns where the element is not zero in ith row. A new matrix Bc is formed. MatrixBis obtained by removing any row from the matrix Bcas a reference node. The number of span-ning trees can be expressed as
τðG−viÞ ¼ detBBT ð5Þ
Thus, the change in the number of spanning trees of the network is
τi¼τð Þ−G τðG−viÞ ð6Þ
4.2 Application requirements indicators of the network The application requirements of the network are mainly based on the actual network performance. The analysis shows that the performance changes of the nodes in the network information transmission process affect the net-work performance. Therefore, this study selects the delay and energy consumption of the two performance indicators to quantify the node importance. We calculate the amount of network delay and network energy con-sumption based on a node deletion method. And we use them as attributes in the decision model.
4.2.1 Delay
The delay can effectively reflect the transmission timeli-ness of the actual network. It depends on the transmis-sion rate and transmistransmis-sion distance of the nodes in the network. After the deletion of a node, the delay is in-creased mainly owing to the increase in the shortest path distance of each node in the network. It leads to a larger information transmission distance. Therefore, the change in the network delay before and after removing nodes can be reflected by the change in the shortest path distance. After deleting a node, the greater the amount of delay changes, the greater the node importance.
each as di, where theith should not contain the sum of the shortest path distance from nodeito the remaining nodes. After removing the nodei, recalculate the sum of the shortest path distance d0i, so the amount of change
in the shortest path distance when node i is removed (that is, the amount of delay changes) is
Di¼di−d0i ð7Þ
4.2.2 Energy consumption
For energy-constrained wireless sensor networks, energy consumption affects the lifetime of the network. The en-ergy consumption of the network includes the enen-ergy consumption of the receiving data and transmitting data. Generally, the node is in an important position in the network, where the greater the receiving and transmit-ting data, the larger the energy consumed. Thus, the amount of the energy consumption changes, to a certain extent, can reflect the node importance.
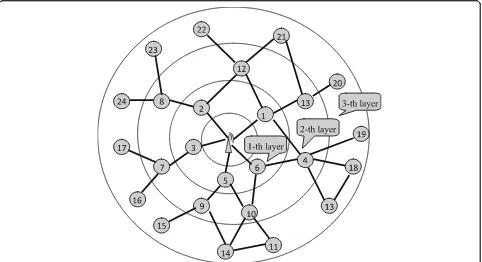
To quantify the energy consumption of the network, the nodes are stratified according to the number of minimum hops form the node to the sink node (located in the center of the monitoring area). This is shown in Fig. 1, where numbers 1–24 represent the nodes, the dotted circles represent the network layers, from the inner to the outer for the first to the third layer. The
node away from the sink is the sub-node, and the node near the sink is the parent node.
When node iis removed, the path from the sub-node of nodei to the sink node (where the path is the mini-mum number of hops from sub-node to the sink node) becomes longer, resulting in the increased energy con-sumption. The energy consumed (timet) before remov-ing nodei is denoted byEt(i), and the energy consumed (time t+ 1) after removing node iis denoted by Et+ 1(i). We will have the increased energy consumptionEADD
EADDi¼Etþ1ð Þ−i Etð Þi ð8Þ
The energy consumption adopts the first-order radio model [26], whereEt(i) is the energy consumption of all sub-nodes for node i; these sub-nodes transmit data by the node with the same layer at ttime. The energy con-sumption at timetis
Etð Þ ¼i X j
s¼1
PtvEð Þs 2Eelecþεampd2
ð9Þ
where Eelec is the RF transmission coefficient, εamp is the amplification factor of the transmitting device, d is the data transmission distance between nodes, j is the number of sub-nodes that need transmit data through the same layer node,Ptis the normalized probability that the sub-node sof node itransmits the data through the same layer node at time t, and vE(s) is the energy
consumption rate of nodes. The energy consumption at derive the following result
EADDi¼ the sub-node s has the same layer node for data trans-mission. That is, the removal of nodeiincreases the en-ergy consumption of the network owing to the increased energy consumption of nodes.
As shown in Fig.1, we calculate the increased energy consumption of the network when node 10 is removed. The added value depends on the increased energy con-sumption of the sub-node 11 during the data transmis-sion. Since the number of the shortest path from node 14 (which is also node 10’s sub-node) to the sink node does not change, the energy consumption of node 14 does not increase because of the removal of node 10.
5 Evaluation method for node importance based on the multi-attribute decision model
Multi-attribute decision-making is generally the use of existing decision-making information in a certain man-ner to sort a set of limited options and merit. Based on the structural characteristics and application require-ments of the network, this study analyzes synthetically the changes in node degree, spanning tree, delay, and energy consumption, and evaluates the node importance for the network. Thus, the node importance evaluation is a multi-attribute decision-making problem.
This study uses a common multi-attribute decision-making method—TOPSIS method [27]. TOPSIS is the sorting method of approximating the ideal solution, which sorts the schemes by the ideal solution and the negative solution of the multiple attributes. The idea of node importance evaluation method based on TOPSIS is that every node is regarded as a scheme and the evalu-ation indicators are regarded as the attributes of each
scheme, and evaluating the importance of each scheme is the criteria [28] for decision-making.
The following section lists the multi-attribute decision model and the steps of the node importance evaluation method based on this decision model.
5.1 The construction of the multi-attribute decision-making model
Assuming that there are m nodes in the network, the corresponding set of decision schemes can be expressed as A= {a1,a2,…,am}. In this paper, when the node i is removed, there are four indicators to evaluate its import-ance, including the amount of change in the node de-grees Ki, the amount of change in the number of spanning treesτi, the amount of change in the delayDi, and the amount of change in the energy consumption
EADDi. Its matrix isX= (xij)m× 4, wherexijis the jth
indi-There are intricate relationships between the indica-tors that can be divided into interest attributes (the lar-ger the value is, the more important the node is) and cost attributes (the smaller the value is, the more im-portant the node is). According to the analysis of the at-tributes, we can see that the four indicators (e.g., Ki, τi,
Di,EADDi) are all interest attributes. As the dimension of each indicator is different, for the sake of comparison, the original decision matrix X= (xij)m× 4 is processed to obtain the dimensionless decision matrixY= (yij)m× 4.
The interest attributes are standardized as below
yij¼
wj¼1 , which constitutes a weighted normalized
matrixZ= (zik)m× 4
zik¼wkyik;i¼1;2;…;m;k¼1;2;3;4 ð15Þ
The information entropy method [29] belongs to the objective weighting method. It is used to calculate the weight vector w= (w1,w2,w3,w4)T. The closer the value of each attribute in different schemes, the greater the en-tropy, thus the weight of the indicator is more objective.
hij¼yij=
Xm
i¼1yij
ð16Þ
Then, the information entropy of the indicator is given by
And the weight vector of the four indicators is
wj¼X41−Ej k¼1
1−Ek
ð Þ
ð18Þ
Furthermore, the positive and negative ideal solutions of the decision scheme (nnodes) are determined accord-ing to the matrixZ, we will have translate the matrixZ, we obtaintik
tik¼zik−Aþk ð21Þ
By translating, the positive ideal solution becomes {0,0, ..., 0}, and the negative ideal solution becomes A0−k ¼tlk,
that |tlk|≥|tik|, 1≤l≤m.
Now, we will calculate the vertical distance VDi. VDi reflects the degree that the scheme approaches the ideal solution. The smaller the value of VDi, the better the scheme. We will have
VDi¼ A0k
Finally, obtain the reciprocal of the vertical distance
VDi and do the normalization process, VDDi will be given by
VDDi¼ 1=VDi
max 1f =VDig ð23Þ
VDDiis used for evaluating the node importance. Sort the node importance according to the order from large to small, and ultimately the evaluation of node import-ance based on multi-attributes will be realized.
5.2 The node importance evaluation method MADME On the basis of the TOPSIS multi-attribute decision model, the steps of the node importance evaluation method (named MADME method) are given below (Fig.2):
From the above method, it can be seen that the time complexity of the method depends on the calculation of the amount of change in the node degree T= (tik)n× 4, the amount of change in the number of spanning trees
VDi, the amount of change in the delay VDi, and the amount of change in the energy consumption EADDi. Calculating the amount of change in the node degree needs to consider the degree of each node in the net-work, and time complexity is O(n). Calculating the amount of change in the number of spanning trees re-quires ncycles of the fully associative matrix AC, and its time complexity is O(n3). Calculating the amount of delay needs to calculate the shortest path distance be-tween nodes by using the Floyd algorithm, then the time complexity is O(n3). Calculating the amount of energy consumption based on the CNDBE algorithm, the time complexity is O(n2). Therefore, the time complexity of MADME method isO(n3).
6 Results and discussion
We use Matlab to implement our simulations. In the simulations, the sensor nodes are randomly deployed in the simulation area. For the purpose of demonstrating the efficiency of the method proposed, the BA (m0= 3,
m= 2) scale-free network commonly used in wireless sensor networks is generated as a test bed. The network is inherently robust and efficient [30], and it has good fault tolerance and survivability against random node failure.
6.1 Accuracy verification of the method
First, we consider the accuracy of the method; the fol-lowing is analyzed from the two aspects of both the method itself and comparison with other methods.
6.1.1 Analysis of the method itself
In this section, we analyze the accuracy of the method itself. This study uses the following simulation environ-ment. The nodes are distributed in a square area of 1000 m × 1000 m, the initial energy of each node is 2 J, and the number of nodes is 100. The specific parameters of the experiment are shown in Table1.
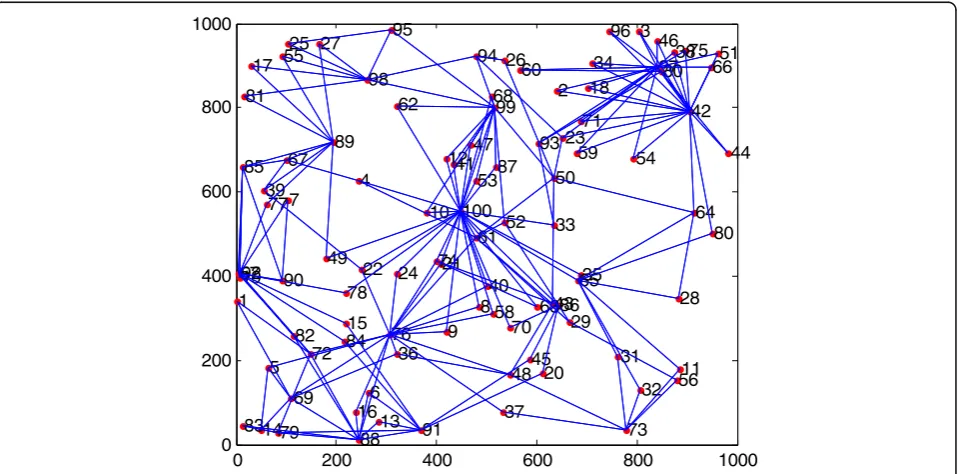
We use the simulation environment in Table 1to ob-tain a BA scale-free network (as shown in Fig. 3). Then, we use the MADME method to calculate the node im-portance. The result is shown in Fig.4.
It is easy to see from Fig.4that the node numbers 42, 97, and 100 have a greater node importance. The net-work topology (see Fig. 3) shows that the connectivity among these three nodes and other nodes is relatively large. Obviously, these three nodes are the key nodes for the network.
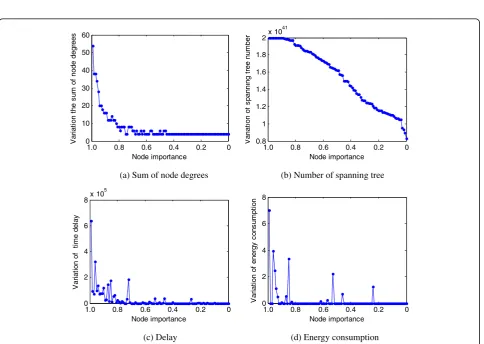
value on the node importance. The nodes are sorted ac-cording to the importance from low to high, and the corresponding four indicators of each node follow the node importance from high to low. The corresponding results can be obtained (as shown in Fig.5).
Figure 5 shows that the four indicators decrease with the decrease in node importance. This is consistent with the obtained conclusions that the four indicators belong to the interest indicators. On the other hand, Fig. 5also shows that the four indicators of individual node do not conform to the overall trend of change. It means that the importance of various indicators for individual node is different. Each indicator weight value reflects the in-fluence of the indicator on the node importance. Thus, the result also indicates that the node importance is re-lated to the weight of the four indicators.
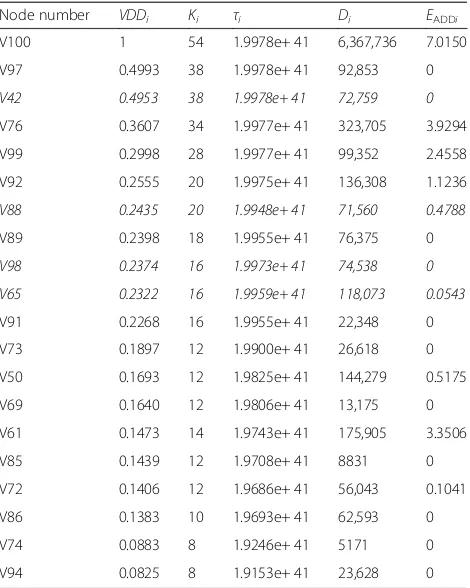
To clarify the advantages of the MADME method, the first 20% key nodes are refined in the overall network. Table 2 gives the importance of the first 20% key nodes and the corresponding indicator values.
From Table2, the structural characteristics and appli-cation requirements of nodes have different values for each indicator, which affects the node importance. For example, the increase in network delay and energy con-sumption when node V42 is removed is littler than that of V65. The change in node degree and number of span-ning trees is considerably greater after deleting node V42 than V65, and node V42 is more important than node V65. It means that node V42 is more important in the network structure than node V65. As another ex-ample, after removing node V88 and V98, respectively, the increase in the sum of node degree and the increase in delay are not large. Although the change in the num-ber of spanning trees after removing node V98 is greater than that of node V88, the change in the energy con-sumption is littler, and node V88 is more important than node V98. It means that node V88 is more important than node V98 in the network application. As we ex-plained above, various indicators identify different nodes as the important nodes. Our MADME, on the contrary,
takes care of both structural characteristics and applica-tion requirements of all nodes and identifies nodes V42, V65, V88, and V98 as the important nodes. These results demonstrate the reasonableness of the MADME method.
6.1.2 Comparison with other algorithms
To further evaluate the accuracy of the MADME method, the comparing methods include the N-Burt method [31], betweenness method [12], DEL-Node method [13], and the IE-Matrix method [23]. The N-Burt method improves the structural holes indicator from the perspective of local importance. It can find the important nodes with both the degree attribute and the bridging attribute in the network. The betweenness method analyzes the node position from the perspective of global importance and measures the node importance. The DEL-Node method evaluates the node importance based on the number of spanning trees after deleting a particular node. It can quantify the important nodes within the global network from the perspective of net-work structure. The IE-Matrix method integrates the
node degree and efficiency and comprehensively evalu-ates the importance from the perspective of both the structure and the performance of a node. The compar-ing results are listed in Table3.
By analyzing the network topology (see Fig.3) and the node importance evaluation results (see Table3), it can be observed that the connection degree of node V100 is the largest, whereas the connection degree of nodes V97 and V92 is 27. Obviously, their importance is different. Thus, it can be seen that if we take the ranking of node degree as the result, it is likely to ignore the difference of each node. So the node importance cannot be accur-ately evaluated only by the node degree.
The N-Burt method is used to quantify the key node, and the structural hole indicator is improved by analyz-ing the node degree and its neighborhood structure. As shown in the network topology (see Fig. 3), although node V89 has more structural holes than node V92, the connection degree of node V92 is greater than that of node V89. In addition, the delay and energy consump-tion of node V89 are smaller than those of node V92. It is obvious that the node importance is inaccurate by
Table 1Experimental parameters
Parameter Value Parameter Value Parameter Value
Node distribution areaA 1000 m × 1000 m Node initial energy 2 J Node maximum transmission radiusR
300 m
Number of nodes 100 Transmission rate 20 kbps The amplification factor of transmitting device
100 pJ/bit/m2
Sink node coordinates (500,500) Radio frequency transmission coefficient 50 nJ/bit The node itself generates dataL
0 20 40 60 80 100 0
0.2 0.4 0.6 0.8 1
Node number
N
ode i
m
port
anc
e
Fig. 4Node importance of each node. The node importance results of BA scale-free network from Fig.3by using the MADME method
1.0 0.8 0.6 0.4 0.2 0
0 10 20 30 40 50 60
Node importance
V
a
ri
at
io
n t
h
e s
u
m
of
node degr
ees
1.0 0.8 0.6 0.4 0.2 0
0.8 1 1.2 1.4 1.6 1.8
2x 10
41
Node importance
V
ar
ia
ti
on o
f s
pann
ing
tre
e
n
u
m
b
er
(a) Sum of node degrees (b) Number of spanning tree
1.0 0.8 0.6 0.4 0.2 0
0 2 4 6
8x 10
5
Node importance
V
a
ri
at
io
n of
t
im
e
del
ay
1.0 0.8 0.6 0.4 0.2 0
0 2 4 6 8
Node importance
V
a
ri
at
io
n of
ener
g
y
c
o
ns
um
pt
io
n
(c) Delay (d) Energy consumption
considering the network structure only. As shown in Table 3, our MADME method recognizes the import-ance of nodes V92 and V89 (in descending order) by taking care of both the structural importance and per-formance impact of all nodes, which overcomes the de-fect of the N-Burt method.
The betweenness method reflects the node importance well in the process of information transmission. How-ever, some nodes with the similar importance position, such as nodes V78 and V98, still need to be further quantified by combining with the application indicators. In the DEL-Node method, after deleting the nodes V100, V97, V42, V76, and V99, the network is divided into different areas. The number of spanning trees is zero, and the corresponding node importance is one. We also need to further distinguish the importance of these nodes. As shown in Table3, our MADME method takes care of both local and global influences of all nodes and distinguishes the differences of nodes V78 and V98 and nodes V100, V97, V42, V76, and V99, and over-comes the shortcomings of the betweenness and DEL-Node methods.
The IE-Matrix method considers the structure indica-tors and performance indicaindica-tors simultaneously. How-ever, because the weight of these indicators is unknown, IE-Matrix fails to estimate influential nodes. For
example, from the network performance consideration, node V99 is more important than node V97. But the weight of the structural characteristics is greater than that of the application requirements. From the two per-spectives, node V97 is more important than node V99. As shown in Table 3, our MADME method takes into account the weight difference of the indicators, detects nodes V97 and V99 (in descending order) as the most influential nodes, and overcomes the weakness of the IE-Matrix method.
These comparison results show the superiority of our MADME method over other methods. By incorporating network structural characteristics and the application re-quirements, and taking into account the weight value of various indicators, the accuracy of the node importance evaluation can be further improved. And the importance of the special nodes with slight difference can be further distinguished remarkably than the existing methods.
6.2 Validity verification of the method
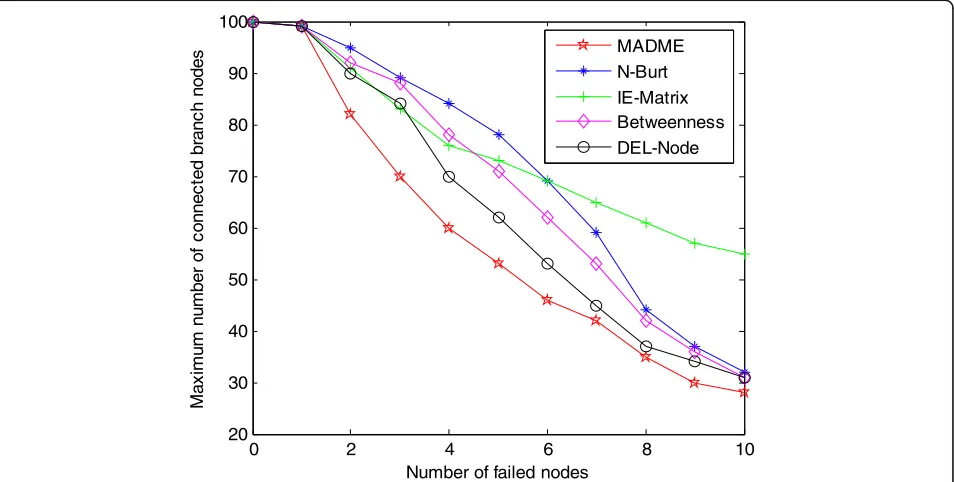
Next, we consider the validity of the MADME method; this study attempts to purposefully remove the import-ant nodes in the network, which simulates the intentional attack. We use the maximum number of connected branch nodes as the performance measure. The effect of intentional attack based on node import-ance on the robustness of the network is analyzed. First, in the 100-node network, the top ten nodes with the highest importance evaluated by each method are re-moved, as shown in Fig.6.
From Fig. 6, we observe that compared with other methods, the number of the maximum connected branch nodes based on the MADME method decreases most greatly. When the first six key nodes are removed according to the ranking of the MADME method, the number of maximum connected branch nodes is less than 50, while according to the rankings of other four methods, the performance is more than 50. It is obvious that the overall performance of the MADME method declined much quicker than that of the four other methods, which tells us that the key nodes discovered by the MADME method are more crucial to the network. This is because the MADME method takes care of both structure role and application features of all nodes. That is to say, if the key node obtained by the MADME method is under attack, the network will collapse rap-idly, which verifies the validity of the MADME method.
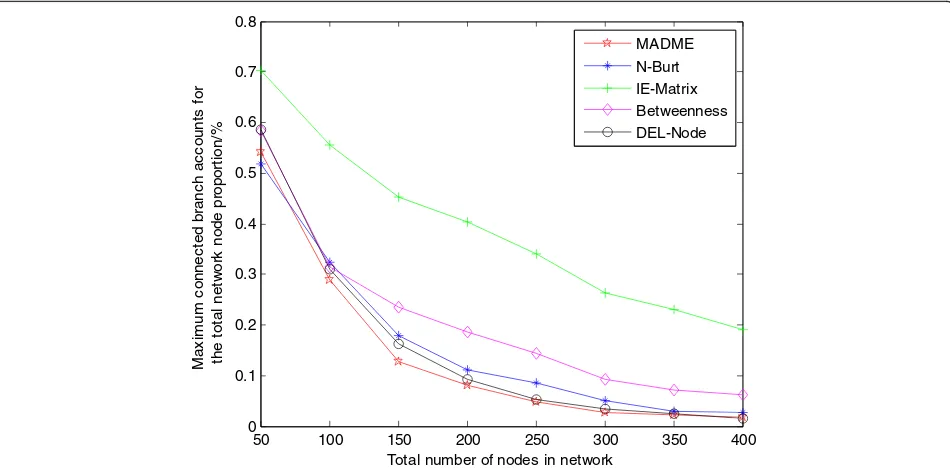
Furthermore, we also investigated the network with different sizes. After removing the first 10% of the key nodes identified by the above methods, the proportions of the maximum connected branch node accounts for the all nodes in the network are shown in Fig.7.
By analyzing the curves in Fig.7, for different network sizes, when removing the first 10% of the key nodes
Table 2Calculation results of each indicator for the first 20%
key nodes in the network
Node number VDDi Ki τi Di EADDi
V100 1 54 1.9978e+ 41 6,367,736 7.0150
V97 0.4993 38 1.9978e+ 41 92,853 0
V42 0.4953 38 1.9978e+ 41 72,759 0
V76 0.3607 34 1.9977e+ 41 323,705 3.9294
V99 0.2998 28 1.9977e+ 41 99,352 2.4558
V92 0.2555 20 1.9975e+ 41 136,308 1.1236
V88 0.2435 20 1.9948e+ 41 71,560 0.4788
V89 0.2398 18 1.9955e+ 41 76,375 0
V98 0.2374 16 1.9973e+ 41 74,538 0
V65 0.2322 16 1.9959e+ 41 118,073 0.0543
V91 0.2268 16 1.9955e+ 41 22,348 0
V73 0.1897 12 1.9900e+ 41 26,618 0
V50 0.1693 12 1.9825e+ 41 144,279 0.5175
V69 0.1640 12 1.9806e+ 41 13,175 0
V61 0.1473 14 1.9743e+ 41 175,905 3.3506
V85 0.1439 12 1.9708e+ 41 8831 0
V72 0.1406 12 1.9686e+ 41 56,043 0.1041
V86 0.1383 10 1.9693e+ 41 62,593 0
V74 0.0883 8 1.9246e+ 41 5171 0
0 2 4 6 8 10 20
30 40 50 60 70 80 90 100
Number of failed nodes
M
a
x
im
u
m
num
ber of
c
onnec
te
d br
anc
h nodes
MADME N-Burt IE-Matrix Betweenness DEL-Node
Fig. 6The maximum connected branch after removing the key nodes. The effect of attack on the network robustness under the five methods, such as the MADME, N-Burt, IE-Matrix, betweenness, and DEL-Node methods, in which the top ten nodes with the highest importance evaluated by each method are removed in turn
Table 3Evaluation results of node importance
Node ranking
MADME N-Burt IE-Matrix Betweenness DEL-Node
Node number
Importance value
Node number
Importance value
Node number
Importance value
Node number
Importance value
Node number
Importance value
1 V100 1 V100 0.3564 V100 0.5534 V100 0.4236 V100 1
2 V97 0.4993 V76 0.2703 V61 0.5231 V23 0.2749 V97 1
3 V42 0.4953 V89 0.2672 V99 0.4757 V61 0.2669 V42 1
4 V76 0.3607 V92 0.2411 V97 0.4585 V50 0.2665 V76 1
5 V99 0.2998 V73 0.2179 V30 0.4478 V76 0.2523 V99 1
6 V92 0.2555 V50 0.2013 V76 0.4352 V97 0.2309 V92 0.9999
7 V88 0.2435 V88 0.1947 V74 0.3871 V92 0.1402 V98 0.9998
8 V89 0.2398 V61 0.1892 V42 0.3586 V99 0.1299 V65 0.9991
9 V98 0.2374 V42 0.1828 V10 0.3253 V65 0.1089 V91 0.9989
10 V65 0.2322 V65 0.1810 V53 0.3147 V72 0.1042 V89 0.9989
11 V91 0.2268 V85 0.1791 V68 0.3090 V74 0.0970 V88 0.9985
12 V73 0.1897 V99 0.1731 V21 0.3083 V42 0.0931 V73 0.9961
13 V50 0.1693 V97 0.1691 V41 0.3059 V88 0.0915 V50 0.9923
14 V69 0.1640 V98 0.1670 V65 0.2790 V4 0.0871 V69 0.9914
15 V61 0.1473 V23 0.1667 V87 0.2560 V78 0.0859 V61 0.9883
16 V85 0.1439 V72 0.1651 V47 0.2334 V98 0.0859 V85 0.9865
17 V72 0.1406 V91 0.1647 V12 0.2285 V67 0.0796 V86 0.9858
18 V86 0.1383 V64 0.1630 V24 0.2127 V89 0.0792 V72 0.9854
19 V74 0.0883 V67 0.1624 V22 0.2032 V94 0.0620 V74 0.9634
identified by the MADME method, the proportion of the maximum connected branch of the network is always less than that of the betweenness and IE-Matrix methods. This is mainly because the advantage of the MADME method is that it considers not only the node attributes from both structure importance and perform-ance impact, but also the attributes’ weight; it is more objective when applied to the evaluation of node import-ance. This result also indicates that the key nodes ob-tained by our MADME method have a greater impact on the robustness of the network. In addition, although the impact of the MADME method is closer than that of the N-Burt and DEL-Node methods, the MADME method is better in small-scale networks (such as a less than 150-node network). This is because MADME can recognize the potential key nodes more quickly; the ranking of MADME method is quite different from that of other methods in small-scale networks. But with in-creasing nodes, although the orders are different, the key nodes are almost the same.
From the above analysis, the impact on the robustness of the network by deliberately attacking the key nodes according to the MADME method is greatest, and even the whole network is paralyzed. This means that accord-ing to the MADME method to provide more targeted protection for the key nodes, the deliberate attack on the network can be effectively resisted. The experiment re-sults further verify the validity of the MADME method.
The node importance evaluation method MADME based on structural characteristics and application
requirements shows its accuracy and validity; thus, the evaluating efficiency can be improved.
7 Conclusions
In this article, we introduce a multi-attribute decision-making function to integrate the four indicators including the structural characteristics and application requirements of a network. In the meantime, we also take into account the weight of these indicators. Then, the MADME method for evaluating the node importance is proposed. The main feature of the MADME method is that the application re-quirement indicator is consistent with reality and the structural characteristic indicator reflects the robustness of the structure, which improves the evaluating efficiency. Theoretical analysis indicates that the MADME method saves computational time. The simulation results show that the MADME method is reasonable from the two as-pects, structure and performance, which overcomes the shortcomings of the N-Burt, betweenness, and DEL-Node methods only in terms of the network structure. In addition, it takes into account the weight of the four indi-cators and overcomes the weakness of the IE-Matrix method which combined the two aspects structure and performance. Moreover, compared with various methods such as N-Burt, betweenness, DEL-Node, and IE-Matrix, according to the key nodes obtained by the MADME method to deliberately attack the network, the network is quickly disintegrated. The result shows that the MADME method is more effective for the node importance evalu-ation. The key nodes discovered by the MADME method
50 100 150 200 250 300 350 400
0 0.1 0.2 0.3 0.4 0.5 0.6 0.7 0.8
Total number of nodes in network
M
a
x
im
u
m
c
onnec
ted br
anc
h ac
c
ount
s
f
o
r
the t
o
ta
l net
w
o
rk
node propor
ti
on/
%
MADME N-Burt IE-Matrix Betweenness DEL-Node
have a more obvious impact on the network performance. Therefore, using the MADME method to quantify the key nodes, designing a network protection strategy, the net-works’ invulnerability will be improved. The proposed model and method are expected to be applied to the ana-lysis and design of wireless sensor networks and to dis-cover some potential key nodes quickly and accurately.
Acknowledgements
The authors are thankful to the chief editor and anonymous reviewers for their valuable comments in reviewing this paper. Special thanks also to professor Zabih Ghassemlooy of Northumbria University, UK. He gave some important suggestions for the improving of this paper.
Authors’contributions
RY proposed the idea of the identified key nodes. Moreover, she participated in the initial writing and revision of this paper. XY contributed to the relationship analysis of these indicators, and he wrote the initial version of this paper. MC and YX have provided advice and feedback. All authors read and approved the final manuscript.
Funding
This work is supported by National Natural Science Foundation of China under grant No. 61802333, State Scholarship Fund of China Scholarship Council under grant No. 201808130258, and Science and Technology Research Project of Colleges and Universities in Hebei Province under grant No. QN2018029.
Availability of data and materials Not applicable.
Competing interests
The authors declare that they have no competing interests.
Received: 26 April 2018 Accepted: 12 September 2019
References
1. Y. Zhang, W. Li, Modeling and energy consumption evaluation of a stochastic wireless sensor network. EURASIP J. Wirel. Commun. Netw.282, 2012 (2012)
2. J. Yick, B. Mukherjee, D. Ghosal, Wireless sensor network survey. Comput. Netw52(12), 2292–2330 (2015)
3. W. Asif, H.K. Qureshi, M. M Rajarajan, M. Lestas, Combined Banzhaf & Diversity Index (CBDI) for critical node detection. J. Netw. Comput. Appl. 64(C), 76–88 (2016)
4. K. Liu, S. Liu, Novel sensor node importance evaluation method based on the agglomeration contraction principle. J. Xidian Univ.42, 90–96 (2015) 5. X.L. Ren, L.Y. Lv, Review of ranking nodes in complex networks. Chin. Sci.
Bull.59, 1175–1197 (2014)
6. D.B. Chen, L.Y. Lu, M.S. Shang, Y.C. Zhang, T. Zhou, Identifying influential nodes in complex networks. Physica A.391, 1777–1787 (2012)
7. A. Zeng, C.J. Zhang, Ranking spreaders by decomposing complex networks. Phys. Lett. A377, 1031–1035 (2013)
8. W.L. Fan, Z.G. Liu, Ranking method for node importance based on efficiency matrix. J. Southwest Jiaotong Univ.49, 337–342 (2014)
9. H.W. Yang, Y. Zhang, H.K. Wang, Y. Liu, New measure of node importance based on load flow in node-weighted complex networks. Appl. Res Comput.30, 134–137 (2013)
10. J.W. Wang, L.L. Rong, T.Z. Guo, A new measure method of network node importance based on local characteristics. J. Dalian Univ. Technol.50, 823– 826 (2010)
11. C.H. Comin, L.D. Costa, Identifying the starting point of a spreading process in complex networks. Phys. Rev. E.84, 056105 (2011)
12. A. Dorfman, N. Kumar, J. Hahm, Highly sensitive biomolecular fluorescence detection using nanoscale ZnO platforms. Langmuir the Acs J Surfaces Colloids.22, 4890–4895 (2006)
13. Y. Chen, A.Q. Hu, X. Hu, Evaluation method for node importance in communication networks. J. China Inst. Commun.25, 129–134 (2004)
14. R. Singh, A. Chakraborty, B.S. Manoj, GFT centrality: A new node importance measure for complex networks. Physica A.487, 185–195 (2017)
15. X.X. Wen, C.L. Tu, M.G. Wu, X.R. Jiang, Fast ranking nodes importance in complex networks based on LS-SVM method. Physica A.506, 11–23 (2018) 16. E. Nardelli, G. Proietti, P. Widmayer, Finding the most vital node of a
shortest path. Theor. Comput. Sci.296, 167–177 (2001)
17. Q.D. Sun, Y.M. Qiao, J.M. Wang, S. Shen, Node importance evaluation method in wireless sensor network based on energy field model. EURASIP J. Wirel. Commun. Netw.2016(1), 199 (2016)
18. W. Bechkit, M. Koudil, Y. Challal, et al.,A new weighted shortest path tree for converge cast traffic routing in WSN. 2012 IEEE Symposium on Computers and Communications (ISCC), Cappadocia, Turkey, vol 2012 (2012), pp. 000187– 000192
19. B. Liu, W.J. Wang, Y.Q. Li, R.R. Yin, T. Han, Crucial node decision algorithm based on energy in WSNs. J. Electron. Inf. Technol.36, 1728–1734 (2014) 20. X.X. Wen, C.L. Tu, M.G. Wu, Node importance evaluation in aviation network
based on“no return”node deletion method. Physica A.503, 546–559 (2018) 21. Z.L. Hong, B.Y. Liu, Y.P. Zhang, Application of complex network in
transportation network’s node importance evaluation. J. Xi’an Technol. Univ. 34(5), 404–410 (2014)
22. A. Ibnoulouafi, M.E. Haziti, Density centrality: Identifying influential nodes based on area density formula. Chaos Solitons Fractals114, 69–80 (2018) 23. X. Zhou, F.M. Zhang, K.W. Li, X.B. Hui, H.S. Wu, Finding vital node by node
importance evaluation matrix in complex networks. Acta Phys. Sin.61, 050201 (2012)
24. J. Li, P.M. Pardalos, B. Xin, J. Chen, The bi-objective critical node detection problem with minimum pairwise connectivity and cost: Theory and algorithms. Soft. Comput. (2019).https://doi.org/10.1007/ s00500-019-03824-8
25. P. Zhang, Z.Y. Dong, Z. Shen, Multi-parameter optimization algorithm for communication network node importance evaluation. Comput. Eng.39, 95– 96 (2013)
26. W.R. Heinzelman, A. Chandrakasan, H. Balakrishnan,Energy-Efficient Communication Protocol for Wireless Microsensor Networks, vol 2000 (Proceedings of the 33rd Annual Hawaii International Conference on System Sciences, Hawaii, 2000), pp. 3005–3014
27. W. Yuan, Y. Wang, J. Wen, Establishment and application of the improved TOPSIS model based on game theory. J Water Resources Architectural Engineering14, 188–191 (2016)
28. H. Yu, Z. Liu, Y.J. Li, Key nodes in complex networks identified by multi-attribute decision making method. Acta Phys. Sin.62, 020204 (2013) 29. S.W. Wang, J.X. Liu, B.Q. Cao, M.D. Tang, X. Wang, Recommended method of
mashup services based on information entropy multi-attribute decision-making. Comput. Sci.42, 263–266 (2015)
30. A.L. Barabasi, R. Albert, Emergence of scaling in random networks. Science 286, 509–512 (1999)
31. X.P. Su, R.R. Song, Leveraging neighborhood“structural holes”to identifying key spreaders in social networks. Acta Phys. Sin.64, 020101 (2015)
Publisher’s Note