Gurugnanam. B, Kalaivanan. K, Bairavi. S, and Vinoth. M 3D MODEL CONCEPTION OF KOLLI HILL USING GEOSPATIAL TECHNOLOGIES P a g e | 391
3D MODEL CONCEPTION OF KOLLI HILL USING
GEOSPATIAL TECHNOLOGIES
Gurugnanam. B1, Kalaivanan. K1, Bairavi. S2, and Vinoth. M1
Centre for Applied Geology, Gandhigram rural institute – Deemed University, S. India1
Dept. of Rural Development, Gandhigram rural institute – Deemed University, S. India2
Email: [email protected]
ABSTRACT
An attempt has been made to
apply the geological knowledge on the
morphometric analysis from the
Digital Elevation Model (DEM)
creating by using spatial knowledge.
Many geo-morphometric parameters
such as DEM, Slope, and Aspects are
related with elevation of the terrain.
Digital elevation model is used to
determine the features of drainage
networks and slope of drainage
network and to determine the
characteristics of basins. The current
analysis clearly indicates the relations
between the various attributes of the
morphometric aspects of the basin; it
helps to understand their role in
sculpturing the surface of the region
geologically.
Key words: DEM Generation, Aspect,
Slope, Flow direction, Flow
Accumulation.
1. INTRODUCTION
A DEM is a representation of
Earth surface with latitude, longitude
and altitude, i.e. X; Y horizontal
coordinates and height Z. DEMs play a
significant tool for the extraction of
three dimensional models (Swaraj and
Anji Reddy, 2013). Digital Elevation
Model is a quantitative representation
of terrain and is consequential for
geological and hydrological
Gurugnanam. B, Kalaivanan. K, Bairavi. S, and Vinoth. M 3D MODEL CONCEPTION OF KOLLI HILL USING GEOSPATIAL TECHNOLOGIES P a g e | 392
remotely sensed imagery is crucial for
a variety of mapping applications such
as ortho-photo generation, city
modeling, object recognition, and
creation of perspective views.
Recently launched high-resolution
imaging satellites (e.g., World view, 3,
2, SPOT-5, IKONOS, QUICKBIRD,
ORBVIEW, and EOS-1) constitute an
excellent source for efficient,
economic, and accurate generation of
DEM data for extended areas of
Earth’s surface (Shin et al., 2003).
Delineation of terrain
parameters, such as slope, drainage
network, watershed boundaries, etc.
are very important for many
geo-scientific studies. These parameters are
often required in preparation of
development and conservation design
for natural resources, infrastructure
development, town planning, etc. DEM
generated from stereo data has been
validated using ground control points
(GCPs). Evaluation of drainage pattern
is carried out by morphometric
analysis (Suganthi and Srinivasan,
2010).
2. STUDY AREA
The area chosen for the present
study forms a major portion in the
Namakkal District of the state of Tamil
Nadu kolli hills (Fig. 1), except for a
small pocket on the eastern part of the
hill, which lies in Tiruchirappalli
District. The study area is
geographically situated between the
north latitudes 11°11’N to 11°30’N and
east longitudes 78°16’E to 78°29’E
covering an area of 485 Sq. km. On the
northern side, it is bounded by Salem
District and in the eastern and the
south eastern sides; it is bounded by
Gurugnanam. B, Kalaivanan. K, Bairavi. S, and Vinoth. M 3D MODEL CONCEPTION OF KOLLI HILL USING GEOSPATIAL TECHNOLOGIES P a g e | 393
Fig.1. Location map of the study area.
3. METHODOLOGY
Gurugnanam. B, Kalaivanan. K, Bairavi. S, and Vinoth. M 3D MODEL CONCEPTION OF KOLLI HILL USING GEOSPATIAL TECHNOLOGIES P a g e | 394
4. RESULTS AND DISCUSSION
4.1. Spatial Analyst
4.1.1. Slope
Slope is analyzed from the
SRTM image. This is classified based
on pixel values. The study area is
extracted (cropped image) from the
identified slope with its dark black to
white which indicates the slope of the
study area from low to high. The same
SRTM image was classified into three
zones as high, medium and low is
given (Fig.3).
Fig.3. Slope map of the study area.
4.1.2. Aspect
Investigation of an aspect helps
to identify the slopping directions and
easy us to view the steep areas. In kolli
hills, aspect based on the slope has
been classified as below. It says that
most of the steep slopping towards
almost west, northwest, south and
south east (Fig. 4).
4.1.3. Hillshade
Graphical display, hillshade can
greatly enhance the relief of a surface.
In the study, it has been focused on the
later and this image has been used as a
3D image. The hillshade map are
shown in Fig.5. The sun angle of the
map shows from NE direction. The
height of the terrain, as in the map,
shows black tone for valleys and white
tone for the elevated portion. The
higher elevation was noticed as 181,
Gurugnanam. B, Kalaivanan. K, Bairavi. S, and Vinoth. M 3D MODEL CONCEPTION OF KOLLI HILL USING GEOSPATIAL TECHNOLOGIES P a g e | 395
difference related to the elevation of
the hill varies from 300 to 1200 above
elevation.
4.2. Arc Hydro Analysis
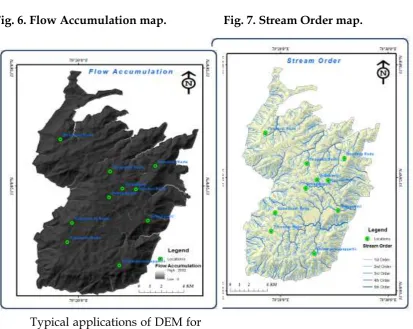
4.2.1. Flow Direction and Flow Accumulation
Drainage networks are made
from the flow accumulation model. A
lower limit value is determined
considering the precision and size of
the study on this model, and according
to the highest cell value obtained from
the flow accumulation model. All cells
above this lower limit value are
defined as a part of drainage network.
When defining these drainage
networks, all cells except for cells with
zero values represent a part of the
drainage network. By considering the
water flow directions and flow
accumulation model in the drainage
network, main stream and
side-branches are created. Water flow
direction in the flow accumulation
model is from cell with lower values to
those with higher values. Drainage
network map of the study area was
drawn on this flow accumulation
model (Fig. 6). This map shows
existent stream paths and possible
drainage network paths.
Fig.4. Aspect map.
Gurugnanam. B, Kalaivanan. K, Bairavi. S, and Vinoth. M 3D MODEL CONCEPTION OF KOLLI HILL USING GEOSPATIAL TECHNOLOGIES P a g e | 396
4.2.3. Stream Order
If the streams are idealized as single lines containing no lakes, islands, nor junctions of more than two streams at the same point, the resulting diagram is known in the geomorphic literature as a dendritic stream network. The sources are the points farthest upstream in a stream network, and the outlet is the point farthest downstream. The point at which two streams join is called a junction. An exterior link is a segment of stream network between a source
and the first junction downstream. An interior link is a segment of stream network between first two successive junctions or between the outlet and the first junction upstream (Fig. 7).
The following table shows the stream order found in the study are calculated based on the Strahler (1952) method.
Stream order Length (m)
I st Order 60698.32
II nd Order 17720.34
III rd Order 6978.52
IV th Order 1575.19
V th Order 2056.65
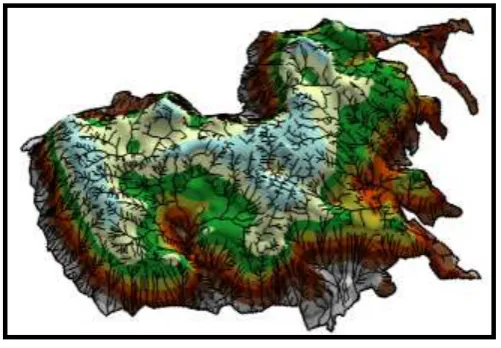
4.3. Digital Elevation Model
Geographic Information systems (GIS)
used to delineate the watersheds,
stream-networks and drainage order.
Digital elevation models (DEM) are
efficient and effective methods used to
determine the features of drainage
networks like size, length, and slope of
drainage network and to determine the
characteristics of basin and sub-basin.
Moreover, the DEM has many
significant values like slope, direction,
flow length and good visual effects for
the
common people too. Elevation
information of each contour was
defined in geographic information
system and according to these values;
Gurugnanam. B, Kalaivanan. K, Bairavi. S, and Vinoth. M 3D MODEL CONCEPTION OF KOLLI HILL USING GEOSPATIAL TECHNOLOGIES P a g e | 397
field was gained at 10 mts elevated is given in Fig 5.
Fig. 6. Flow Accumulation map. Fig. 7. Stream Order map.
Typical applications of DEM for
water systems include: (1) Watershed
storm water management; (2)
Floodplain mapping and flood hazard
management; (3) Hydrologic and
hydraulic modeling of combined and
storm sewer systems, including
estimating surface elevation and slope
from digital elevation model data
(DEM); (4)
Documenting field work; (5)
Planning, assessment of the feasibility
and impact of system expansion; (6)
Estimating storm water runoff from
the physical characteristics of the
watershed, e.g., land use, soil, surface
imperviousness and slope (Shamsi,
Gurugnanam. B, Kalaivanan. K, Bairavi. S, and Vinoth. M 3D MODEL CONCEPTION OF KOLLI HILL USING GEOSPATIAL TECHNOLOGIES P a g e | 398
Fig. 8. Digital Elevation Model of the study area.
5. CONCLUSION
Three dimensional studies are
carried through various techniques.
Gathering information is the main for
competence. Here, DEM creates a
broad understanding of the elevated
feature easily. This helps to produce
the valuable resource information
systems. The preceding analysis
clearly indicates the relations between
the various attributes related to the
morphometric aspects of this basin. It
further helps to understand their role
in sculpturing the surface of the
region.
6. ACKNOWLEDGEMENT
The authors are very much grateful to the CSIR for the financial assistance through the KOLLI GIS – Major Research Project. Also thankful to anonymous reviewers.
7. REFERENCES
1. Longley, Paul (1999) GIS –
Management Issues and
Applications. Volume 2.
Publisher: John Wiley.
2. Shamsi, U.M, (2002) GIS tools
for water, wastewater, and storm water systems. ASCE Press. ISBN 0-7844-0573-5.
3. Shin, D., Lee, H., and Wonkyu,
P (2003) Stereroscopic GCP Simulation Model for the
Gurugnanam. B, Kalaivanan. K, Bairavi. S, and Vinoth. M 3D MODEL CONCEPTION OF KOLLI HILL USING GEOSPATIAL TECHNOLOGIES P a g e | 399
Modeling Algorithms, ISSDQ Proceedings, Hongkong, China,
4. Strahler AN (1952) Dynamic
basis for geomorphology. Bull Geol Soc Am 63:923–938
5. Suganthi, S and Srinivasan, K
(2010) Digital elevation model
Digital Elevation Model
Generation and Its Application in Landslide Studies Using Cartosat-1.
International Journal of Geomat ics and Geosciences, Vol.1, no.1, Pp. 41- 50.
6. Swaraj, J and Anji Reddy, M.,
(2013) Generation and