Clinical Epidemiology
Survival after liver resection in metastatic
colorectal cancer: review and meta-analysis
of prognostic factors
Gena P Kanas
1Aliki Taylor
2John N Primrose
3Wendy J Langeberg
4Michael A Kelsh
4Fionna S Mowat
1Dominik D Alexander
5Michael A Choti
6Graeme Poston
71Health Sciences, Exponent, Menlo Park, CA, USA; 2Centre for Observational Research, Amgen, Uxbridge, UK; 3Department of Surgery, Southampton General Hospital, Southampton, UK; 4Center for Observational Research, Amgen, Thousand Oaks, CA, USA; 5Health Sciences, Exponent, Chicago, IL, USA; 6Johns Hopkins Hospital, Baltimore, MD, USA; 7Department of Surgery, Aintree University Hospitals NHS, Liverpool, UK
Correspondence: Aliki Taylor Centre for Observational Research, Amgen, 1 Uxbridge Business Park, Sanderson Road, Uxbridge UB8 1DH, UK
Tel +44 1895 525 482 Fax +44 1895 525 104 Email alikit@amgen.com
Background: Hepatic metastases develop in approximately 50% of colorectal cancer (CRC) cases. We performed a review and meta-analysis to evaluate survival after resection of CRC liver metastases (CLMs) and estimated the summary effect for seven prognostic factors. Methods: Studies published between 1999 and 2010, indexed on Medline, that reported survival after resection of CLMs, were reviewed. Meta-relative risks for survival by prognostic factor were calculated, stratified by study size and annual clinic volume. Cumulative meta-analysis results by annual clinic volume were plotted.
Results: Five- and 10-year survival ranged from 16% to 74% (median 38%) and 9% to 69% (median 26%), respectively, based on 60 studies. The overall summary median survival time was 3.6 (range: 1.7–7.3) years. Meta-relative risks (95% confidence intervals) by prognos-tic factor were: node positive primary, 1.6 (1.5–1.7); carcinoembryonic antigen level, 1.9 (1.1–3.2); extrahepatic disease, 1.9 (1.5–2.4); poor tumor grade, 1.9 (1.3–2.7); positive margin, 2.0 (1.7–2.5); .1 liver metastases, 1.6 (1.4–1.8); and .3 cm tumor diameter, 1.5 (1.3–1.8). Cumulative meta-analyses by annual clinic volume suggested improved survival with increas-ing volume.
Conclusion: The overall median survival following CLM liver resection was 3.6 years. All seven investigated prognostic factors showed a modest but significant predictive relationship with survival, and certain prognostic factors may prove useful in determining optimal therapeutic options. Due to the increasing complexity of surgical interventions for CLM and the inclusion of patients with higher disease burdens, future studies should consider the potential for selec-tion and referral bias on survival.
Keywords: metastatic colorectal cancer, liver resection, survival, meta-analysis
Introduction
Hepatic metastases develop in approximately 50% of colorectal cancer cases,
1,2with
20%–25% of newly diagnosed metastatic colorectal cancer (mCRC) patients
present-ing with liver metastases at the time of primary diagnosis, and up to 50% of all CRC
patients developing metastatic liver disease after resection of primary CRC.
2–4Among
those with liver-limited colorectal metastases, it has been reported that 10%–30% of
patients have potentially resectable disease that can be treated with curative intent at
the time of detection.
5–9Among those patients with successful resection of all evident
metastatic disease, long-term survival appears to be improving, with 5-year survival
reported to be over 50% in recent studies.
2,3,10–14The purpose of this review was to evaluate studies published in the past decade
(1999–2010) that report survival of patients with liver resections for colorectal liver
Dove
press
R E v I E W
open access to scientific and medical research
Open Access Full Text Article
Clinical Epidemiology downloaded from https://www.dovepress.com/ by 118.70.13.36 on 20-Aug-2020
For personal use only.
Number of times this article has been viewed
This article was published in the following Dove Press journal: Clinical Epidemiology
metastases (CLMs). The current analysis updates information
on survival from a published review of these data in 2006.
15We estimated the association between seven prognostic
fac-tors reported to be predicfac-tors of survival
2,4,16,17in this patient
population, using meta-analysis techniques. Our analysis also
sought to evaluate the impact of annual clinic volume on the
association between prognostic factors and survival.
Materials and methods
Literature search strategy
Peer-reviewed English-language papers published between
January 1, 1999 and May 31, 2010 that reported survival after
surgical resection of CLM were identified using Medline,
accessed through PubMed. No review protocol is available.
All overlapping studies reported in the Simmonds et al
15review that met the basic inclusion criteria of the current
analysis were also included. The main search strategy used
the following keywords: surgery, resection, hepatectomy,
colon cancer, colorectal cancer, rectal cancer, metastatic,
mestastases, mortality, and survival. The full search strategy
is included in the Supplementary material. The bibliographies
of identified articles were examined to identify additional
literature. Reviews, meta-analyses, and case reports were
excluded, although their reference lists were reviewed for
additional studies. Case series were included, but were
required to report on at least ten patients.
Inclusion criteria
Our inclusion criteria were:
1. original publication (no reviews or commentaries);
2. clinical trials, case-control or cohort observational
studies;
3. case series of at least ten patients;
4. study populations aged at least 18 years;
5. patients with CLM;
6. patients with surgical liver resection;
7. median or mean follow-up time of at least 24 months;
and
8. reported outcome measures of overall and disease-free
survival.
If multiple publications reported results for survival after
liver resection in the same population, the most recent report
or the most comprehensive data were included. If an older
publication contained more comprehensive data than a more
recent one, the more comprehensive study was included.
In addition, if an older study contained unique prognostic
factor data, then this publication would also be included
in the prognostic-factor analysis. Data were extracted
from published papers by one reviewer using a standard
data-extraction database and then verified independently by
a second reviewer. For the meta-analysis, hazard ratios for
overall survival and 95% confidence intervals (CIs) were
extracted for each prognostic factor.
Summary of survival data
The following were identified and summarized for all included
studies: median disease-free interval between diagnosis of
primary cancer and diagnosis of metastasis; reported 3-, 5-,
and 10-year disease-free survival (DFS) rates; and reported
3-, 5-, and 10-year overall survival rates. Wherever possible,
survival information was summarized by the following patient
subgroups, which were determined a priori to be potentially
important determinants of survival (and as reported in the
literature):
4,15,18(1) isolated CLM (any number); (2) solitary
CLM; (3) extrahepatic disease; (4) initially unresectable
receiving preoperative chemotherapy; (5) initially resectable;
(6) synchronous liver metastases (metastases identified at
time of primary CRC diagnosis); and (7) metachronous liver
metastases (metastases occurring at a time period defined by
study authors after primary CRC diagnosis). All extracted
data were based on analyses from the first CLM resection.
Median survival rates were calculated for the overall patient
population, as well as for patient subgroups with specific
prognostic indications.
Median survival
To calculate a summary value of median survival time,
stud-ies that reported information on survival rates only in terms of
calendar intervals (eg, 1- or 3-year survival) were converted
using a simple interpolation to create a crude median survival
time. It was assumed that median survival time fell within
reported calendar-specific survival times, and that the
sur-vival line between the two time points that crossed the 50%
mark was linear. Summary medians and standard deviations
were calculated based on the reported or estimated median
values from each individual study.
Trends in survival by prognostic factors
We assessed the association between survival and seven
prognostic factors that previously had been reported in the
literature as predictors of survival.
2,4,16,17The prognostic
fac-tors included number of hepatic metastases, node-positive
compared to node-negative primary, poorly differentiated
compared to well or moderately primary, extrahepatic
disease compared to liver-only disease, tumor diameter,
car-cinoembryonic antigen (CEA) level, and positive compared
Dovepress
Kanas et al
Clinical Epidemiology downloaded from https://www.dovepress.com/ by 118.70.13.36 on 20-Aug-2020
to negative resection margins. For this study, we set the
fol-lowing cutoff points (cutoffs based on those reported in the
original articles) for the following prognostic factors in which
categories were required: CEA level
$
200, number of liver
metastases
.
1, and tumor diameter
.
3 cm. Median survival
time for each prognostic factor was plotted by published study
dates (1999–2010) separately, and, in addition, was stratified
by the seven prognostic factors.
Meta-analysis
Random-effects meta-analysis models were used to calculate
meta-relative risks (mRRs), 95% CIs, and corresponding
P
-values for heterogeneity for the seven prognostic factors.
The presence of significant heterogeneity (
P
,
0.10) indicates
that statistical variation between studies in a particular
meta-analysis model may invalidate data summaries;
19however,
lack of statistically significant heterogeneity may not be
suf-ficiently sensitive to indicate underlying variation between
studies. Further, a significant test for heterogeneity will not
indicate the source of variations among studies. Accordingly,
subgroup analyses were conducted by stratifying study
size and estimated patient volume per study center (termed
“annual clinic volume” herein) to identify potential sources
of between-study heterogeneity. The estimated annual clinic
volume was calculated as: initial patient population/number
of years over which patients were recruited/number of centers
participating in the study. Stratifications by study size and
annual clinic volume were based on the median number of
patients per center (n
=
236) and median annual clinic volume
(n
=
21) of all studies included in the meta-analysis. We
therefore stratified using values of 200 (
$
and
,
) and 20
(
$
and
,
), respectively. To visualize the mRR distribution
by annual clinic volume, cumulative meta-analysis plots by
each prognostic factor were created, adding each study one
at a time from low to high annual clinic volume. Sensitivity
analyses were conducted to determine the relative
influ-ence that a particular study had on a meta-analysis model.
Specifically, the “one study removed” sensitivity analysis
was used to assess the relative influence of each study on the
model-specific mRR. This was performed by generating an
mRR based on all studies, followed by the removal of one
study at a time to compare the overall mRR with mRRs from
models with one study removed.
Because study size is likely to be related directly to the
annual volume of patients seen at a liver-resection center (eg,
see
20), and with the volume of patients seen annually related
to survival, a cumulative meta-analysis based on annual clinic
volume size by study center per year (ie, number of patients
treated per year per center) was performed. This analysis was
conducted to determine whether clinic volume had an impact
on overall survival after CLM resection.
We examined the effect of publication bias, examined
visually by producing funnel plots that measure the
stan-dard error as a function of effect size, as well as performing
Begg’s adjusted-rank correlation test
21and Egger’s
regres-sion asymmetry test.
22All analyses were conducted with the
Comprehensive Meta-Analysis (CMA) version 2 (BioStat,
Englewood, NJ) statistical package.
Results
Our initial literature search identified 1493 articles published
between 1999 and May 2010. Among these, 1377 articles
were excluded because they did not meet inclusion criteria.
Of the studies identified, six included in our analyses
23–28were
also included in the earlier literature review by Simmonds
et al,
15published in 2006. A total of 116 articles were
identi-fied that reported survival after liver resection in adults with
mCRC and the modifying effect (if any) of other personal
and clinical factors on survival.
3,4,10–14,16,17,23–127After
account-ing for overlap of multiple publications reportaccount-ing on patients
from the same center (34 articles), our review included a total
of approximately 20,745 patients (range: 21–1600 patients
per study). Fifty-four of these studies were included in the
meta-analysis. Seventy-five studies (64.7%) reported median
follow-up times of 24–36 months, with the remainder
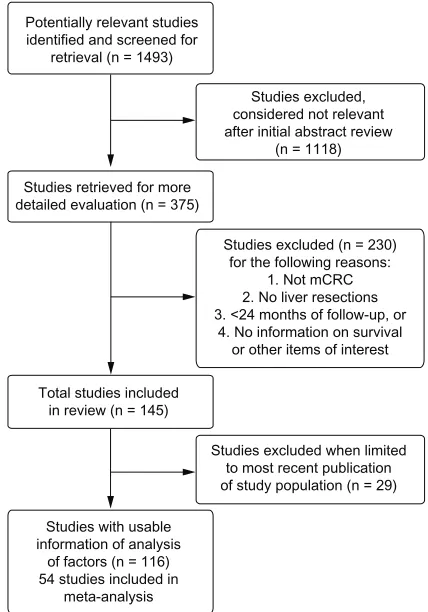
report-ing longer follow-up times. Figure 1 provides a diagram
illustrating the study selection and exclusion process.
Survival for metastatic colorectal
cancer following liver resection
Ninety-three studies reported overall survival after liver
resection in adults with CLM, with varying numbers of
studies by patient subgroup (Table 1). Of these, 64 reported
3-year survival (median 57.5%, range 29.7%–80.0%),
86 studies reported 5-year survival (median 38.0%, range
16.0%–74.0%), and 20 studies reported 10-year overall
survival (median 26.0%, range 9.0%–69.0%). Ten studies
reported median disease-free interval (median 15.9 months,
range 9.2–23.7 months). Twenty-six studies reported 5-year
DFS (median 24.7%, range 7.4%–48.0%), whereas six studies
reported 10-year DFS (median 20%, range 15.0%–33.7%).
Survival rates stratified by patient subgroups were reported
in 27 studies (Table 1); however, no studies reported 10-year
survival by subgroup. When evaluating CLM, median
sur-vival was highest in patients with solitary CLM, followed by
isolated CLM then CLM with extrahepatic disease. Median
Dovepress Hepatectomy survival in metastatic colorectal cancer
Clinical Epidemiology downloaded from https://www.dovepress.com/ by 118.70.13.36 on 20-Aug-2020
survival was higher in patients with metachronous compared
to synchronous disease, though data were limited. Patients
receiving preoperative chemotherapy had similar median
survival as those patients with initially resectable disease
without the need for chemotherapy, though again data were
limited.
Sixty-one studies were included in the summary of
median survival (Table 1). Of these, median survival times
were reported in 41 studies and were estimated for the
addi-tional 20 studies that reported survival rates that overlapped
50% but did not report median survival times. For patients
in all 61 studies, the overall summary median of the median
survival time was 3.6 (range 1.7–7.3) years. Comparison of
median survival by publication date from most recent (2010)
to oldest (1999) did not suggest an improvement in median
survival in more recent years (data not shown); however, as
some of the more recent publications reported survival from
patients diagnosed decades earlier, it was not possible to make
accurate approximations between publication date and date
of treatment and subsequent survival. The median survival
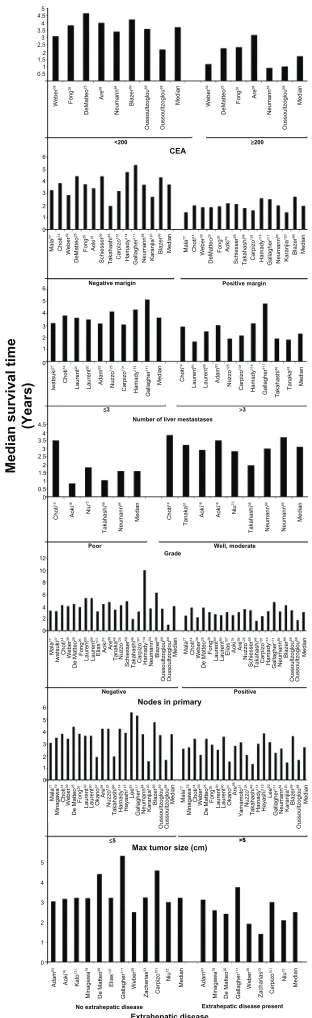
varied by the prognostic factor studied (Figure 2). Median
survival was better in patients with CEA level
,
200 than
in those with CEA level
$
200. In patients with a negative
Potentially relevant studies identified and screened for
retrieval (n = 1493)
Studies retrieved for more detailed evaluation (n = 375)
Total studies included in review (n = 145)
Studies excluded when limited to most recent publication of study population (n = 29) Studies with usable
information of analysis of factors (n = 116) 54 studies included in
meta-analysis
Studies excluded, considered not relevant after initial abstract review
(n = 1118)
Studies excluded (n = 230) for the following reasons:
1. Not mCRC 2. No liver resections 3. <24 months of follow-up, or
4. No information on survival or other items of interest
Figure 1 A diagram illustrating the study selection and exclusion process.
Table
1
Summary of survival by patient group (3- and 5-year overall and median
a)
Patient group
Number of studies Overall survival (3-year) Number of studies Overall survival (5-year) Number of studies Mean survival (years) Median survival (range)
All patients
64
Mean: 57.6% Median: 57.5% (range 29.7%–80.0%)
86
Mean: 40.3% Median: 38.0% (range 16.0%–74.0%)
61
3.8
3.6 (1.7–7.3)
Solitary CLM
14
Mean: 61.0% Median: 66.1% (range 33.4%–79.0%)
21
Mean: 47.4% Median: 44.6% (range 27.0%–71.0%)
14
3.6
3.6 (1.8–4.8)
Extrahepatic CLM
10
Mean: 39.8% Median: 43.0% (range 9.0%–75.0%)
14
Mean: 23.5% Median: 22.5% (range 0%–48.0%)
8
2.5
2.5 (1.4–3.8)
Isolated CLM
10
Mean: 53.6% Median: 52.5% (range 33.0%–78.0%)
15
Mean: 38.5% Median: 38.0% (range 16.0%–73.0%)
11
3.5
3.2 (2.5–5.3)
Preoperative chemotherapy
b
14
Mean: 54.6% Median: 52.5% (range 20.8%–79.0%)
13
Mean: 36.6% Median: 37.0% (range 7.8%–79.0%)
16
3.2
3.3 (1.5–5.2)
Initially resec
table
without
the need for chemotherapy
c
12
Mean: 54.6% Median: 54.8% (range 40.6%–71.0%)
10
Mean: 40.7% Median: 38.1% (range 30.0%–68.0%)
12
3.3
3.3 (1.9–5.4)
Synchronous
d
15
Mean: 46.3% Median: 46.1% (range 19.3%–81.3%)
27
Mean: 36.5% Median: 34.2% (range 11.2%–74.0%)
16
3.1
3.2 (1.7–4.2)
Metachronous
14
Mean: 57.6% Median: 57.8% (range 34.4%–91.0%)
26
Mean: 42.6% Median: 41.9% (range 23.0%–73.0%)
20
3.3
3.3 (1.5–4.2)
Notes:
aSummary
of
median
survival
reported
or
estimated
from
the
studies
included,
see
methods
for
details
on
estimation;
bincludes
three
studies
of
patients
with
preoperative
chemotherapy
only
(Gallagher
et
al,
111 Kishi
et
al,
123
Neumann et al
84); cincludes studies that compared preoperative chemotherapy to no preoperative chemotherapy only; done study in synchronous patient populations only (de Santibañes et al 105).
Abbreviation:
CLM, colorectal cancer liver metastasis.
Dovepress
Kanas et al
Clinical Epidemiology downloaded from https://www.dovepress.com/ by 118.70.13.36 on 20-Aug-2020
5 4.5 4 3.5 3 2.5 1.5 0.5 CEA
<200 ≥200
Negative marigin
≤3 >3
Well, moderate Poor
Positive Negative
>5
Extrahepatic disease present No extrahepatic disease
≤5
Max tumor size (cm)
Extrahepatic disease Nodes in primary
Positive margin
Number of liver mestastases
Median survival tim
e (Years) Grade Webe r 39 Webe r 39 Fong 26 Fong 26 DeMatteo 25 DeMatteo 25 Ar e 98 Ar e 98 Neuman n 84 Neuman n 84 Blazer 99 Oussoultzoglo u 69 Oussoultzoglo u 68 Oussoultzoglo u 68 Median Median 1 2 4.5 4 3.5 3 2.5 1.5 0.5 0 1 2 6 5 4 2 1 0 6 5 4 2 3 1 0 12 10 8 4 6 2 0 6 5 4 2 3 1 0 5 4 2 3 1 0 3 Adam 93 Mala 77 Minagaw a 79 Chot i 14 Webe r 39 De Matte o 25 Fong 26 Lauren t 90 Lauren t 90 Okan o 67 Ar e 98 Nuzz o 12 5 Takahashi 46 Hamady 11 4 Hayashi 11 5 Le e 92 Gallagher 11 1 Neumann 84 Karanjia 12 0 Blazer 99 Oussoultzoglou 69 Oussoultzoglou 68 Mala 77 Chot i 14 Iwatsuk i 27 Webe r 39 De Matteo 25 Fong 26 Lauren t 90 Lauren t 90 E lia s 10 7 Aoki 16 E lia s 10 7 Aoki 16 Tanaka 49 Schiesse r 59 Carpizo 10 1 Ar e 98 Nuzz o 12 5 Takahashi 46 Hamady 11 4 Neumann 84 Blazer 99 Oussoultzoglou 69 Oussoultzoglou 68 Mala 77 Chot i 14 Webe r 39 De Matte o 25 Fong 26 Lauren t 90 Lauren t 90 Ar e 98 N uz zo 12 5 Schiesse r 59 Carpiz o 10 1 Gallagher 11 1 Takahashi 46 Hamady 11 4 Neumann 84 Blazer 99 Oussoultzoglo u 69 Oussoultzoglo u 68 Median Median Mala 77 Minagaw a 79 Chot i 14 Webe r 39 De Matte o 25 Fong 26 Lauren t 90 Lauren t 90 Okan o 67 Ar e 98 Yamamot o 31 Nuzz o 12 5 Takahashi 46 Hamady 11 4 Hayashi 11 5 Le e 92 Gallagher 11 1 Neumann 84 Karanjia 12 0 Blazer 99 Oussoultzoglou 68 Median Median Chot i 14 Aoki 16 Ni u 72 Takahashi 46 Neumann 84 Median Chot i 14 Tanaka 51 Aoki 16 Aoki 16 Ni u 72 Takahashi 46 Neumann 84 Neumann 84 Median Iwatsuk i 27 Choti 14 Takahashi 46 Tanak a 48 Median Median Mala 77 Choti 14 Webe r 39 DeMatteo 25 Fong 26 Aok i 16 Schiesser 59 Takahash i 46 Carpizo 10 1 Hamady 114 Gallaghe r 111 Neuman n 84 Karanjia 12 0 Blazer 99 Mala 77 Choti 14 Webe r 39 DeMatteo 25 Fon g 26 Aok i 16 Schiesser 59 Takahash i 46 Carpizo 10 1 Hamady 114 Gallaghe r 11 1 Neuman n 84 Karanjia 12 0 Blazer 99 Median Laurent 91 Laurent 90 Adam 93 Nuzzo 12 5 Carpizo 10 1 Hamady 11 4 Gallagher 11 1 Choti 14 Laurent 91 Laurent 90 Adam 93 Nuzzo 12 5 Carpizo 10 1 Hamady 11 4 Gallaghe r 11 1 Median Aoki 16 Kato 12 1 Minagaw a 79 De Matte o 25 E lia s 10 7 Gallagher 11 1 Webe r 39 Zacharia s 33 Carpiz o 10 1 Ni u 72 Median Adam 93 Minagaw a 79 De Matte o 25 Gallagher 11 1 Webe r 39 Zacharia s 33 Carpiz o 10 1 Ni u 72 Median
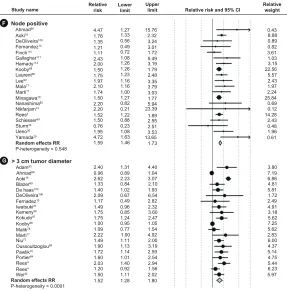
Figure 2 Meta-analysis forest plots of the relative risk and 95% confidence intervals
of survival after liver resection in metastatic colorectal cancer reported in the literature for each of the seven identified prognostic factors.
Abbreviation: CEA, carcinoembryonic antigen.
tumor margin, survival was better than in those with a
posi-tive margin, as was survival in patients with fewer than three
liver metastases compared to those with at least three liver
metastases. Patients with poor grade had poorer median
survival than those with good or moderate grade reported,
as did those with negative nodes compared to patients with
positive nodes (Figure 2).
Meta-analysis
Risk estimates from multivariate analyses estimating
sur-vival were obtained from each study and meta-analyzed for
the seven prognostic factors. All prognostic factors were
found to be statistically significantly associated with lower
survival (Figure 3). Table 2 summarizes the mRRs for each
of the prognostic factors overall, by study size and by annual
clinic volume. mRRs were elevated for each of the
prognos-tic factors and ranged from the lowest mRR of 1.52 (95%
CI, 1.28–1.80) for
$
3-cm tumor diameter to the highest of
2.02 (95% CI, 1.65–2.48) for positive resection margin. The
test for heterogeneity was significant for all our analyses of
prognostic factors, except for the analysis of positive primary
nodal status (
P
=
0.55). However, all individual studies, with
few exceptions, observed elevated hazard ratios for each
prognostic factor. Thus, even though statistical heterogeneity
was observed, the directionality of the individual studies was
virtually uniform. Study characteristics for the 54 studies
included in the meta-analysis are shown in Table 3.
Plots for publication bias were created for each of the
prognostic factors (results not shown). In general, the plots
showed symmetry around the plotted summary log-relative
risk, suggesting that publication bias was not large and was
unlikely to drive the conclusions; however, all of the
log-hazard ratios were greater than zero, with few studies
report-ing null or protective estimates for the prognostic factors.
Stratification by study size of 200 study subjects or fewer
and stratification by annual clinic volume (
,
20 vs
$
20
patients) resulted in marked differences in mRRs for some
of the prognostic factors (CEA level, extrahepatic disease,
tumor grade and positive resection margin). Each prognostic
factor listed in Table 2 was associated with stronger mRRs in
studies of greater than 200 subjects (vs
,
200) and in
stud-ies of annual volume per study center of 20 or more patients
(vs
,
20), with the exception of 1
+
liver metastases in the
clinic volume analysis. Cumulative meta-analyses generally
indicated better prognosis by annual clinic volume within the
categories of prognostic factors analyzed for positive
resec-tion margin, extrahepatic disease, CEA level, tumor diameter,
and node-positive status, but this trend was not apparent for
1
+
liver metastases or tumor grade (Figure 4).
Sensitivity analysis
We conducted several sensitivity analyses to determine the
relative impact or influence that each study had on the
over-all model-specific mRR. For CEA level, one study
96had a
very different point estimate and CI from the other studies,
but contributed only
,
1% of the relative weight; therefore,
Dovepress Hepatectomy survival in metastatic colorectal cancer
Clinical Epidemiology downloaded from https://www.dovepress.com/ by 118.70.13.36 on 20-Aug-2020
Ahmad96 Study name CEA Level A B C Extrahepatic disease
Tumor grade (Poor differentiation) Relative
risk Lowerlimit Upperlimit Relative risk and 95% CI Relativeweight
0.18 2.01 2.90 1.00 2.90 7.14 1.51 2.33 0.73 1.92 3.07 1.70 3.40 1.00 1.37 2.65 1.41 1.50 3.22 1.50 2.34 1.98 5.30 1.88 2.50 1.23 1.54 0.71 1.14 1.96 1.04 1.16 1.08 1.05 1.35 1.26 1.32 1.50 3.76 2.35 7.51 1.41 1.64 3.58 1.91 1.94 9.62 2.14 4.05 3.12 21.30 2.37 0.00 1.11 1.58 0.44 1.49 2.30 0.72 1.48 0.55 1.14 479.05 22.18 3.17 3.68 0.97 3.22 3.64 5.33 2.27 5.65 0.42 8.98 11.88 14.01 15.03 13.02 12.92 11.27 12.47 10.17 9.30 9.26 9.72 3.15 8.73 6.77 7.72 2.19 9.05 4.77 8.83 10.34 18.78 7.96 15.76 16.78 14.85 4.66 21.20 2.83 3.82 1.79 1.73 1.53 2.26 1.22 1.88 2.08 1.41 1.12 1.14 0.91 0.53 1.06 1.32 3.86 10.36 2.87 2.64 2.58 9.63 1.41 2.67
0.1 0.2 0.5 1 2 5 10 Choti14 DeMatteo25 DeOliveira106 Mala77 Oussoultzoglou68 Pawlik70 Reddy65 Reissfelder55
P-heterogeneity < 0.0001
Random effects SRRE
Aoki16 De Haas103 DeMatteo25 Elias107 House116 Kanemitsu119 Kokudo87 Kooby88 Marti17
P-heterogeneity < 0.0001 Niu72
Reddy65 Rees4 Wicherts42
Random effects SRRE
Aoki16 Fernandez10 Niu72 Kanemitsu119 Rees4 Sturm44 Wang38
P-heterogeneity < 0.0001
Random effects RR
Choti14 DeMatteo25 DeOliveira106
P-heterogeneity < 0.0001Random effects SRRE Aoki16
D
E
Study name
Positive resection margin
1 + liver metastases
Relative
risk Lowerrisk Upperlimit Relative risk and 95% CI
Blazer99 Chiu102 Gallagher111 Hamady114 Hayashi115 House116 Kaibori118 Kishi123 Kooby88 Korita89 Malik78 Nikfarjam13 Pawlik70 Rees4 Schiesser59 Wei40 DeOliveira106 Capussotti100 Blazer99 Adam93 Ahmad96 Aoki16 Kishi123 IwatsukiFinch 27
110 Elias107 Elias107 Farid109 Fernandez10 Kooby88 Oussoultzoglou69 Nikfarjam13 Minagawa79 Marti17 MalikLee78 92 Laurent90 Kokudo87 Petrowsky63 Pawlik70 Portier64 Reddy65 Rees4 Wicherts42 Yamamoto31 Wei40 Van der pool34 Ueno36 Sturm44 Shah61 Schiesser59 Sasaki58
P-heterogeneity < 0.0001
Random effects RR
1.70 1.77 6.40 3.50 2.20 1.57 2.41 2.00 3.01 1.18 2.65 2.30 2.00 6.45 1.11 1.50 1.45 2.40 2.10 2.90 2.02 1.25 1.00 1.53 1.06 1.21 0.82 1.06 1.34 0.96 1.03 0.83 1.11 1.60 3.25 0.80 0.13 0.80 1.64 1.09 1.57 1.65 2.31 3.14 26.77 11.56 4.00 3.02 5.47 2.99 9.41 1.36 8.47 4.75 2.50 12.80 1.56 18.00 2.63 3.51 4.05 5.35 2.48 7.90 5.44 1.66 2.22 5.23 4.82 3.74 6.99 2.38 9.19 2.32 4.31 8.61 4.59 7.61 0.62 5.26 7.19 4.78 5.13 3.06 1.32 4.64 2.43 2.14 1.20 3.65 3.99 3.43 1.06 2.81 3.68 2.03 4.34 5.45 3.28 2.82 2.96 1.85 5.04 0.36 2.81 3.07 1.07 2.45 3.89 4.27 1.13 2.58 4.46 1.33 2.29 3.29 4.12 0.29 1.39 3.71 11.59 2.51 2.75 2.78 5.24 2.45 1.65 2.47 3.16 2.75 2.50 2.55 0.91 1.15 3.03 2.79 3.31 4.38 1.52 14.85 3.32 2.79 3.14 3.50 1.99 1.73 8.91 1.56 2.08 3.24 3.53 2.75 1.89 161.25 6.35 1.78
0.1 0.2 0.5 1 2 5 10 2.34 4.62 2.01 1.54 1.46 1.97 1.70 1.20 1.65 1.10 1.66 1.74 1.30 0.70 1.10 1.98 1.69 2.05 2.12 1.30 2.10 2.00 1.76 1.10 1.97 1.43 131 3.22 0.90 1.62 1.30 1.91 1.80 1.40 18.40 2.62 1.57 1.48 1.84 1.61 0.86 0.76 0.74 1.18 0.87 1.11 0.38 1.00 1.21 0.66 0.54 1.05 1.29 1.02 1.27 1.03 1.11 0.30 1.21 1.11 0.38 1.11 1.03 0.99 1.16 0.52 1.26 0.52 1.04 1.18 1.04 2.10 1.08 1.39
Figure 3 (Continued)
Dovepress
Kanas et al
Clinical Epidemiology downloaded from https://www.dovepress.com/ by 118.70.13.36 on 20-Aug-2020
Figure 3 Summary of median survival after liver resection for metastatic colorectal cancer reported or estimated from the studies included.
Note: Results are shown by date of publication as well as the seven identified prognostic factors.
Abbreviations: CEA, carcinoembryonic antigen; CI, confidence interval.
Fernandez10 Finch110 DeOliveira106
P-heterogeneity = 0.548
Random effects RR
Aoki16
Blazer99 Gallagher111 Hamady114 Kooby88 Ahmad96
Node positive F
G > 3 cm tumor diameter
Study name Relativerisk Lowerlimit Upperlimit Relative risk and 95% CI Relativeweight
Marti17 Minagawa79 Mala77 Lee92
Nanashima82
Rees4 Schiesser59 Sturm44 Ueno36 Yamada29 Laurent90
Malik78 Nikfarjam13
P-heterogeneity < 0.0001
Random effects RR
Aoki16
Kooby88 Kokudo87 Kemeny28 Iwatsuki27 Fernadez10 DeOliveira106 De haas103 Adam93
Oussoultzoglou69 Niu72 Marti17
Pawlik70 Portier64 Rees4 Rees4 Wei40
4.47 1.76 1.35 1.21 1.11 2.43 2.00 1.50 1.75 1.97 2.10 1.74 1.50 2.20 2.20 1.52 1.50 0.76 1.95 4.72 1.59
1.27 1.33 0.56 0.49 0.72 1.08 1.26 1.26 1.23 1.16 1.16 1.00 1.27 0.82 0.21 1.22 0.88 0.23 1.08 1.63 1.46
15.76 2.32 3.24 3.01 1.72 5.49 3.19 1.79 2.48 3.35 3.79 3.03 1.77 5.94 23.39 1.89 2.55 2.51 3.53 13.65 1.73
0.43 8.88 0.89 0.82 3.61 1.03 3.15 22.56 5.57 2.43 1.97 2.24 25.84 0.69 0.12 14.28 2.43 0.48 1.96 0.61
3.80 7.19 6.86 4.81 5.81 1.72 2.49 4.91 3.18 5.62 7.25 5.62 2.83 6.00 4.37 5.14 4.75 5.44 6.23 5.97 4.40
1.04 3.07 2.10 1.93 6.54 2.82 2.32 3.60 2.47 1.05 1.54 4.92 2.00 3.19 2.59 2.54 2.94 1.56 2.02 1.80 1.31 0.89 2.23 0.84 1.02 0.67 0.49 0.96 0.85 1.24 0.95 0.77 1.00 1.11 1.13 1.14 1.01 1.40 0.92 1.11 1.28 2.40 0.96 Ahmad96
2.62 1.33 1.40 2.09 1.17 1.49 1.75 1.75 1.00 1.09 2.22 1.49 1.90 1.72 1.60 2.03 1.20 1.50 1.52
keeping or removing this study did not appreciably change
the mRR for CEA level. In the studies reporting extrahepatic
disease, one study
107also reported metastases to the lung;
however, no effect was seen on the mRR when this study
was removed from the analysis. Overall, the meta-analysis
models were generally robust to study removal and
replace-ment, indicating little appreciable influence at the individual
study level.
Discussion
Observed median 5-year survival after liver resections for
CLM in this review was 38% (range 16%–74%), compared to
30% (range 15%–67%) reported in an earlier review of
stud-ies published before 2001.
15After resection of CLM, median
5- and 10-year survival rates were 38% and 26%, respectively.
Comparison of change in median survival over study time
period did not show a trend of increasing survival, and this was
also true when looking at the prognostic factors individually.
Some of the more recent publications included in this review
reported survival from patients diagnosed decades earlier;
therefore, it may not be possible to make accurate
approxi-mations between publication date and date of treatment and
subsequent survival. It may also be difficult to show trends
in survival given the increasing role of surgical intervention
in CLM.
2,128,129In addition, more complicated cases such as
patients with multiple metastases or extrahepatic disease are
now considered standard surgical candidates.
2,128,129Inclusion
of complicated cases may improve survival on a
patient-by-patient basis, although the incremental gain across a larger
patient population with a wider range of patient severity may
not yet be observed when those with more severe disease are
included.
128The instrumentation to evaluate the degree of
hepatic involvement and surgical technique has also improved,
allowing surgeons to make more informed decisions when
selecting surgical candidates.
2,128All the mRRs for the prognostic factors reviewed and
meta-analyzed were statistically significantly associated with poorer
survival. All seven factors exceeded unity on the forest plots
(Figure 3). Significant heterogeneity was observed for all but
one prognostic factor, which may be partially attributable to
variation in clinic volume or study center size, patient selection,
or clinical parameters. Our cumulative meta-analyses by annual
clinic volume suggested improved survival with increasing
clinic volume for each prognostic factor, consistent with
obser-vations by others.
128Associations for the prognostic factors
were stronger in magnitude among studies of 200 or more
subjects (vs
,
200) and among studies of annual clinic volume
of 20 or more patients (vs
,
20).
Dovepress Hepatectomy survival in metastatic colorectal cancer
Clinical Epidemiology downloaded from https://www.dovepress.com/ by 118.70.13.36 on 20-Aug-2020
Table
2
Summary of calculated meta-relative risks (mRRs) for the seven prognostic factors of interest, including mRRs stratified by study size and annual patient volume
a
Prognostic factor
Number of studies Overall mRR (95% CI)
P
-value
b
Number of studies mRR (95% CI) by study size
P
-value
Number of studies
c
mRR (95% CI) by patient volume per study center
P
-value
CEA level (
$ 200) 9 1.92 (1.14–3.22) , 0.0001 , 200: 4 $ 200: 5 ,
200: 2.49 (0.96–6.49)
$
200: 1.68 (0.90–3.14)
, 200: 0.034 $ 200: , 0.0001 , 20: 4 $ 20: 4 ,
20: 2.19 (1.64–2.9)
$
20: 1.23 (0.51–2.96)
,
20: 0.616
$
20: 0.001
Extrahepatic disease (yes vs no)
13 1.88 (1.50–2.37) , 0.0001 , 200: 3 $ 200: 10 ,
200: 2.43 (1.22–4.83)
$
200: 1.74 (1.41–2.15)
, 200: , 0.0001 $ 200: 0.001 , 20: 5 $ 20: 8 ,
20: 2.35 (1.66–3.34)
$
20: 1.55 (1.28–1.88)
,
20: 0.001
$
20: 0.032
Tumor grade (poor differentiation)
7 1.88 (1.32–2.67) , 0.0001 , 200: 3 $ 200: 4 ,
200: 2.88 (2.15–3.84)
$
200: 1.43 (1.15–1.78)
, 200: 0.808 $ 200: 0.195 , 20: 4 $ 20: 2 ,
20: 2.51 (1.91–3.29)
$
20: 1.65 (1.19–2.29)
,
20: 0.356
$
20: 0.713
Positive resection margin (yes vs no)
20 2.02 (1.65–2.48) , 0.0001 , 200: 9 $ 200: 11 ,
200: 2.52 (1.73–3.66)
$
200: 1.82 (1.44–2.30)
, 200: 0.044 $ 200: , 0.0001 , 20: 10 $ 20: 10 ,
20: 2.53 (1.77–3.61)
$
20: 1.79 (1.41–2.27)
, 20: 0.044 $ 20: , 0.0001 1 + liver metastases d 36 1.57 (1.39–1.78) , 0.0001 , 200: 17 $ 200: 19 ,
200: 1.74 (1.29–2.34)
$
200: 1.52 (1.34–1.71)
, 200: , 0.0001 $ 200: , 0.0001 , 20: 16 $ 20: 19 ,
20: 1.46 (1.20–1.79)
$
20: 1.66 (1.40–1.96)
, 20: , 0.0001 $ 20: , 0.0001
Node positive (yes vs no)
20 1.59 (1.46–1.73) 0.548 , 200: 13 $ 200: 7 ,
200: 1.84 (1.55–2.19)
$
200: 1.52 (1.38–1.67)
, 200: 0.626 $ 200: 0.645 , 20: 13 $ 20: 7 ,
20: 1.64 (1.47–1.84)
$
20: 1.55 (1.33–1.79)
,
20: 0.632
$
20: 0.309
.
3 cm tumor diameter
20 1.52 (1.28–1.80) , 0.0001 , 200: 11 $ 200: 9 ,
200: 1.57 (1.24–1.98)
$
200: 1.43 (1.24–1.64)
, 200: , 0.0001 $ 200: 0.754 , 20: 5 $ 20: 13 ,
20: 2.00 (1.51–2.64)
$
20: 1.32 (1.15–1.51)
, 20: 0.058 $ 20: , 0.0001 Notes: aThe estimated annual clinic volume was calculated as: initial patient population/num ber of years over which patients were recruited/number of centers participating in the study. Stratifications by study size and annual clinic volume were based on the median number of patients per center (n = 236) and median annual clinic volume (n = 21) of all studies included in the meta-analysis, thus the stratifications were performed using values of 200 ( $ and , ) and 20 ( $ and , ), respectively;
bP-value
is for heterogeneity of meta-analysis for all columns; cnumber of studies included in the analysis by patient volume not equal to total number of studies; data were not reported in some studies to
calculate a patient volume;
dincludes variety of categories: “multiple” and various iterations
of more than one metastas
is.
Abbreviations:
CEA, carcinoembryonic antigen; CI, confidence interval.
Long-term survival of all patients with mCRC, both
operable and inoperable, has been improving significantly
over the last two decades.
121,130,131Increased use of liver
resec-tion has played some part in these improving outcomes, but
wide variations in its use persist.
130Still, for the approximately
20% of patients with liver-limited metastases whose disease
is determined to be resectable,
132hepatectomy with curative
intent is now the standard of care. To be more clinically
use-ful, long-term survival after liver resection for mCRC should
report 10-year survival. Of the 93 studies we identified that
reported survival, only 20 (22%) reported 10-year survival
rates, whereas the majority reported 3- or 5-year survival.
Throughout the 1990s, if studies reported long-term survival,
these outcomes consistently examined 3- or 5-year
disease-free and/or overall survival; however, disease can still recur,
133and in line with our results, published results show 40%
survival after 5 years posthepatectomy, and slightly less than
30% after 10 years. Therefore, disease will recur in 70% of
patients following CLM, with the majority in the first 2 years
but continuing to occur up to 10 years after such surgery.
Several confounders need to be considered when
evaluat-ing survival after resection of CLM. Patient characteristics
may play a role, and advanced age has been considered a
barrier to offering liver resection.
26The issue of patient
selec-tion has already been discussed, where surgical intervenselec-tion
is now offered to patients presenting with multiple
metasta-ses, large tumor size, and extrahepatic or other underlying
liver disease.
2,128Recent data
134,135from large single centers
and international registries demonstrate an association of
disease-free and overall survival in older patients with higher
operative mortality (4.7% for those over 70, compared to
1.2% for those under 70); however, subsequent disease-free
and overall survival are the same, regardless of age.
When analyzing resection data over the study period,
the definition of surgical resectability of CLM is not always
defined. In the late 1990s, such surgery was offered only
to patients with liver-limited disease that was (1) ideally
detected metachronously after a previous potentially
cura-tive resection of the primary tumor; (2) confined to only one
lobe of the liver; (3) showed no more than three metastases,
the largest of which was no greater than 5 cm in diameter;
or (4) could be resected on intention to treat with at least
a
.
1 cm margin of healthy liver tissue.
8,136Based on these
criteria, the option of liver surgery would be restricted to
the small portion (
,
10%)
136of all patients with liver-limited
disease. At present, the definition of resectability is disease
within the liver, even in the presence of resectable
extrahe-patic disease, that can be resected, leaving two disease-free
Dovepress
Kanas et al
Clinical Epidemiology downloaded from https://www.dovepress.com/ by 118.70.13.36 on 20-Aug-2020
Table
3
Study characteristics for the 54 studies included in the meta-analysis
Study
Country
Study type
Study dates
Age at surgery, median years (range) Number resected Follow-up (months) Prognostic factors reported
Adam
93
France
Cohort
1993–2000
59.5 (32–78)
138
48.7
Number of metastases Tumor size
Ahmad
96
US
Cohort
1997–2003
63 (28–85)
64
10
CEA level Number of metastases Positive primary node Tumor size
Aoki
16
Japan
Cohort
1988–2005
64 (27–83)
187
25
Extrahepatic disease Primary tumor grade Positive margin Number of metastases
Blazer
99
US
Cohort
1997–2007
57 (26–85)
305
25
Positive margin Number of metastases Tumor size
Capussotti
100
Italy
Cohort
1985–2004
mean Syn (n
=
70): 64.9 (37–83)
mean Meta (n
=
57): 60.8 (39–83)
127
38.2
Number of metastases
Chiu
102
Taiwan
Case series
1977–2004
58 (SD 11)
166
24.6
Positive margin
Choti
14
US
Case series
1984–1999
62 (32–87)
226
121
CEA level Positive margin
de Haas
104
France
Case series
1990–2006
–
806
.
40
Extrahepatic disease Tumor size
DeMatteo
25
US
Case series
1985–1998
65 (28–87)
267
25
CEA level Extrahepatic disease Positive margin
DeOliveira
106
US
Case series
1998–2004
64 (22–87)
84
26.2
CEA level Positive margin Number of metastases Positive primary node Tumor size
Elias
107
France
Cohort
1987–2000
58 (18–86)
308
99
Extrahepatic disease Number of metastases
Farid
109
UK
Case series
1993–2007
46 (23–91)
705
38
Number of metastases
Fernandez
10
US
Cohort
1995–2002
61.1 (23–86)
100
31
Primary tumor grade Number of metastases Positive primary node Tumor size
Finch
110
UK
Cohort
1993–2003
61 (23–84)
484
33
Positive margin Number of metastases Positive primary node
(
Continued
)
Dovepress Hepatectomy survival in metastatic colorectal cancer
Clinical Epidemiology downloaded from https://www.dovepress.com/ by 118.70.13.36 on 20-Aug-2020
Table
3
(
Continued
)
Study
Country
Study type
Study dates
Age at surgery, median years (range) Number resected Follow-up (months) Prognostic factors reported
Gallagher
111
US
Cohort
1995–2003
61 (27–85)
111
63
Positive margin Positive primary node
Hamady
114
UK
Case series
1993–2001
61 (38–80)
293
29
Positive margin Positive primary node
Hayashi
115
Japan
Case series
1993–2006
60 (33–80)
53
27.9
Positive margin
House
116
US
Cohort
1985–2004
1985–1998 (n
=
1037): 63.1 (20–87)
1999–2004 (n
=
563): 61.5 (23–89)
1600
36
Extrahepatic disease Positive margin
Iwatsuki
27
US
Case series
1981–1996
60 (26–82)
305
36
Number of metastases Positive margin
Kaibori
118
Japan
Cohort
1993–2007
Syn (n
=
32): 62.3 (SD 9.3)
Meta (n
=
42): 65.0 (S 9.9)
74
31
Positive margin
Kanemitsu
119
Japan
Cohort
1990–1998
61 (28–88)
578
55.2
Extrahepatic disease Primary tumor grade
Kemeny
28
US
Clinical trial
NR
Combined therapy (n
=
74): 59 (28–79)
Monotherapy (n
=
82): 59 (30–77)
156
62.7
Tumor size
Kishi
123
US
Cohort
1997–2007
57 (23–86)
200
29
Positive margin Number of metastases
Kokudo
87
Japan
Case series
1980–2000
59.0 (35–82)
194
29.1
Extrahepatic disease Number of metastases Tumor size
Kooby
88
US
Cohort
1986–2001
–
1351
35
Extrahepatic disease Positive margin Number of metastases Positive primary node Tumor size
Korita
89
Japan
Cohort
1990–2004
64 (32–80)
105
124
Positive margin
Laurent
90
France
Case series
1985–2000
63 (31–86)
311
29
Number of metastases Positive primary node
Lee
92
Korea
Cohort
1994–2005
59 (26–79)
138
47.2
Number of metastases Positive primary node
Mala
77
Norway
Case series
1977–1999
61 (23–79)
137
27
CEA level Positive primary node
Malik
78
UK
Case series
1993–2006
64 (23–87)
687
34
Positive margin Number of metastases Tumor size
Marti
17
Spain
Case series
1994–2006 (Split periods: 1994–2000; 2000–2006)
1994–2000 (n
=
93): 63.9 (40–81)
2000–2006 (n
=
143): 62.5 (36–81)
236
69.6
Extrahepatic disease Number of metastases Positive primary node Tumor size Dovepress
Kanas et al
Clinical Epidemiology downloaded from https://www.dovepress.com/ by 118.70.13.36 on 20-Aug-2020
Minagawa
79
Japan
Case series
1980–2002
–
369
47.4
Number of metastases Positive primary node
Nanashima
82
Japan
Case series
1990–2006
63 (24–85)
130
56
Positive primary node
Nikfarjam
13
US
Case series
2002–2007
66 (44–86)
65
24
Positive margin Number of metastases Positive primary node
Niu
72
Australia
Case series
1990–2006
Mean 62 (SD 11)
415
25
Extrahepatic disease Primary tumor grade Tumor size
Oussoultzoglou
69
France
Case series
2000–2004
Mean 63.7 (39.7–84.2)
213
34.7
Number of metastases Tumor size
Oussoultzoglou
68
France
Case series
2000–2006
58.4 (29–78)
45
25.5
CEA level
Pawlik
70
US Italy Switzerland
Cohort
1990–2004
60 (19–88)
557
29
CEA level Positive margin Number of metastases Tumor size
Petrowsky
63
Germany
Case series
1985–1995
61 (20–75)
41
39
Number of metastases
Portier
64
France Switzerland
Clinical trial
1991–2001
–
171
87.4
Number of metastases Tumor size
Reddy
65
US
Cohort
1985–2005
57 (49–66)
449
48
CEA Extrahepatic disease Number of metastases
Rees
4
UK
Case series
1987–2005
62 (25–86)
929
26.4
Extrahepatic disease Primary tumor grade Positive margin Number of metastases Positive primary node Tumor size
Reissfelder
55
Germany
Cohort
2002–2008
63 (30–88)
281
36
CEA level
Sasaki
58
Japan
Case series
1985–2003
Mean 64.0
103
24
Number of metastases
Schiesser
59
Australia
Case series
1992–2005
64 (22–92)
197
54
Positive margin Number of metastases Positive primary node
Shah
61
Canada
Cohort
1996–2004
64 (23–90)
841
24
Number of metastases
Sturm
44
Germany
Case series
1985–1995
61 (20–75)
40
40
Primary tumor grade Number of metastases Positive primary node
Ueno
36
Japan
Case series
1985–1996
Average 60.2 (33–79)
85
52
Number of metastases Positive primary node
(
Continued
)
Dovepress Hepatectomy survival in metastatic colorectal cancer
Clinical Epidemiology downloaded from https://www.dovepress.com/ by 118.70.13.36 on 20-Aug-2020
Table
3
(
Continued
)
Study
Country
Study type
Study dates
Age at surgery, median years (range) Number resected Follow-up (months) Prognostic factors reported
van der Pool
34
Netherlands
Case series
2000–2008
62 (28–84)
272
25
Number of metastases
Wang
38
US
Cohort
1991–2003
–
923
26
Primary tumor grade
Wei
40
Canada
Case series
1992–2002
62.7 (23–88)
395
31
Positive margin Number of metastases Tumor size
Wicherts
42
France
Case series
1992–2007
58.2 (32.8–83.7)
59
24.4
Extrahepatic disease Number of metastases
Yamada
29
Japan
Case series
1988–1995
(42–82)
90
26.8
Positive primary node
Yamamoto
31
Japan
Case series
1992–1994
–
96
37.6
Number of metastases
Abbreviations:
CEA, carcinoembryonic antigen; Meta, metachronous; NR, not reported; SD, standard deviation; Syn, synchronous.
viable contiguous liver segments with a future liver remnant
volume of at least 25%–30% and with a viable vascular
inflow and viable biliary and vascular outflow.
131This new
definition of resectability means that at least 20% of patients
with liver-limited disease can now be considered candidates
for surgery with long-term survival. It is clear from our
analyses that many of the patients who now fulfill the new
criteria for such liver surgery also fall into those high-risk
prognostic factor groups that are associated with poorer
outcomes. As noted above, this observation may partially
explain why no definitive overall improvement in survival
over time was seen in the studies evaluated, and is supported
by observations by others.
2,128There are limitations in this review. Our meta-analyses
were limited by the availability of risk estimates for the
prognostic factors of interest. Multivariate model results
were reported inconsistently in studies: some reported only
significant factors, others reported all factors, and model
covariates usually were not reported. Studies varied by the
number of prognostic factors reported in their multivariate
analyses, thus we were unable to address the risk for patients
with more than one of the prognostic factors in
multivari-ate modeling. Our analysis suggested that publication bias,
examined visually by producing funnel plots measuring the
standard error as a function of effect size, as well as
per-forming Begg’s adjusted-rank correlation test
21and Egger’s
regression asymmetry test
22was likely not a factor in our
analysis. Due to the missing information in several studies
of prognostic factors that were not statistically significant,
reporting bias by the study authors may have influenced the
calculated summary risk estimates. If there was a reporting
bias, however, it would likely result in attenuation of the
mRR. Due to the missing information in several studies
of prognostic factors that were not statistically significant,
reporting bias by the study authors may have influenced the
calculated summary risk estimates. If there was a
report-ing bias, however, it would also likely result in attenuation
of the mRR. In calculating the estimated annual clinic
volume, we assumed that each center had uniform patient
accrual. Referral bias to specialized study centers or
selec-tion bias of patients in certain study populaselec-tions may also
have influenced associations, although we were not able to
account for these potential limitations based on the available
data.
128,129Among the studies we included, there was a wide
range of 5- and 10-year survival reported. This is, in part,
due to the number of articles included (total of 86 studies
for 5-year survival and 20 for 10-year survival). The wide
range also likely reflects differences in study design of the
Dovepress
Kanas et al
Clinical Epidemiology downloaded from https://www.dovepress.com/ by 118.70.13.36 on 20-Aug-2020
Positive resection margin:
cumulative meta-analysis by volume (low to high)
Extrahepatic disease:
cumulative meta-analysis by volume (low to high)
CEA: cumulative meta-analysis by volume (low to high) A
B
C
Hayashi115 3.01 0.96 9.41
Schiesser59 2.30 1.30 4.06
Kaibori118 2.36 1.42 3.94
Chiu102 2.64 1.63 4.28
Korita89 3.58 2.12 6.07
Nikfarjam13 3.47 2.13 5.65
Gallagher111 3.24 2.16 4.88
Pawlik70 2.76 1.78 4.29
Aoki16 2.48 1.70 3.62
Choti14
2.37
2.53 1.77 3.61
DeOliveira106
2.26 1.72 3.26
Blazer99
2.24 1.70 3.00
Kishi123
2.18 1.73 2.90
Hamady114
2.23 1.75 2.752.72
Wei40
2.13 1.80 2.64
Malik78
2.23 1.71 2.69
Rees4
2.12 1.85 2.60
House116
DeMatteo25
2.04 1.641.73 2.55
Kooby88 2.02 1.65 2.48
2.02 1.65 2.48
Kanemitsu119 2.65 1.96 3.58
Reddy65 2.58 1.98 3.35
Kokudo87 2.03 1.31 3.17
Aoki16 2.29 1.57 3.34
Marti17 2.35 1.66 3.34
Elias107 2.02 1.34 3.06
Niu72 1.93 1.34 2.78
de Haas103 1.89 1.38 2.59
Rees4 1.90 1.43 2.53
Wicherts42
2.03
1.96 1.48 2.60
DeMatteo25
1.94 1.55 2.66
House116
1.88 1.51 2.50
Kooby88
2.18
1.50 2.37
1.88 1.50 2.37
Mala77
2.23 1.75 2.752.72
Pawlik70
2.13 1.80 2.64
Reddy65
2.23 1.71 2.69
Choti14
2.12 1.85 2.60
Ahmad96
DeOliveira106
2.04 1.641.73 2.55
Reissfelder55
DeMatteo25 2.022.02 1.651.65 2.482.48
2.02 1.65 2.48
0.1 0.2 0.5 1 2 5 10
Study name Point estimate Cumulative relative risk (95% Cl)
Tumor diameter:
cumulative meta-analysis by volume (low to high) D
Kokudo87 1.75 1.24 2.47
Pawlik70 1.74 1.33 2.26
Fernandez10 1.68 1.30 2.17
Aoki16 1.95 1.41 2.68
Marti17 2.00 1.51 2.64
Iwatsuki27 1.89 1.45 2.46
DeOliveira106 1.91 2.49 2.44
Niu72 1.81 1.48 2.31
Blazer99 1.75 1.39 2.20
Ahmad96
1.58
1.60 1.11 2.29
Wei40
1.61 1.15 2.19
Oussoultzoglou68
1.59 1.18 2.19
De Haas104
1.55 1.20 2.11
Rees4 5–10 cm
1.58 1.20 2.022.00
Rees4 > 10 cm
1.54 1.23 1.94
Malik78
1.48 1.22 1.77
Kooby88
1.51 1.23 1.80
Adam93
1.51 1.261.26 1.80
Node positive:
cumulative meta-analysis by volume (low to high) E
Schiesser59 1.50 0.88 2.55
Mala77 1.74 1.18 2.59
Ueno36 1.81 1.30 2.51
Nanashima82 1.84 1.35 2.51
Sturm44 1.74 1.29 2.35
Nikfarjam13 1.75 1.30 2.36
Yamada29 1.88 1.41 2.51
Gallagher111 1.93 1.47 2.54
Fernandez10 1.86 1.43 2.41
Aoki16
1.63
1.81 1.50 2.19
Minagawa79
1.63 1.44 1.84
Marti17
1.64 1.45 1.84
Laurent90
1.64 1.47 1.84
DeOliveira106
1.65 1.46 1.841.83
Lee92
1.67 1.48 1.86
Hamady114
1.68 1.50 1.87
Ahmad96
1.64 1.51 1.82
Finch110
Rees4
Kooby88
1.62 1.471.48 1.78
1.59 1.46 1.73
1.59 1.46 1.73
0.1 0.2 0.5 1 2 5 10
Study name Point estimate Cumulative relative risk (95% Cl)
Figure 4 (Continued)
Dovepress Hepatectomy survival in metastatic colorectal cancer
Clinical Epidemiology downloaded from https://www.dovepress.com/ by 118.70.13.36 on 20-Aug-2020
Liver metastases:
cumulative meta-analysis by volume (low to high) F
Shah61 1.62 1.26 2.08
Schiesser59 1.27 0.72 2.24
Sasaki58 1.50 0.88 2.57
Ueno36 1.57 1.06 2.31
Kokudo87
Petrowsky63 1.32 0.80 2.20
Sturm44 1.29 0.81 2.05
Nikfarjam13 1.29 0.85 1.96
Pawlik70 1.31 0.87 1.96
Fernandez10 1.36 0.95 1.96
Reddy65 1.341.34 0.95 1.88
Aoki16 1.42 1.00 1.80
Minagawa79 1.40 1.07 1.88
Marti17 1.43 1.11 1.75
1.43 1.15 1.761.78
Capussotti100
1.46 1.16 1.79
Laurent90
1.48 1.20 1.79
Iwatsuki27
1.49 1.23 1.79
DeOliveira106 1.24
1.47 1.74
Elias107
Elias107
1.48 1.24 1.74
Lee92 1.49 1.26 1.74
Blazer99 1.27
Tumor grade:
cumulative meta-analysis by volume (low to high) G
Kanemitsu119 1.79 1.12 2.87
Sturm44 1.83 1.17 2.87
Fernandez10 2.07 1.38 2.12
Aoki16 2.51 1.91 3.29
Niu72 2.25 1.70 2.97
Rees4
Overall 2.102.10 1.611.61 2.742.74
van der Pool34 1.49 1.28 1.73
Kishi123 1.50 1.30 1.74
Yamamoto31 1.51
1.50 1.30 1.72
Ahmad96 1.55 1.31 1.74
Wei40 1.54 1.34 1.79
Finch110 1.54 1.34 1.76
Oussoultzoglou68 1.55 1.35 1.771.75
Farid109 1.55 1.36 1.76
Rees4 1.54 1.37 1.73
Malik78 1.55 1.37 1.74
Wicherts42
Kooby88
Adam93
1.57 1.391.38 1.77
1.56 1.38 1.77
1.54 1.36 1.74
1.56 1.38 1.77
0.1 0.2 0.5 1 2 5 10
Study name Point estimate Cumulative relative risk (95% Cl)
Figure 4 Cumulative meta-analysis of meta relative risks by patient volume and seven prognostic factors identified.
Abbreviations: CEA, carcinoembryonic antigen; CI, confidence interval.
included articles and differences in follow-up period and
patient-selection criteria. Overall, this systematic review has
shown that the 5-year survival rate following CLM
resec-tion in patients with mCRC was approximately 38%. Only
22% of the studies we included reported 10-year survival,
thus our conclusions regarding 10-year survival following
CLM resection are limited. In the future, as follow-up time
is accrued among CLM resection patients, we expect that
10-year survival results will be published to aid in evaluating
long-term survival in patients undergoing CLM resection.
Conclusion
The overall median survival in mCRC patients following
CLM liver resection was 3.6 years. All seven investigated
prognostic factors showed a modest but significant predictive
relationship with survival. In addition, certain prognostic
factors may prove useful in clinical practice when assessing
optimal therapeutic options.
Acknowledgments
The authors thank Libby Morimoto, Jaspreet Gujral, Diem
HaMai, Nyree Bekerian, and Christine Cappa for their help
abstracting data. The authors also thank Gareth Worthington,
who is an Amgen employee, for his aid in reviewing and
editing the manuscript.
Disclosure
This study was funded by Amgen. Part of this paper was
presented at European Society for Medical Oncology 2010
and World Congress on Gastrointestinal Cancer 2011.
References
1. Abdalla EK, Adam R, Bilchik AJ, Jaeck D, Vauthey JN, Mahvi D. Improving resectability of hepatic colorectal metastases: expert consensus
statement. Ann Surg Oncol. 2006;13(10):1271–1280.
2. Donadon M, Ribero D, Morris-Stiff G, Abdalla EK, Vauthey JN. New paradigm in the management of liver-only metastases from colorectal
cancer. Gastrointest Cancer Res. 2007;1(1):20–27.
3. Aloia TA, Vauthey JN, Loyer EM, et al. Solitary colorectal liver
metastasis: resection determines outcome. Arch Surg. 2006;141(5):
460–466; discussion 466–467.
4. Rees M, Tekkis PP, Welsh FK, O’Rourke T, John TG. Evaluation of long-term survival after hepatic resection for metastatic colorectal
cancer: a multifactorial model of 929 patients. Ann Surg. 2008;247(1):
125–135.
5. Folprecht G, Grothey A, Alberts S, Raab HR, Kohne CH. Neoadjuvant treatment of unresectable colorectal liver metastases: correlation between
tumour response and resection rates. Ann Oncol. 2005;16(8):1311–1319.
6. Bismuth H, Adam R, Levi F, et al. Resection of nonresectable liver
metastases from colorectal cancer after neoadjuvant chemotherapy. Ann
Surg. 1996;224(4):509–520; discussion 520–522.
Dovepress
Kanas et al
Clinical Epidemiology downloaded from https://www.dovepress.com/ by 118.70.13.36 on 20-Aug-2020