IN THIS
ISSUE
Effect of Siage of Maturity, Method of Storage, and Sdorage Time on Nufriiive Value of Sandhills Upland Hay
C. L. Streeter, D. F. Burzlaff, D. C. Clanton, and L. R. Rittenhouse Sulphur Dioxide Fumigations of Range Grasses Native fo Southeastern
Arizona...CharZes R. Davis, Donald R. Howell, and George W. Morgan Composition of Two Disclimax Bluejoin Stands in Soufhcenfral Alaska
Wm. W. Mitchell and Jim Evans Effects of Harvester Ants on Production of a Salfbush Community
J. Ross Wight and James T. Nichols Alkali Sacafon: Ifs Merits for Forage and Cover
Wayne C. Hickey, Jr. and H. W. Spriugfield Indirect’ Esiimafion of Standing Crop
James 0. Blankenship and Dixie R. Smith Influence of Grass Vegetation on Wafer Intake of Pullman Silty Clay Loam Richard F. Dee, Thadis W. Box, and Ed Robertson, Jr. Vegetation Responses fo Grazing Management on a Fooihill Sheep Range W. G. Vogel and G. M. Van Dyne Yield, Survival, and Carbohydrate Reserve of Hardinggrass in Relation fo
Herbage Removal
Cyrus M. McKeZZ, R. Derwyn WhaZZey, and Victor Brown
Technical Nofes:
Cumulative Effecfs of Clipping on Yield of Bluebunch Wheafgrass A. M. Wilson, G. A. Harris, and D. H. Gates Brachiaria dura, a Promising New Forage Grass...W. C. Verboom Roof Systems of Four Deseri Grassland Species on Grazed and Proiecfed Sites _______ _ _.__. _.__ _._. _ ___._ ________________ _____- ___.._____.___ _____ __ _______ . . . ..John Blydenstein Nufrieni Content of Forage Ingested in the Morning Compared to
Evening _.__ _ _..._.._._.. _.________.______________ _______ . . .._...Merwyn M. Kothmann Management Notes:
You Can’i Turn ‘Em Loose-Or Can You?
Dale A. Jones and Raymond Paddock
Livesiock Management . .._..._______~___.___~._____Ro~ert G. Boice Book Reviews:
Soil Conservation in Perspective (Waldo R. Frandsen) . .._ . . . ..__..._... _ News and Notes ___. ____.________._______._._____ .___ ___ _- ______ .___ ____.____._ . . . ..__.______..---..~~~~---...~...-. International News ___________________.__...___._..._ _.__... _._______.._.____._ _..._ _ _... _._.__ ._... _ . . . .._.__ With The Sections ___.___________._ __... ___._ ._._ ______ ._._ _________...___ .._... _..._._ _..._. . .._...-.--...-
Society Business _________.__________ . . . . ..~~...__~~.~~.~~~.___..._____..___~_____~~.~~__~~~~~._~~____~...~~~~.~~~~~~~~..~.~.~~~.~~ 55
60 65 68 71 74 77 80
86
90 91 93 95
96 98
106 102 103 105 107
President’s Message _______.._..__..____________ ____ __.____ -.._. _..._ ._.._.._.._... ..MeZvin S. Morris 167 Announcemenf 20th Annual Meeting, Feb. 14-17, 1967, Seaffle, Wash. _____. 108 Informaiion for Auihors ______________ ____ _______~_.___._ ____. ____ _____ ______._____ ___________.______._..__._-._ 110
cover Phot-Sheep
without
herder and without
fences
San Isabel National Forest, ColoradoJournal of
Volume 19, Number 2 March, 1966RANGE
MANAGEMENT
Effect of Stage of Maturity, Method of
Storage, and Storage Time on Nutritive
Value of Sandhills Upland Hay’
C. L. STREETER, D. F. BURZLAFF, D. C. CLANTON, AND L. R. RITTENHOUSE
Graduate Student, Associate Professor of Agronomy, Associate Professor of Animal Science and Graduate Student; University of Nebraska, respectively.
Highlight
Forage yield was influenced more by differences in year and dafe of cuffing than was nutritive value as measured by mefabolizable energy and nitrogen retention. Chemical analysis showed relatively little dif - ference in nutritive value between windrowed, bunched and baled hay, whereas standing forage had lower nutritive value than any of the har- vested forages.
Common haying practices on upland meadows in the Nebraska Sandhills consist of mowing and either round baling, windrowing with a dump rake or bunching the forage with a dropper at- tached to the cutter bar. Regard- less of the method of storage, the hay is left at the site and cattle are turned to the hay during the winter and/or spring. Most studies relative to the effect of storage on the nutritive value of hay have been limited to areas of the United States where the for- age consists of tame species of grasses and legumes, e.g. Archi- bald et al. (1951). It it doubtful if results from such investiga- tions are applicable to native range forage. Moxon et al. (1951) showed a decrease in crude pro-
lcontribution of the Nebraska Agri- cultural Experiment Station. Pub- lished with the approval of the Director as Paper No. 1777 Journal Series, Nebraska Agricultural Ex- periment Station.
tein content from about 8% to less than 3% in standing native grasses from July 13 to Decem- ber 7. The crude protein content of windrowed hay remained con- stant during this storage period. Other workers have shown that early cut native hay contained more protein and had a higher feed value than late cut hay
(Baker et al. 1951, Briggs et al. 1948, Embry, et al. 1956, and Moxon et al. 1951).
The purpose of this investiga- tion was to study the effect that date of cutting, method of stor- age and storage time had upon nutritive value of Sandhills up- land hay.
Procedure
The experimental plots were lo- cated on a sands range site at the Reed Hamilton Ranch 9 miles north of Thedford, Nebraska. The follow- ing methods of storage were imposed upon the early (July 13) and late (August 27) cutting dates: (1) round baling with a rotobaler, (2) wind- rowing with a dump rake, (3) bunching with a basket attached to the cutter bar of a tractor-mounted mower, and (4) standing forage. The four methods of storage were repli- cated three times within each of the two cutting-date plots and were ran- domized within each replication. The forage was sampled immediately after each cutting and monthly thereafter until the end of the stor- age period in late January.
55
Yield data were collected in 1962 and 1963 previous to haying the plots by clipping areas 3.3 by 100 ft with a hand mower which left a 1 to 2 inch stubble. The botanical composition and ground cover (Table 1) were ob- tained with a point-quadrat frame as described by Burzlaff (1962).
Two criteria were used to.measure the nutritive value of the forages: (1) determination of the digestible and metabolizable nutrients of the early and late cut round baled hay and (2) determination of the change in chemical composition as influ- enced by cutting date, method of storage and storage time.
Eight steer calves randomly as- signed to two groups of four were used in the metabolism trials. Dif- ferent calves were used in each year of the study. A la-day preliminary feeding period was followed by a 7-day collection period. One group was fed early-cut, round-baled hay and the other late-cut, round-baled hay. The steers were placed in me- tabolism crates and fed 8 lb of Table 1. Boianical composiiion and ground cover percentages of early cut plots-1963.
Ground Cover Vegetation Cover Litter Cover Bare Ground Botanical Composition
Grass & grass-like1 Calamovilfa Zongifolia Stipa comata
Bouteloua gracilis Andropogon hallii Panicurn scribnerianum Sporobolus cryptandrus Carex heliophila & Cyperus
schweinitzii Major forbs & shrubs
Aster ericoides Rosa arkansana Amorpha canescens Solidago missouriensis Other species
67.2 31.0 1.8
25.6 25.4 21.1 5.1 3.8 3.0
56
chopped hay per day in addition to water and iodized salt which were available ad lib. Dietary, fecal and urine samples were collected during the course of the trial. Daily samples were combined to form one sample for each animal. The amounts of di- gestible and metabolizable energy, digestible nitrogen and nitrogen re- tention were calculated from con- centration of nitrogen and gross energy in the hay, feces and urine.
The chemical analyses were made on the samples of hay from the two cutting dates and four storage meth- ods which had been taken at month- ly intervals during the storage pe- riod. These analyses included de- terminations of lignin (Crampton and Maynard, 1938) and carotene (A.O.A.C., 1960) content of samples collected in 1962 and nitrogen, phos- phorus and calcium content of sam- ples collected in 1962 and 1963
(A.O.A.C., 1960).
The least-squares analysis of vari- ance was used to statistically analyze the data because of the unequal numbers between the early and late cutting dates. Least-squares ad- justed means were calculated for the cutting date-storage time and meth- od of storage-storage time interac- tions. The figures presented here were derived from graphic “best-fit” curves through these two-way inter- action means.
Resulfs and Discussion
Forage Production. -
The sig-
nificantly (P < .Ol) greater yield
(Table 2) in 1962 was probably
due to 9.0 inches more precipita-
tion falling prior to the time of
early cutting in 1962 as compared
to 1963. Apparently, the plants
continued to grow from mid-July
until late-August, producing the
greater yield (P < .Ol) at the
later cutting date.
In 1962, 406 lb/acre more of
dry matter were harvested from
the late than from the early cut-
ting. In 1963 the difference was
only 102 lb in favor of the late
cutting. This significant (P < .lO)
interaction between years and
cutting dates could be a result of
9.1 inches of precipitation that
fell between the early and late
cutting dates in 1962 as com-
pared to 4.8 inches in 1963.
STREETER ET AL.
Metabolism Study.-Digestible
and metabolizable energy and di-
gestible nitrogen and nitrogen
retention values for the round
baled hay cut in 1962 and 1963
are shown in Table 2. The ani-
mals fed the 1962 hay retained
more nitrogen (P < .lO) than
those fed the 1963 hay but there
was no difference in the metabo-
lizable energy content of the hay.
The early cut hay contained
more (P < .lO) metabolizable
energy than the late cut hay, but
there was no difference in nitro-
gen retention. The cutting date
by year interaction was not sig-
nificant for either metabolizable
energy or nitrogen retention.
It would appear that forage
yield was influenced more by
differences in precipitation than
was nutritive value. Some of the
yearly difference in nitrogen re-
tention could have been due to
the use of different animals each
year for the metabolism study.
Chemical Analysis. -
The
chemical composition of hay cut
at the two dates in 1962 and 1963
cannot be directly compared to
the metabolism study, as the for-
mer involved all methods of stor-
age and all storage times while
the latter only involved
the
round baled hay which had been
stored in the field for a short pe-
riod of time.
Year. Higher (P < .Ol) nitro-
gen, phosphorus and calcium lev-
els but lower forage yields were
recorded in 1963 than in 1962.
The inverse relationship between
nutrient concentration and for-
age yield was attributed to the
greater precipitation which fell
in 1962 as compared to 1963.
Cutting Date.
All hay cut in
mid-July had a significantly (P
< .Ol) higher nitrogen and phos-
phorus content than the hay cut
in the latter part of August, with
no difference in the calcium con-
tent (Table 3). These results
would indicate that the plants
translocated some nitrogen and
phophorus but not calcium from
the shoots to other parts of the
plant during the period from
July to August. At no time did
the calcium level fall below the
level recommended by the Na-
tional Research Council (1958)
as necessary for wintering 800 lb
cattle to gain 0.7 lb/day. Similar
results were found by Moxon et
al. (1951) in South Dakota and
Baker et al. (1951) in Nebraska.
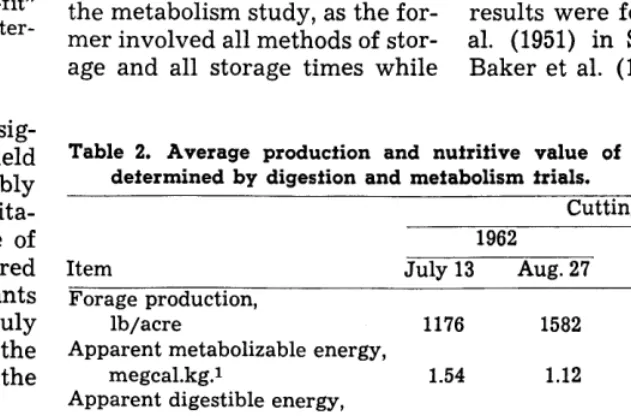
Table 2. Average production and nutritive value of round-baled hay as determined by digestion and metabolism trials.
Cutting date
1962 1963
Item July 13 Aug. 27 July 13 Aug. 27
Forage production,
lb/acre 1176 1582 959 1061
Apparent metabolizable energy,
megcal.kg.1 1.54 1.12 1.32 1.20
Apparent digestible energy,
megcal./kg. 1.81 1.38 1.71 1.72
Lignin,
% of D. M. 16.2 17.8 - -
Apparent nitrogen retention,
g./kg. -0.44 -1.44 -2.04 -1.58
Apparent digestible nitrogen,
g-kg. 3.67 1.61 5.12 6.02
Nitrogen,
% of D. M. 1.08 0.79 1.30 1.32
Dry matter,
% 92.0 92.3 89.6 89.7
SANDHILLS HAY
57
Table 3. Least squares adjusted means for main effects.
Item Nitrogen Phosphorus Calcium Lignin Carotene A--- Per&t - - - i - mg. lb. Years
1962 0.95
1963 1.13
Cutting Dates
Early 1.14
Late 0.94
Methods
Standing forage 0.77 Windrowed hay 1.12 Bunched hay 1.16 Baled hay 1.10
_
0.10 - 0.34 17.3 6.7
0.12 0.68 - -
0.13 0.52 17.0 5.2
0.09 0.50 17.3 8.2
0.09 0.46 17.2 7.4
0.11 0.51 17.1 5.2
0.12 0.53 17.5 4.9
0.12 0.54 16.8 9.2
Little difference in lignin con-
tent was found between the late-
cut and early-cut hay in 1962
when averaged over all methods
of storage (Table 3). The higher
lignin content of the late-cut
round-baled hay was, however,
associated with the lower me-
tabolizable energy content of
that hay (Table 2). This rela-
tionship has been proposed by
other workers. For example,
Armstrong et al. (1964)) using
calorimetry studies, found me-
tabolizable energy to be related
to the percentage of lignin in
artificially dried grass. Patton
and Gieseker (1942) in Montana
and Stanley and Hodgson (1938)
in Arizona found that lignin con-
tent of range forages increased
as the growing season advanced.
The overall average carotene
content of the late cut hay was
higher than that of the early cut
hay (Table 3). The greater per-
centages of carotene in early cut
hay found by Briggs et al. (1948)
in Oklahoma and Whitman et al.
(1951) in North Dakota are not
in disagreement with the results
presented here, as their compari-
sons involved the carotene con-
tent immediately after cutting
and not an average
value
throughout a long period of stor-
age.
Method of Storage. Evaluating
the different methods of storage
was complicated by the presence
of standing forage as a method
of storage. The change in chemi-
cal composition in the standing
forage was considerably differ-
ent from that of the hay during
storage. Many of the significant
interactions and main effects of
methods of storage are a result of
the inclusion of standing forage
in the study. There was little
difference in the chemical com-
position of the various hays. The
advantage of the greater nutri-
tive value of the hay over the
standing forage might be of no
economic saving when the cost
of haying is considered.
There appeared to be no sig-
nificant difference in the nitro-
gen and phosphorus
content
(Table 3) of the three hays,
whereas the standing forage was
considerably lower in botth con-
stituents. Similar results were
found by Moxon et al. (1951) in
a comparison of standing forage
and windrowed hay. Such things
as palatability and availability of
the forage during snow cover
could favor the use of the baled
hay over the windrows
or
bunches.
There was no significant effect
(P > .lO) of method of storage
on the calcium content of the
forages (Table 3). There was a
significant (P < .05) effect of
method of storage on the lignin
content of the forage.
Storage Time. Storage time
had little effect on the nitrogen,
phosphorus and calcium content
of the hay. The percent lignin
increased (P < .Ol) from the
time of cutting until November,
after which time it did not
change appreciably.
Carotene
content decreased (P < .Ol) in a
pattern similar to the increase in
lignin. The influence of storage
time on nutritive value is appar-
ent only for a few months after
harvesting and not of importance
in the winter feeding period.
Cutting
Date andMethod of
Storage.The significant inter-
action between cutting date and
method of storage in the case of
nitrogen and phophorus content
(Fig. 1) appeared to result from
the inclusion of the standing for-
age as there were no important
differences in the responses of
the hays stored by the three
other methods. The standing for-
age should not have been in-
cluded in the cutting date by
method of storage interaction as
the late cutting date was simply
a replicate of the early cutting
date with the July sampling time
missing. There was no signifi-
cant (P > .lO) interaction be-
tween methods of storage and
time of cutting with respect to
lignin or calcium. Only the
round-baled hay had a signifi-
cantly greater (P < .Ol) caro-
1.4 , 7
.WA~ WIYIM‘O .WICY.D ULlD “*‘I YA” “A”
58 STREETER ET AL.
tene content when cut late as compared to early.
Cutting Date by Storage Time.
The cutting date by storage time interaction was difficult to in- terpret because the earlier cut hay was in storage a month long- er at the same chronological date than the late-cut hay. If equal periods of storage were com- pared, however, there would have been a confounding of stor- age time with the climatic condi- tions to which the hay was ex- posed. The former- method of comparison was chosen, there- fore. as the better alternative.
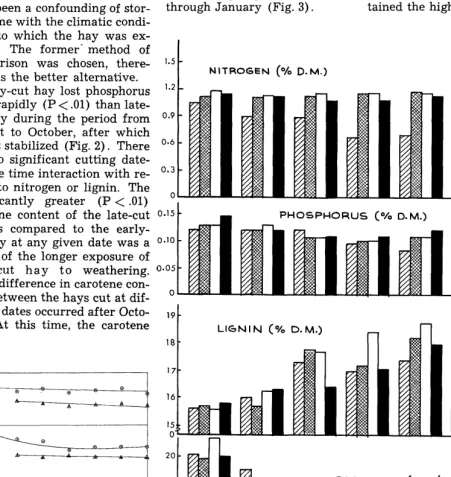
Early-cut hay lost phosphorus more rapidly (P < .Ol) than late- cut hay during the period from August to October, after which time it stabilized (Fig. 2). There was no significant cutting date- storage time interaction with re- spect to nitrogen or lignin. The significantly greater (P < .Ol)
content of both cuttings of hay was near the recommended lev- els of the National Research Council (1958).
Method of Storage and Storage Time. Little change in the nitro- gen and phosphorus levels of the hay occurred during storage, however, the standing forage showed a steady decrease in ni- trogen and phosphorus from July through January (Fig. 3).
1.5
c NITROGEN (O/o D. M.)
There was no method of stor- age-storage time interaction with respect to lignin. No difference in the calcium content during storage time was noted among the various methods of storage. The standing forage main- tained a higher composition of carotene than did any of the hay until about mid-September. After this time, the baled hay re- tained the highest level, and the
1.2
0.9
0.6
carotene content of the late-cut O-l5 hay as compared to the early- cut hay at any given date was a o*lo result of the longer exposure of early-cut hay to weathering. O*O5 Little difference in carotene con- tent between the hays cut at dif- ’
PHOSPHORUS (O/a D. M.)
ferent dates occurred after Otto-
ber. At this time, the carotene LICNIN (O/o D.M.)
CAROTENE (ms./ym- D. M.)
sept act NW DCC J.” STORAGE TIME --
FIG. 2. The effect of the interaction of cutting date and storage time on the
SANDHILLS HAY 59
carotene content of the hay stored in all other methods was almost immeasurable. The caro- tene content of range grasses can be best preserved for the winter feeding period by baling the for- age. The importance of this find- ing is somewhat lessened by the fact that carotene (Vitamin A) deficiencies have been shown to be rare with range livestock and occur only in cases of prolonged drought (Savage and Heller, 1947). Moxon et al. (1951) also found the carotene content of standing forage to decrease more rapidly than when the forage was cut and stored in windrows.
j Summary
The purpose of this investiga- tion was to study the effect of date of cutting, method of stor- age and storage time on the nu- tritive value of native Sandhills upland hay. The forage was cut at two dates, mid-July and late- August, in 1962 and 1963. The methods of storage included windrowed, bunched and round- baled hay and standing forage. A metabolism trial was con- ducted each year to determine the quantity of digestible nitro- gen and energy, metabolizable energy and nitrogen balance of the early- and late-cut, round- baled hay. Forage samples from each method-cutting date sub- class were also obtained monthly from the time of harvest until late January. The samples were analyzed for lignin, nitrogen, calcium, phophorus and carotene in 1962 and for nitrogen, calcium and phosphorus in 1963.
The greater precipitation that fell in 1962 as compared to 1963 caused a greater production of forage per acre in 1962. In both years more forage was harvested in late-August than in mid-July. Forage yield was influenced more by differences in precipita- tion and date of cutting than was nutritive value as measured by metabolizable energy and nitro- gen retention. Chemical analysis showed relatively little differ- ence in nutritive value between the windrowed, bunched and baled hay. Standing forage had considerably lower nutritive value than any of the harvested forages. The influence of storage time on nutritive value was only important for a few months after harvesting and of little sig- nificance in the winter hay feed- ing period.
LITERATURE CITED A.O.A.C. 1960. Official Methods of
Analysis (9th Ed.). Association of Official Agricultural Chemists. Washington D. C.
ARCHIBALD, J. G., J. BART, M. L. BLATSDELL, AND A. F. SPELMAN. 1951. Quality in roughage. I. Fac- tors which influence hay composi- tion and quality. J. Dairy Sci. 34: 656-668.
ARMSTRONG, D. G., K. L. BLAXTER, AND R. WAITE. 1964. The evalua- tion of artificially dried grass as a source of energy for sheep. III. The prediction of nutritive value from chemical and biological measurements. J. Agr. Sci. 62:417- 424.
BAKER, M. L., E. C. CONARD, V. H. ARTHAUD, AND L. C. NEWELL. 1951. Effect of time of cutting on yield and feeding value of prairie hay. Nebr. Agr. Exp. Sta. Bull. 403.19 p.
BRIGGS, H. M., W. D. GALLUP, AND A. E. DARLOW. 1948. Yield and feed- ing value of prairie hay cut at dif- ferent stages of maturity. Okla. Exp. Sta. Bull. B-320. 15 p. BURZLAFF, D. F. 1962. A soil and
vegetation inventory and analysis of three Nebraska Sandhills range sites. Nebr. Agr. Exp. Sta. Res. Bull. 206. 33 p.
CRAMPTON, E. W., AND L. A. MAYNARD. 1938. The relation of cellulose and lignin content to the nutritive value of animal feeds. J. Nutr. 15: 383-395.
EMBRY, L. B., G. F. GASTLER, AND 0. E. OLSON. 1956. Feeding value of early-, medium-, and late-cut prairie hay. S. Dak. Agr. Exp. Sta. Bull. 457. 30 p.
MOXON, A. L., G. F. GASTLER, G. E. STAPLES, AND R. M. JORDAN. 1951. Grass hay at its best; As shown by chemical analysis and feeding value. S. Dak. Agr. Exp. Sta. Bull. 405. 24 p.
N.R.C. 1958. Nutrient Requirements of Farm Animals, No. 4. Nutrient Requirements of Beef Cattle. Na- tional Research Council, Washing- ton, D. C.
PATTON, A. R., AND LEONARD GIESEKER. 1942. Seasonal changes in the lignin land cellulose content of some Montana grasses. J. Anim. Sci. 1: 22-26.
SAVAGE D. A., AND V. G. HELLER. 1947. Nutritional qualities of range for- age plants in relation to grazing with beef cattle on the southern plains experimental range. U.S. Dep. of Agr. Tech. Bull. 943. 61 p. STANLEY, E. B., AND C. W. HODGSON.
1938. Seasonal changes in the chemical composition of some Arizona range grasses. Ariz. Agr. Exp. Sta. Tech. Bull. 73. 451-466. WHITMAN, W. C., D. W. BOLIN, E. W.
Sulphur Dioxide Fumigations of Range Grasses
Native to Southeastern Arizona
CHARLES R. DAVIS, DONALD R. HOWELL, AND GEORGE W. MORGAN
Department of Agricultural Investigation Phelps Dodge Corporation, Douglas Arizona
Highlight
An experiment was conducted with 4 sulphur dioxide fumigations each year for 5 consecutive years on the same plots of 3 species of range grasses native to Southeastern Ari- zona. There were no sfafisfically significani detrimental effects upon the quantify or qualify of either the forage or seed produced by these grasses.
For many years it has been
known that certain gases dis-
charged into the atmosphere by
industrial installations
have
caused injury to crop plants and
vegetation growing nearby. One
of the principal pollutants in in-
dustrial waste is sulphur dioxide.
The relationship between foliar
loss due to SO2 and yield reduc-
tion on various vegetative and
fructifying crops has been well
established. The Selby Smelter
Commission (1915)) reported the
effects of SO2 on barley; Hill et
al. (1933) established the corre-
lation between foliage loss and
the reduction in yield on alfalfa,
while Brisley and Jones (1950)
and Brisley et al. (1959) reported
on effects of SO2 on. yield of
wheat and cotton. It has been
shown that the action of SO2 on
vegetation is purely local in na-
ture, causing no systemic influ-
ence or disease and that there is
no translocation of toxic sub-
stances, the injury being con-
fined to the areas which are
visibly affected (Thomas et al.,
1949). All investigators have re-
ported that the resultant yield of
crop plants is not reduced unless
visible manifestations of SO2 in-
jury are present.
No studies have been reported
on the effects, if any, of SO2
fumigations on range grasses. A
limited number of exploratory
experiments were conducted in
1936 to 1941 by Phelps Dodge
Corporation but the tests were
too few in number and the work
was not conducted in sufficient
detail to warrant publication.
Since farm crops were of greater
economic importance in the area,
intensive research with native
vegetation was postponed until
1958. At this time, an experiment
was designed whereby the quan-
tity of forage produced, the qual-
ity (food value) of the forage,
the quantity of seed available for
reseeding the range, and seed
viability could all be measured.
The difference, if any, between
yields taken from plants which
had been fumigated with SO2
and plants growing normally,
could then be determined.
Three grass species were se-
lected, either because of their
predominance
on the local
ranges, or because of their desir-
ability as forage for cattle. They
were tobosa (Hilaria mutica),
blue grama (Bouteloua
gracilis),and sideoats grama
(Bouteloua curtipendula).During the past 40 years, field
observations by numerous air
pollution and range specialists on
perennial range grasses native to
Southeastern Arizona have re-
vealed that these grasses are ex-
tremely resistant to SO2 and do
not show leaf markings in their
native habitat.
The authors would like to ex-
press their thanks to Prof. K. A.
Valentine and Dr. J. J. Norris,
New Mexico State University,
for their helpful advice and sug-
gestions on planning experiments
and Dr. R. 0. Kuehl, University
of Arizona, for his statistical ad-
vice.
60
Experimenial Procedure The experiments were conducted at the Hereford Experimental Area of the Phelps Dodge Corporation near Hereford, Arizona. This area is situated 35 miles from any industrial plant, and in 27 years of observation no manifestations of sulphur dioxide injury have been noted on the most sensitive vegetation growing there, thus assuring an atmosphere suffi- ciently free of SO2 pollution for the conducting of such experiments. In order to establish an acceptable long- range average, the data were col- lected over a 6-year period (1958-63). A block of 30 pairs of plots was established for each of the 3 species in which one plot of the pair was fumigated and the other plot was left as a control. The fumigated and con- trol plots were alternated with re- spect to position from pair to pair (Fig. 1). Fumigated plots were the same for each year, thus providing a split plot with respect to time. Each plot contained 16 clumps of grass spaced 12 inches apart. The clumps were transplanted from their native habitat in the surrounding area and were set in depressed basins so that each could be irrigated with an equal amount of water.
The first season was devoted to establishing a perfect stand and roguing seedlings of weeds and other grasses. Early in the second season, when the plants had become well established, metal frames constructed of 3/8-inch iron rod were permanent- ly set in each plot. These frames encompassed 4 fts in the center of the plot and all yields of seed and forage were taken from the grass which grew inside the frames, thus eliminating any border effect. The frames were set 4 inches above the ground in the tobosa and sideoats, and 3 inches in the blue grama. The frames were placed at a height so that all plants of each species could be clipped at the same distance above the ground which would cause no permanent injury to the grass.
FUMIGATIONS OF RANGE GRASSES 61
FIG. 1. View of grass plantings showing arrangement of plots.
managed in exactly the same way respecting all cultural practices, the only difference being the SOa appli- cations to the fumigated plots.
The plots were dusted weekly with BHC, DDT, and sulphur to keep in- sect depredations to a minimum. The principal insect problems de- veloped from an undescribed species of the genus Harmolita which pre- vented the blue grama from produc- ing inflorescences by boring in the stems, and an undescribed species of midge which attacked the spikelets of sideoats grama.
Since the perennial native range grasses do not show sulphur dioxide manifestations on the leaves when exposed to concentrations of the gas normally found under field condi- tions, cocklebur (Xanthium sacchar- utum) plants were established in each plot every year. Cocklebur was selected as an indicator plant be- cause it is very sensitive to SO2 and the leaf markings are easily recog- nized.
Early in June each year the plants in all plots were clipped to the height of the frames and then given a heavy irrigation to promote growth. All plots were watered with a g-inch irrigation whenever the cocklebur plants began to show moisture stress.
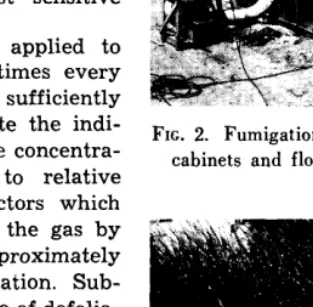
Fumigation was accomplished by introducing SO2 gas through cali- brated flow meters into plastic-cov- ered cabinets enclosing the plants (Fig. 2). The cabinets were 6 ft square and 4.5 ft high. The air
stream containing the SO2 was in- troduced through a baffle in the center of the top and exhausted into 15-foot wide aisles at the bottom. The baffles in the top were ad- justable in order to insure even dis- tribution of the gas laden air. Soil was banked around the bottom of the cabinets except on one side ad- jacent to the 15-foot aisle where the SO2 and air was exhausted. The ad- jacent plots were sufficiently remote so that no evidences of injury could be found on the most sensitive plants.
Sulphur dioxide was applied to each fumigated plot 4 times every year at a concentration sufficiently high to severely defoliate the indi- cator plants (Fig. 3). The concentra- tion varied according to relative humidity, and other factors which affect the absorption of the gas by plants. Exposure was approximately one hour for each fumigation. Sub- stantially the same degree of defolia- tion was produced on the indicator cocklebur plants in every plot. This system of fumigation yielded 30 rep- lications of 4 applications to each species of grass every season. The first application of sulphur dioxide was made while the plants were in the vegetative stage before any in- florescences appeared. Two treat- ments were made during the major bloom period and the fourth was made after the main bloom period and before maturity.
As nearly as possible to October 20th each year, all foliage growing within the frames on each plot was clipped to the prescribed height. The forage was air-dried, weighed, and representative samples were ana- lyzed for moisture, ash, protein, fat, fiber, nitrogen-free extract, and car- bohydrates. No seed heads were in- cluded in the forage analyses as the inflorescences had been removed in order to secure the necessary data for seed weights and germination tests. The weight of forage was de- rived by a summation of the weight of the clippings, the rachises, and the corrected weight of the spikes.
All mature seed heads on the to- bosa grass growing within the 2 x 2 ft quadrat, or frame, in the center of each plot were harvested and counted three or more times each year with the final harvest being shortly before October 1. All in- florescences, including both mature and immature, were harvested and counted at this time. In order to compensate for the spikes which had fallen before the heads were har-
cabinets and flow-meter.
FIG. 3. Sideoats grama plot showing ex-
62 DAVIS ET AL.
vested, all of the spikes were man- ually stripped from each rachis in each sample. The “spike scars” on 50 randomly chosen rachises were counted. The number of rachises times the average number of spikes per rachis gave the number of spikes produced on each plot. One thousand randomly selected spikes were weighed from each sample and the resultant weight per spike times the number of spikes produced gave the corrected weight of spikes before any had fallen. Three g of spikes from each sample were threshed, hand- cleaned and weighed. The corrected weight of free seed produced was then calculated.
germinator was regulated at 90 F and had a range of & 3”. The seeds were placed in the germinator for 24 hours. At this time all seeds which had germinated were counted and removed. The same procedure was followed for a second and third 24- hour period. At the end of 72 hours the ungerminated seed were dis- carded since they were beginning to deteriorate.
Seed from the sideoats was col- lected and weighed in the same manner as the tobosa except that only one harvest of inflorescences was made each year about October 1. Compensation for fallen spikes was made in the same manner.
Results
Forage - Individual year and five year combined analyses of variance were performed on for- age yield data from each species. There were no significant differ- ences observed between the five- year average yield of control and fumigated plots (Table 1).
There were two significant dif-
Blue grama did not mature as rapidly as tobosa and sideoats. The inflorescences of this species were not harvested until near the middle of October when all heads produced were harvested and counted. All of the spikes from each plot were counted. The spikes produced on 30 randomly selected stems were mea- sured to the nearest .Ol inch. The number of spikelets produced per “spike-inch” was calculated by counting, under magnification, the spikelets produced on all the spikes on 5 random stems. The number of spikelets per “spike-inch” times the “spike-inches” produced in the sam- ple gave the number of spikelets produced. The corrected weight of spikelets and seed was then calcu- lated in the same manner as for the tobosa and sideoats.
Table 1. Mean forage yields in grams per plof for fhree grasses.
Species 1958 ~~_.
5-year 1959 1960 1961 1962 1963 Ave. Tobosa Cont. 756.29* 616.13 567.05 608.50 482.60 - 606.10
Fum. 653.00 586.71 536.43 598.67 474.19 - 569.80 (7.28)1 Sideoats Cont. - 471.28 570.40 612.33 534.85* 589.81 555.73 grama Fum. - 423.81 542.29 644.65 585.68 589.08 557.03 (7.06) Blue Cont. - 349.93 473.56 606.37 462.66 520.47 482.60 grama Fum. - 383.88 460.35 610.74 475.40 489.03 483.88 (4.05) ____-
*Indicates significance at 5% level.
iFigures in parentheses are standard errors of treatment means.
Table 2. Chemical composition of fobosa forage (mean percent).
Seed germination tests on all 3 species of grass were conducted in the same manner. The tests were begun the last week in January and completed the first week in June each year. The 3 species were tested in the same order each year so that the rest period would be the same for each species. There were 4 replica- tions of 100 seeds each from every plot annually. The seeds were hand set on the germination pads and only those which were not mechani- cally injured in threshing were used. Otherwise no selection was involved in sampling the seed for germination tests. The thermostatically controlled
5-year Constituent 1958 1959 1960 1961 1962 Ave. Moisture Cont. 5.35 5.47 5.82 5.88** 5.80** 5.66*
Fum 5.35 5.33 5.85 6.13 6.27 5.79 (0.055)1 Ash Cont. 12.52 10.78 1.1.05 11.95 10.80 11.42
Fum. 12.80 11.70 10.73 12.00 9.95 11.44 (0.068) Protein Cont. 5.27* 5.25*” 4.78 4.17 4.82 4.86
Fum. 6.18 6.28 4.88 4.23 5.05 5.33 (0.118) Fat Cont. 1.08 1.70* 1.72 1.53 1.47 1.50
Fum. 1.03 1.93 1.57 1.42 1.32 1.45 (0.099) Fiber Cont. 40.03 35.73 37.43 38.93 36.55 36.88
Fum. 38.73 35.22 36.82 38.65 37.18 36.75 (0.333) Nitrogen
free Cant 40.03 41.07 39.20* 37.53 40.57 39.68 extract Fum. 38.73 39.53 40.15 37.57 40.23 39.24 (0.266) Carbo- Cont. 75.78 76.80 76.63 76.49 77.12 76.56 hydrates Fum. --_~-. 74.60 74.75 76.97 76.22 77.42 75.99 (0.277)
*Indicates significance at 5% level. **Indicates significance at 1% level.
iFigures in parentheses are standard errors of treatment means.
FUMIGATIONS OF RANGE GRASSES 63
was an original difference in
stand. A few measurements were taken, but these were insufficient to enable proof of a difference. No explanation can be offered for the difference in forage yield for sideoats in 1962.
Analyses of variance were per- formed on the results of the chemical analyses. For the ob- served means in every instance except one, the significant dif- ferences were in favor of the fumigated plots. However, the significant differences were so inconsistent it was concluded that the observed differences were due primarily to environ- mental factors and sampling.
The moisture content of tobosa forage for the 5-year summary showed a significant difference at the 5% level in favor of the fumigated plots, 5.79 vs. 5.66% (Table 2) . The individual year means and analyses reveal that this difference occurred in the fourth and fifth years. We have no explanation for this occur- rence. The other significant dif- ferences all favored the fumi- gated plots, protein by 0.9% in 1958 and 1.0% in 1959; fat by 0.2% in 1959; and nitrogen-free extract by 1.0% in 1960. The dif- ferences may be related to the application of ammonium nitrate at the beginning of the 1960 sea- son, but an attempt to determine such relationships lies outside the realm of this paper.
The only significant differ- ences in the results of the chemi- cal value analyses of sideoats forage were in the moisture con- tent for the years 1959 and 1961, and in the nitrogen-free extract for 1963 (Table 3). These differ- ences all favored the treated plots by less than 1.7% and are possibly due to environment or sampling since there was no con- sistent pattern.
Chemical analyses for blue grama forage revealed a differ- ence significant at the 5% level for moisture and carbohydrates in 1959 (Table 4). The difference
Table 3. Chemical composition of sideoafs grama forage (mean perCeti)*
5-year Constituent 1959 1960 1961 1962 1963 Ave. Moisture Cont. 5.00” 5.48 5.28** 5.58 4.88 5.25
Fum . 5.22 5.53 6.07 5.73 4.83 5.48 (0.126)1 Ash Cont. 9.20 7.32 8.62 8.00 8.38 8.30
Fum. 9.88 7.12 8.37 8.50 7.80 8.33 (0.161) Protein Cont. 5.32 4.33 4.02 3.85 3.95 4.29
Fum. 5.78 4.32 4.28 4.17 3.90 4.49 (0.089) Fat Cont. 1.40 1.38 1.48 1.23 1.05 1.31
Fum. 1.53 1.37 1.63 1.07 1.07 1.33 (0.095) Fiber Cont. 39.42 40.10 41.17 40.03 41.62 40.47
Fum. 39.67 39.67 41.65 38.95 40.60 40.11 (0.344) N2fzzen Cont. 39.67 41.38 39.43 41.30 40.12* 40.38 extract Fum. 37.92 42.00 38.00 41.58 41.80 40.26 (0.261) Carbo- Cont. 79.08 81.48 80.60 81.33 81.73 80.85 hydrates Fum. 77.58 81.67 79.65 80.53 82.40 80.37 (0.230)
*Indicates s g i nificance at 5% level. **Indicates significance at 1% level.
IFigures in parentheses are standard errors of treatment means.
Table 4. Chemical composition of blue grama forage (mean percent).
5-year Constituent 1959 1960 1961 1962 1963 Ave. Moisture Cont. 5.42* 5.30 5.38 5.58 5.10 5.36
Fum 5.62 5.42 5.40 5.60 5.15 5.44 (0.032)1 Ash Cont. 8.23 7.10 8.68 8.10 8.40 8.10
Fum. 9.30 7.07 9.50 8.57 8.37 8.56 (0.158) Protein Cont. 4.68 4.20 4.02 4.95 4.75 4.52
Fum. 5.10 4.52 4.50 4.48 5.17 4.75 (0.292) Fat Cont. 1.42 1.53 1.28 1.28 1.25 1.35
Fum. 1.43 1.17 1.42 1.43 1.33 1.36 (0.084) Fiber Cont. 36.02 42.82 40.13 37.92 38.27 38.99
Fum 35.02 40.92 39.03 37.85 37.45 38.05 (0.652) NlflfeOegen Cont. 44.23 39.25 40.50 42.17 42.23 41.68 extract Fum. 43.53 40.92 40.15 42.07 42.53 41.84 (0.959) Carbo- Cont. 80.25* 81.87 80.63 80.08 80.50 80.67 hydrates Fum. 78.55 81.83 79.18 79.92 79.98 79.89 (0.241)
*Indicates s g i nificance at 5% level.
iFigures in parentheses are standard errors of treatment means.
Table 5. Mean seed yields, in grams per plot, for the three species of grass.
5-year Species 1958 1959 1960 1961 1962 1963 Ave. Tobosa Cont. 8.408 11.110 8.131 7.614 7.351 - 8.523
Fum. 8.265 12.014 8.038 7.867 7.712 - 8.779 (0.19)1 Sideoats Cont. - 19.449 39.208 26.558 19.761 27.529 26.501 grama Fum. - 18.878 34.519 29.153 19.301 27.234 25.937 (0.69) Blue Cont. - 22.952 26.695 14.094 8.750 10.745 16.647 grama Fum. - 28.876 21.835 12.726 7.650 7.727 15.763 (0.80)
64
favored the treated plots for
moisture by 0.2% and the con-
trol plots for carbohydrates by
1.7%. It is likely these differ-
ences are brought about by sam-
pling or environment since there
was no consistency or trend ap-
parent.
Seed-An analysis of variance
on the yield of free seed pro-
duced per plot revealed signifi-
cant year differences. This dif-
ference is to be expected in al-
most any biological experimen-
tation since seasonal fluctuations
have a strong bearing on the
productivity of plants. However,
the data on seed yield showed no
significant differences due to the
fumigation (Table 5). Average
seed yield for the experiment
was 8.65 g/plot for tobosa, 26.22
g for sideoats, and 16.21 g for
blue grama.
The germination percentages
were subjected to the arcsine
transformation and an analysis
of variance was performed on
the results of the transformed
data. There was a significant dif-
ference of 1.79% in favor of fu-
migated tobosa plots in 1961 and
a significant difference of 1.26%
in favor of sideoats control plots
in 1963 (Table 6)) both at the
5% level. However, statistically
significant differences between
control and fumigated plot seed
germination were not consistent
and there was no trend of a gain
or loss due to the fumigation
treatments.
Summary and Conclusions An
experiment was designed
to test the effect of sulphur
dioxide fumigations on 3 species
of range grasses native to South-
DAVIS ET AL.
Table 6. Mean germination percentage for fhe three species of grass. 5-year Species 1958 1959 1960 1961 1962 1963 Ave.
Cont. 73.88 88.10 69.66 84.67* 85.78 - 80.42 Tobosa Fum. 73.84 88.26 71.39 86.46 86.77 - 81.35 (0.63)1 Sideoats Cont. - 96.65 88.09 95.28 95.86 95.75* 94.09 grama Fum. - 96.78 86.91 95.18 95.78 94.49 94.07 (0.53) Blue Cont. - 88.71 93.49 90.34 93.15 85.40 90.13 grama Fum. - 91.95 92.73 90.43 93.74 84.30 90.63 (0.71) *Indicates significance at 5% level.
IFigures in parentheses are standard errors of treatment means.
eastern Arizona: tobosa, sideoats
grama, and blue grama. There
were 30 replications every sea-
son for 5 years with 4 SO2 fumi-
gations on the same plots each
year, a total of
20fumigations
on each plot for the entire ex-
periment. While no visible mark-
ings were produced on the grass
blades, each fumigation was of
sufficient concentration to se-
verely defoliate
cockleburs
grown as indicator plants as
proof that the concentration was
great enough to cause leaf injury
comparable to that found in the
area near the’ Phelps Dodge
Copper Smelter at Douglas, Ari-
zona.
Differences in yield between
matching pairs of plots of the
three species were tested for 10
characteristics, namely; weight
of forage produced;
percent
moisture, ash, protein, fat, fiber,
nitrogen-free extract, and carbo-
hydrates found in the forage;
weight of free seed produced;
and germination ability of the
seed. Analyses of variance of
data on each of the ten char-
acteristics were conducted for
each of the five years and for the
combined five-year averages.
The statistically
significant
differences in yields for the 10
characteristics over the entire
experiment are distributed so
erratically that no trend can be
found. Therefore, it is concluded
that 4 SOS fumigations each year
for 5 consecutive years on the
same plots of 3 species of the
range grass had no detrimental
effect upon the quantity or qual-
ity of either the forage or seed
they produced.
LITERATURE CITED BRISLEY, H. R., C. R. DAVIS,AND J. A.
BOOTH. 1959. Sulphur dioxide fu- migation of cotton with special reference to its effect on yield. Agron. J. 51: 77-80.
BRISLEY, HAROLD R., AND WYATT W. JONES. 1950. Sulphur dioxide fu- migation of wheat with special reference to its effect on yield. Plant Physiol. 25: 666-681.
HAL, GEORGE R., JR., AND MOYER D. THOMAS. 1933. Influence of leaf destruction by sulphur dioxide and by clipping on yield of alfalfa. Plant Physiol. 8: 223-245.
SELBY SMELTER COMMISSION. 1915. Selby Smelter Commission Report. U. S. Bur. Mines, Bull. 98.
Composition of Two Disclimax Bluejoint Stands
in Southcentral Alaska’
WM.
W.
MITCHELL AND JIM EVANSUniversity of Alaska Agricultural Experiment Station,
Palmer; and Bureau of Land Management, U.S. Dewmt- ment of the Interior, District Office, Anchorage, Alaska.
Highlight
The composition of fwo disclimax bluejoint stands was determined prior fo their being committed to grazing use in southcentral Alaska. The stands were essentially mono- typic in their grass constituency with for& and woody species comprising over 50% of fhe shoot density and well over 60% of the yield. Bluejoint was fhe only plant of grazing value found in quantify in fhe two com- munifies.
Lush
stands of bluejoint (Ca-
Zamagrostis camdensix) prevail
on mesic grassland sites and open
areas of burned-over forest lands
in southern
and southcentral
Alaska. On favorable sites blue-
joint panicles often attain a
height of 6 ft or more. These
stands are particularly well de-
veloped and extensive in the
coastal regions of southcentral
Alaska. They become less ex-
tensive farther inland and north-
ward.
Wunderlich (Rieger and Wun-
derlich, 1960) described some of
these grasslands on Kodiak Is-
land and estimated bluejoint vol-
ume from about 12 to 30% in
the tall-grass stands. Hanson
(1951) obtained relative density
estimates of bluejoint ranging
from about 35 to 75% in blue-
joint communities throughout
southcentral and central Alaska.
Few estimates
of absolute
weights of community fractions
are available for Alaska grass-
lands. Klebesadel (Klebesadel
and Laughlin, 1964) estimated
dry matter yields in three blue-
joint stands, which had devel-
oped as a result of mechanical
Study supported in part by The
Rockefeller Foundation Grant RF-
64056.
clearing of forests in the Ma-
tanuska Valley, at about 2,800-
4,150 lb/acre. In a study of man-
aged bluejoint plots employing
different fertilizer and clipping
schedules, Klebesadel (1965) ob-
tained yields of about 1.0-2.5
tons. Reports by farmers of hay
production on native grasslands
averaged 1,700 lb/acre in 1960
(Pownall and Tye, 1960).
The general area of the cur-
rent study was toward the upper
limits of the mixed evergreen-
hardwood forest zone in the
Chugach Mountains-dominated
by
Betulapapyrifera (western
paper birch) and
Picea glauca(white spruce). It gives way to
a zone dominated
by
Alnuscrispa (green alder). The area
was severely burned early in the
century and now consists of scat-
tered stands of trees, alder, and
herbaceous communities. An as-
sortment of herbaceous commu-
nities have developed in the open
parks of these burned-over for-
est lands. Succession within the
herbaceous communities on suf-
ficiently deep soils appears to
culminate, prior to ascendancy
to a woody community, in a tall-
grass bluejoint community (Fig.
1). These observations agree in
general with those of Lutz (1956).
Two bluejoint stands of, this
disclimax type were analyzed far
population density and one for
FICU~E 1. A bluejoint community bordered by birch and alder in the Chugach Moun-
tains of southcentral Alaska. Bluejoint and fireweed dominate the tall, herhaceous
growth. Oak fern and wood horsetail are mat abundant in the understory.
66
MITCHELL AND EVANS
yield. The stands were scheduled
to be grazed by cattle but prior
.to analysis had been undisturbed
by man or his livestock. Original
compositional and yield informa-
tion have not been obtained on
grasslands currently in grazing
use in the region. These findings
are intended to serve as a ref-
erence for future quantitative
studies to assess the effects of
grazing on this type of grassland.
Procedures
The field research was conducted from August 13-18, 1964, after the bluejoint was fully headed. The study area was in the Wolverine drainage north of the Wolverine Creek about 6.5 miles east of Palmer. The point-centered quarter method was employed to obtain estimates of shoot density and frequency (Cottam and Curtis, 1956; Dix, 1961). A slender rod with 4 short cross pieces attached at right angles near the base was placed 50 times at 5-pace intervals along a 250-pace transect. The distance from the center of the rod to the nearest shoot in each quarter was measured in centi- meters and tallied by species. A species was considered amply sam- pled if encountered about 30 times (Cottam and Curtis, 1956; Dix, 1961). Weight estimates were obtained by use of the clip-plot method. Nine 3.1-ft2 quadrats were placed at regu- lar intervals along the transect sam- pled for density and the plants, clipped at ground level, sacked ac- cording to species. The oven-dry weights were determined in grams and the yield in lb/acre calculated therefrom.
An estimate of bluejoint height was obtained by taking 40 measure- ments of non-heading culms at regu- lar intervals along the transect. Mea- surements were taken from the ground level with the leaves ex- tended #along the tape. Dwarfed and very young plants in the under- story were not included.
Taylor (19631, Anderson (1959), and Taylor and Little (1950) were employed for nomenclature.
Resulfs
The two stands analyzed in the
study differed in altitude and
topography. Stand A occurred on
level ground at about 1,150 ft
altitude and Stand B on a gen-
erally southwest facing, 19%
slope at about 1,400 ft. The soil
mantle consisted of a silt loam,
generally 18-20 inches deep over
rock and gravel. Stand A was
analyzed for yield as well as for
density.
Density and yield figures are
presented in Table 1. Bluejoint
far exceeded any of the other
species in shoot density but was
surpassed in yield by the tall
growing fireweed. Oak fern, a
fragile sciophyte of the under-
story, was second to bluejoint in
density but very low in yield.
Fireweed and wood horsetail, an-
other understory plant, were
third and fourth in density, and
the latter was fourth in yield.
The above-ground-biennial shrub
American red raspberry was
very low in density but third in
yield. All other species were low
in both yield and density. The
four species contributing the
bulk of the cover in the com-
munity are all rhizomatous.
Production of a little over 2
tons/acre of dry matter was in-
dicated for the stand with fire-
weed and bluejoint contributing
about 1,600 lb and 1,400 lb re-
spectively, i.e., almost 75% of
the total yield. Red raspberry
and horsetail comprised about
20% of the production. Thus 4
species accounted for over 95%
of the total- production of herbs
and small shrubs. The infrequent
overstory plants of paper birch,
alder, and red elder (Sambucus
racemosa) are not included in
the production.
The two stands were very
similar in composition, as indi-
cated by the closeness of the
relative frequencies of the four
major species tallied in the
analyses. The stands differed
mainly in their representation of
minor species. The difference re-
corded in the two stands for star-
flower (Table 1) was not a true
difference, since starflower was
so badly deteriorated in Stand A
that it was not tallied in the
analysis though it was encoun-
tered. Species noted to be pres-
ent but not encountered in either
analysis were cow parsnip (Her-
acleum
lanaturn),prickly rose
(Rosa ucicuZuris), red elder, and
green alder.
Height measurements of 40
non-flowering
culms of blue-
joint averaged 108.9 cm (SE =
2.0) in Stand A and 105.9 cm
(SE = 2.3) in Stand B. A vol-
ume index was derived by multi-
plying density in shoots/m2 x
height and dividing by 100. The
two indices, which follow, differ
only about 1.8%.
Stand A: 129.3 x 108.9 t 100 =
140.8.
Stand B: 135.4 x 105.9 +- 100 =
143.4.
Discussion
The two disclimax tall-grass
bluejoint stands analyzed in this
study are essentially monotypic
in their grass constituency. The
bluegrasses encountered in Stand
B only occurred in local dis-
turbances (e.g., in moose bedding
ground and around old fallen
trees) and in microhabitats with
thin soils. They were excluded
from the undisturbed, well de-
veloped portions of both stands.
Bluejoint and the tall growing
fireweed dominate the aspect of
the community. Spiny woodfern
is a vigorous clump former and
dominates locally in its scattered
occurrences, as do the infrequent
red raspberry and other woody
species. Except for the relatively
few plants of tall lungwort and
cow parsnip all other plants in
the community are small plants
of the understory-negligible
in
yield and forage value. The
paucity of species in the com-
munity is due, in part at least,
to the accumulation of dry and
decomposing mulch, generally
from 4 to 8 inches thick, and to
the shading effects of the tall
herbaceous growth.
BLUEJOINT STANDS 67
Table 1. Composiiion and yield data on two disclimax bluejoinf stands in southcentral Alaska. Density and fre- quency obtained by point-centered quarter method, yield by clip-plots.
Stand A Stand B
_____-
Rel. Rel. No./sq. Yield Rel. Rel. No./sq.
Species freq. dens. meter Rel. wt. lb/acre freq. dens. meter
Grasses
Bluejoint (Calumagrostis canadensis)
Bluegrasses (Poa spp.) Forbs, shrubs, and trees
Oak fern (G ymnocarpium dryopteris)
Fireweed (Epilobium angustifolium)
Wood horsetail (Equisetum s y lvaticum)
Spiny woodfern (Dryopteris austriaca)
American red raspberry (Rubus strigosus) Other species
Starflower (Trientalis europaea)
Dogwood (Cornus suecica) Chickweed (Stellaria
calycantha)
Tall lungwort (Mertensia paniculata)
Western paper birch (Betula papyrifera)
Highbush cranberry (Viburnum edule) Alaska bramble (Rubus alaskensis)
35.1 44.5 129.3 35.3 1,466 33.1 42.0 135.4
4.2 4.5 14.5
21.9 21.5 62.4
11.5 33.4
11.5 33.4
2.0 5.8
1.0 2.9
- -
2.4 102 21.2
38.9 1,615 13.6
7.8 324 11.9
2.5 106 1.7
12.5 519 0.8
0.5 21
8.5 2.5
22.0 70.9
15.8 11.0 35.4
12.3 8.5 27.4
2.6 1.5 4.8
1.8 -
0.5 1.6
6.1
2.6
3.5 10.2
1.5 4.4
6.5 20.9
1.5 4.8
0.8 1.6
0.8
0.9 2.0 5.8
0.9 1.0 2.9
0.8
0.5
1.5
0.5
3.2
1.6
Totals 290.5 4,153* 322.1
*SE sample plots = 3.2 (.008 X)
by Penfound (1963) employing the same method in a density analysis of a tall-grass commu- nity in Oklahoma. Grasses con- stituted about 70% of the rela- tive density in the southern tall- grass community as compared to about 46% in the subarctic blue- joint community. The differences in relative yields were even greater with grasses comprising about 87% of the yield in the Oklahoma community and about 35% of the yield in the Alaskan community.
The grazing potential of the bluejoint-fireweed disclimax community is limited since blue-
joint is the only species present in any abundance that is normal- ly sought by cattle. Fireweed may serve as forage when fed in silage or in a chopped form, but it is generally avoided by cattle in the field. The intolerance of bluejoint to intensive cropping (Piper, 1905; Rieger and Wunder- lich, 1960; Klebesadel and Laugh- lin, 1964; Klebesadel, 1965) fur- ther limits the grazing value of the community. Visual estimates of native pastures that have been grazed indicate large reductions in the yield of bluejoint and im- portant increases and incursions of other species.
Summaty