JOURNAL OF GEORHYSICAL RESEARCH, VOL. 106, NO. D14, PAGES 15,201-15,214, JULY 27, 2001
Multiangle observations
of Arctic clouds from FIRE ACE'
June 3, 1998, case study
Roger
T. Marchand,
• Thomas
P. Ackerman,
• Michael
D. King,
2 Catherine
Moroney,
3
Roger
Davies,
3 Jan-Peter
A. L. Muller,
4 and
Hermann
Gerber
5
Abstract. In May and June 1998 the Airborne Multiangle Imaging Spectroradiometer (AirMISR) participated in the FIRE Arctic Cloud Experiment (ACE). AirMISR is an airborne instrument for obtaining multiangle imagery similar to that of the satellite-borne
MISR instrument.
This paper presents
a detailed analysis
of the data collected
on June 3,
1998. In particular, AirMISR radiance measurements are compared with measurements made by two other instruments, the Cloud Absorption Radiometer (CAR) and the MODIS airborne simulator (MAS), as well as to plane-parallel radiative transfer simulations. It is
found that the AirMISR radiance
measurements
and albedo
estimates
compare
favorably
both
with the other instruments and with the radiative transfer simulations. In addition to radianceand albedo,
the multiangle
AirMISR data can be used to obtain estimates
of cloud top height
using stereoimaging
techniques.
Comparison
of AirMISR retrieved
cloud top height (using
the complete MISR-based stereoimaging approach) shows excellent agreement with the measurements from the airborne Cloud Lidar System (CLS) and ground-based millimeter-wave cloud radar.
1. Introduction
In May and June 1998 the Airborne Multiangle Imaging Spectroradiometer (AirMISR) participated in the FIRE Arctic Cloud Experiment (ACE). AirMISR is an airborne instru- ment for obtaining multiangle imagery similar to that of the
satellite-borne MISR instrument [Diner et al., 1998]. MISR
is one of five instruments onboard the NASA Terra platform (previously known as EOS-AM1). During the FIRE ACE experiment, 13 flights (each with four to eight AirMISR data acquisitions or runs) were attempted over Point Barrow,
Alaska, or the Surface Heat Balance of the Arctic Ocean
(SHEBA) ice station. In the SHEBA experiment the
Canadian Coast Guard icebreaker Des Groseilliers was frozen
in the pack ice of the Arctic Ocean. The Des Groseilliers spent 1 year drifting with the pack ice [Curry et al., 1999].
AirMISR flies on the NASA ER-2 aircraft and has a single push broom (line imaging) camera of the same design as the nine cameras on the MISR satellite-based instrument. High- resolution images are obtained by this camera in four narrow spectral bands centered at 446, 558, 672, and 866 nm [Bruegge et al., 1998]. The AirMISR camera can be adjusted in flight to point from +70.5 ø to -70.5 ø relative to nadir along the direction of flight. By rotating at specific times the camera obtains images of the same target from a variety of angles. During the F7RE ACE experiment the camera was
•Pacific Northwest National Laboratory, Richland, Washington. 2NASA Goddard Space Flight Center, Greenbelt, Maryland. 3Institute of Atmospheric Physics, University of Arizona, Tucson. 4Department of Geomatic Engineering, University College
London, London, United Kingdom.
5Gerber Scientific Inc., Reston, Virginia.
Copyright 2001 by the American Geophysical Union. Paper number 2000JD900302.
0148-0227/01/2000JD900302509.00
adjusted to reproduce the nine view angles which will be obtained by the satellite (that is, a nadir view plus 26.1 ø, 45.6 ø, 60.0 ø , and 70.5 ø forward and aft). Image resolution is approximately 7 m at nadir (with a cross-track image width of approximately 10 km) and 21 m at 70.5 ø.
This paper presents a detailed analysis of AirMISR data collected on June 3, 1998. In particular, the paper examines
AirMISR radiance measurements, as well as retrievals of
cloud albedo and cloud top height. This case study is the first step in a program to validate MISR cloud retrievals. The results are encouraging as the AirMISR measurements and retrievals are found to compare very favorably with those of
other instruments and with simulations based on a combi-
nation of in situ and ground-based measurements. Table 1 lists the name, location, and measured parameter of interests for instruments discussed in this paper.
After a brief description of the June 3 case in section 2, section 3 compares AirMISR radiance measurements with radiance measurements from the cloud absorption radiometer (CAR) [King et al., 1986], onboard the University of Washington CV-580, the moderate-resolution imaging spectroradiometer airborne simulator (MAS) [King et al.,
1996] and with radiative transfer simulations. Both the CAR
and the MAS instruments make measurement near 672 and
866 nm, and this study focuses on these wavelengths.
The 36 MISR satellite radiance measurements (four
wavelengths at nine angles) will routinely be used to estimate cloud albedo at the four MISR wavelengths. Section 4 com- pares the MISR albedo retrievals with measurements from the CAR instrument, as well as the solar spectral flux radiometer (SSFR), which was also onboard the University of Washington CV-580.
Finally, stereoimaging techniques can also be applied to image pairs, such as those acquired by AirMISR, in order to determine the height of observed features such as cloud tops. The MISR program plans to use stereobased height retrievals
15,202 MARCHAND ET AL.: MULTIANGLE OBSERVATIONS
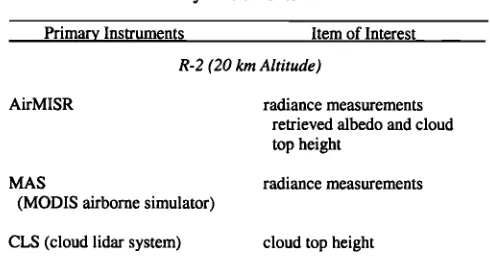
Table 1. List of Primary Instruments
Primary Instruments Item of Interest
R-2 (20 krn Altitude)
AirMISR radiance measurements retrieved albedo and cloud top height
MAS
(MODIS airborne simulator)
radiance measurements
CLS (cloud lidar system) cloud top height
University of Washington CV-580 (Above, Below and in Cloud) CAR
(cloud absorption radiometer)
radiance and albedo
FSSP- 100 particle effective radius liquid water content PVM-100A particle effective radius
liquid water content SSFR
(solar spectral flux radiometer)
hemispherical spectral shortwave (up and down viewing instruments used to obtain cloud top albedo) Cloud integrating nephelometer asymmetry parameter
SHEBA Ice Station (Ground Site)
Millimeter-wave radar reflectivity, Doppler velocity
(cloud boundaries) Passive microwave radiometer cloud liquid water path Pyranometers
(ARM radiometer) (PAM station radiometers)
hemispheric broadband shortwave
Lidar (Dabul) cloud base, depolarization ratio
both to help determine when clouds are present and to determine the cloud top height. (It is also important to know the position of reflecting surfaces so that measurements of the upwelling radiances at all angles can be geometrically coregistered to the correct common point.) Section 5 com- pares AirMISR-retrieved cloud top height with that measured from the airborne Cloud Lidar System (CLS), which was onboard the NASA ER-2, and from ground-based millimeter-
wave cloud radar.
2. Description of the June 3 Case -
From May 31 to June 11 the SHEBA station was between a surface low to the northwest and the Beaufort high, which was far to the east. The ship was typically under southerly winds which brought some fog and drizzle on June 5 and 7, while some light snow occurred on June 9 and 11 (D. Wylie, personal communication, University of Wisconsin-Madison, 1998). On June 3 the SHEBA site was under southeasterly
winds and was overcast by stratus clouds for more than 24 hours preceding the overpasses of the ER-2. For much of this time the cloud was multilayered with the top of the highest layer near 3 km.
Plate 1 shows reflectivity data from the vertically pointing
millimeter-wave cloud radar onboard the Des Groseilliers for
the several hours surrounding the ER-2 overpasses (data pro- vided by Taneil Uttal, Environment Technology Laboratory). Multilayer stratus clouds persisted over the ship until about
2200 UTC (universal time coordinated) after which time there
is no lower cloud. The millimeter-wave radar reflectivity is
proportional to the sixth moment of the droplet size and therefore very sensitive to particle size. Much of the reflec- tivity associated with the upper cloud (that is, the relatively high-reflectivity region extending from 3 km to just below 2 km) is drizzle or ice crystals falling from the cloud. Cloud
base of the upper cloud was between 2.5 and 2.8 km as
revealed by ground-based lidar, radar Doppler velocity, and in situ measurements.
In simulations presented in section 3, cloud base of the upper cloud was taken as 2.7 km when lidar estimates were
not available as a result of attenuation due to the lower cloud.
Although cirrus clouds were observed earlier in the day,
neither the ground-based millimeter-wave radar nor the Cloud
Lidar System (CLS) on the ER-2 detected any cirrus in the vicinity of the ship at the time of the ER-2 overpasses.
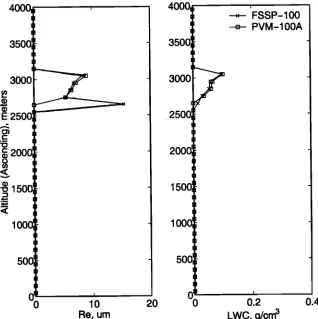
The University of Washington CV-580 conducted in situ measurements during one descent, at approximately 2120 UTC, and one ascent at approximately 2215 UTC near
the SHEBA ship. Figures 1 and 2 show the mean effective
radius and liquid water content measured by a Particle
Measuring Systems Model FSSP-100 and a Gerber Scientific
Instruments PVM-100A [Gerber et al., 1991] (data provided by P. Hobbs, University of Washington, and H. Gerber, Gerber Scientific Inc.). During the descent the CV-580 passed through two cloud layers with most of the liquid water contained in the upper cloud layer. In the upper cloud layer
both instruments show an effective radius that increased from
about 6 #m at cloud base to about 10 #m at cloud top. Both
instruments also showed a standard deviation in the effective
radius of roughly 1 it m during the descent and a somewhat larger standard deviation during the ascent. In the lower cloud, which was sampled only during the descent, both probes showed an effective radius between about 5 and 8 #m with a standard deviation of about 2 it m.
During both the descent and the ascent the FSSP detected a
few relatively large particles just below cloud base (consistent with the radar observation). Some of these particles may well have been ice crystals. Be that as it may, the depolarization lidar on the SHEBA ship revealed depolarization ratios for both clouds which are typical of water drops. Further, the FSSP and PVM are known not to yield consistent retrievals for ice clouds and water-like values of the asymmetry param- eter where measured with the cloud integrating nephelometer [Gerber et al., 2000] on the CV-580. It seems very probable that the clouds were predominately composed of liquid water.
3. Upwelling Radiance and Broadband
Surface Flux15,203
o o o o o
o o
,
0 0 0 0 0
0 0 0 0 0
0 0 0 0 0
CO r'• (D LO •
w 'aPn•!l!V
15,204 MARCHAND ET AL.: MULTIANGLE OBSERVATIONS
MARCHAND
ET AL.: MULTiANGLE
OBSERVATIONS
15,205
4000,
3500
3000
2500
2000
150•
1000•
ot
o lORe, um
400O
350C
3000
i
-• FSSP-100 [] PVM-100A
I
2O
0
O.2
O.4
LWC,
g/cm
3
Figure
1. Effective
radius
(left)
and
liquid
water
content
(fight)
measured
by
the
FSSP
and
PVM
during
descent
through
the
cloud
layers
at approximately
2120
UTC.
4OOO
350O
30OO
FSSP-100 PVM-100A
i
0
10
20
0
0.2
0.4
Re, um
LWC,
g/cm
3
15,206 MARCHAND ET AL.: MULTIANGLE OBSERVATIONS
Figure3, the radiance is expressed as a bidirectional reflectance factor (BRF), which is simply the ratio of the
measured radiance to what would be measured from a
perfectly reflecting Lambertian surface.
CAR is a multiwavelength scanning radiometer that meas- ures the angular distribution of scattered radiation [King et al., 1986; King, 1992; Tsay et al., 1998]. During the FIRE-ACE experiment the CAR instrument was housed in the nose of the University of Washington CV-580. The instrument has a mirror that scans in a plane perpendicular to the direction of flight through a 190 ø opening. By flying in a circular pattern (the flight path is depicted in Figure 3) and scanning from just before zenith to just past nadir a composite of the upwelling and downwelling radiance fields can be constructed. In Plate 2, the composite was created by binning the measure- ments into 1 ø x 1 ø cells and taking the median value in each cell. The data have been corrected for pitch and roll of the CV-580, as outlined by King [1987]. (The instrument on- board the CV-580 that measures the aircraft pitch (i.e., the Trimble TANS/vector GPS altitude system) did not function properly during this portion of the flight. After discussions with Peter Hobbs, a best guess pitch of 5 ø was used. After inclusion of a correction factor to account for the alignment of
the CAR instrument relative to the aircraft (as measured by J. Li, Goddard Space Flight Center), we have great confidence that resulting CAR pointing is good to approximately 1 ø, since the pointing correction results in the Sun being located pre- cisely where ephemeris calculations indicate it should.) Because of the aircraft pitch, however, there is a small region near nadir (the center of the pattern) which was not observed by the radiometer.
Plate 3 shows that a similar BRF can be obtained using plane-parallel radiative transfer calculations. These calcula- tions were done using the spherical harmonics discrete
ordinate method (SHDOM) [Evans, 1998]. The calculation
shown used cloud boundaries estimated from radar and lidar
data, as described in section 2. The liquid water content was set to linearly increase in height (from zero at cloud base) with the total liquid water path set to the value obtained from
a passive microwave radiometer at the SHEBA site. (A two-
channel microwave radiometer was supplied by the Department of Energy Atmospheric Radiation Measurement (ARM) program for this experiment. During this portion of the experiment the radiometer was operating in a tip (or scanning) mode which requires a couple of minutes to obtain a complete set of data from which to retrieve cloud liquid
4000
2000
-2000:
-4000
-6000
ß
-6000
ß .
-4000 -20O0 0 2000
UTM - Meters East of Ship
4000
Figure 3. AirMISR 672 nm nadir image obtained at approximately 2102 UTC over the SHEBA ice station
(plus) on a universal transverse mercator (UTM) projection. This figure also shows the position of three of the NCAR portable automated mesonet (PAM Ill) stations and the flight path of the University of Washington CV-580 during acquisition of the CAR data (approximately 2105 UTC to 2119 UTC). (The A
MARCHAND ET AL.: MULTIANGLE OBSERVATIONS 15,207
water path and water vapor path. The liquid water retrieval used in this study assumes the liquid water temperature to be equal to the air temperature (between 2.8 and 3 km) as meas- ured by a radiosonde (i.e., balloon). This approach differs from the standard ARM approach which is based on a statistical technique [Westwater, 1993]. Since the water was higher and hence colder than the "typical" case, the liquid water path used here is 20 to 25% lower than what is obtained using the statistical approach.) Three quarters of the liquid water was placed in the upper cloud. In the upper cloud the cloud droplet effective radius was set to increase linearly from 6/zm at cloud base to 10/zm at cloud top. One quarter of the liquid water was placed in the lower cloud with a constant effective radius of 7/zm. These distributions are consistent
with the in situ measurements discussed in section 2.
The radiative transfer calculations are strongly influenced by the highly reflective sea ice. Although there was not a great deal of snow on the ice surface by this time, there were few (if any) melt ponds and little open water or new ice. (Personal communication, D. Perovich, Cold Regions Research and Engineering Laboratory, and J. Curry, University of Colorado.) Figure 4 depicts the average spectral surface albedo measured (sampled) over a 100 m strip near the SI-•BA ice station by D. Perovich on June 3 (same day as
the overflight) [Perovich, 1994]. Figure 4 also shows the
model spectral albedo used in the radiative transfer calcu-
lations. The radiative transfer calculations treat the surface as
Lambertian and yield a broadband albedo of 0.71 (under cloudy conditions). Although sea ice is not a Lambertian reflector, this approximation should be sufficient under highly diffuse illumination, as is in the present case.
Turning attention to the surface flux, Figure 5 shows the
downward shortwave broadband flux measured at the SI-•BA
ship and at three of the National Center for Atmospheric Research (NCAR) portable automated mesonet (PAM IX[) stations. The position of the PAM stations and the SI-•BA ship are given in Figure 3. Figure 5 shows that the simulation agrees well with the measurements from 2000 UTC until after 2100 UTC. After 2100 UTC the measured flux begins to greatly exceed the simulated value. All four radiometers
show this increase in downward flux, but the southern-most station (Baltimore) shows the effect earlier than the other
sites. (The ARM measurement (located at the ship) is con- sistently higher than the nearby Seattle and Atlanta PAM stations before the overflilght of the ER-2. The reasons for
this are unclear. We note, however, a reduction in the cloud
liquid water path by 20% or an increase in effective radius by 20% (or a combination of the two) increases the simulated
flux sufficiently to agree closely with the ARM radiometer.
A combined error of 20% in the estimate for these quantities is very plausible, and so the closer agreement of the simula- tion with the PAM data does not necessarily suggest that the
ARM radiometer is incorrect.) Data from the MODIS air-
borne simulator (MAS) show what appears to be a region of very thin clouds south (that is downwind) of the ship, and although it is not very obvious in Figure 3, the southern portion of the cloud scene is, in fact, brighter than the northern half. It seems probable that the cloudy region in the southern portion of Plate 1 is optically thinner than the region to the north. It is also possible that because the sea ice is highly reflective (allowing for significant multiple scattering of photons between the surface and the clouds) and because
0.9
0.8
0.7
0.6
0.5-
0.4-
0.3
0.2-
0.1-
0 0
!
Model
Measurements
x
I I I
1 2 3
wavelength, um
15,208 MARCHAND ET AL.: MULTIANGLE OBSERVATIONS
6OO
55O
E
• 500
LL 450
• 400 o -o 350
(o 300,
25O
• Simulation
- ARM Radiometer
PAM station A
_ PAM station B
;: /, • ... PAM
station
S
ß
/'
\.•/
/' /
•
_
i.
Ill•/
• •,
200 ' ' ' '
20 21 22 23 24
time, hours UTC
Figure 5. Simulated and measured broadband shortwave flux at the surface. The measured flux at the SI-]•BA ice station and at three of the PAM stations is presented. Station B or Baltimore was the southern- most station, as depicted in Figure 3.
the thin cloud region is in the direction of the Sun (sea ice usually has a strong scattering component near the specular direction) that there may be a significant increase in the surface flux due to horizontal transport of photons after
2100 UTC.
Taking a closer look at the measured and simulated radi- ances, Plate 4 compares the radiative transfer simulation to
the CAR, AirMISR, and MAS radiance measurements in the
azimuthal plane observed by AirMISR (i.e., along the direc- tion of flight of the ER-2); that is, Plate 4 represents a cut plane or slice removed from Plate 2. The plate shows that the AirMISR measurements agree extremely well with those of
the CAR instrument (solid line) and the MAS data. (As with the CAR data, the AirMISR and MAS data were binned into
1 ø x 1 ø cells. The AirlVQSR and MAS data were also visual
aligned to ensure that both data corresponded to the same
cloud region.)
It should be stressed that the CAR measurements began approximately 2 min after the first overpass by the ER-2, and even if the timing had been more precise, CAR would not be sampling exactly the same cloud region. As a rough measure of the variability that one might expect due to observing differing areas of the cloud scene, the light dotted line in Plate 5 shows one standard deviation in the composite CAR
BRF. The error bars on the AirMISR measurements, on the
other hand, represent the 3% absolute calibration uncertainty for this instrument, which is larger than the standard deviation
in the measured radiances.
In addition to sampling issues, CAR was flying on the CV-580 only a few hundred meters above cloud top, whereas
AirMISR and MAS were about 17 km above the clouds.
However, in the absence of absorbing aerosols above the
cloud layer, the only significant change in the upwelling radiance at this wavelength is due to Rayleigh scattering and absorption by ozone. (In the simulations the ozone concen- tration was set to .397 atm cm. This is the average value which we inferred using the Langely technique with MFRSR measurements on May 23 and 24 (the nearest time with sufficient clear skies to apply the Langley approach).) The simulations show that except near the forward scattering
direction, the difference between 3.5 km and 20 km is not
significant. Measurements and simulations near 870 nm (Plate 5) show much the same pattern as those near 670 nm (Plate 4), except, of course, ozone and Rayleigh scattering have no appreciable effect.
The simulations shown in Plates 4 and 5 include a small
amount of aerosol (optical depth of about 0.1 at 500 nm). This optical depth is consistent with measurements obtained from a multifilter rotating shadow band radiometer (MFRSR) on the nearest clear-sky days of May 23 and 24. In the model, the aerosol was uniformly distributed between the surface and 2 km, and the aerosol properties were chosen to be consistent
with D'Alrnedia et al. [1991 (see tables 43b and 44b)] for
summer arctic aerosol (asymmetry parameter 0.689 and single-scattering albedo 0.884 at 672 nm). The aerosol has
only a small effect on the simulations. Without the aerosol
the upwelling radiances increase by about 1%. The same holds true for the albedo (see also Table 2 in the following
section). 4. Albedo
MARCHAND ET AL.: MULTIANGLE OBSERVATIONS 15,209
Table 2. Comparison of Albedos
672 nm 866 nm
AirMISR (local)
2102 UTC
homogeneous* 0.82 +-0.03 0.78 heterogeneous 0.88 0.84
no azimuthal variation 0.90 0.86
2131 UTC
homogeneous 0.86 0.82
heterogeneous 0.89 0.85
no azimuthal variation 0.93 0.90
CAR (local)* 0.82 + 0.036 0.77 -t- 0.036
SSFR (at cloud top) 0.90 + 0.038 0.82 -t- 0.038
Simulation (local)
no aerosol 0.85 0.82
with aerosol 0.84 0.82
At cloud top
no aerosol 0.88 0.82
with aerosol 0.87 0.82
The "local" albedo is the ratio of the upwelling irradiance at cloud
top to the estimated downwelling irradiance at the top of the atmosphere. The table shows AirMISR-based retrievals using the MISR homogenous model, the MISR heterogeneous model and assuming no azimuthal variation in the upwelling radiance. The assigned uncertainty corresponds to one standard deviation in the observation. The change in the AirMISR retrieval due to "within
scene" variability is less than the calibration uncertainty of 3%. *It must be stressed that all of the measurements correspond to somewhat different times and different regions of the cloud field. With that said, one would expect the AirMISR 2102 UTC and the CAR measurements to be in the closest agreement.
greater accuracy than current satellite-based estimates, which effectively use only one such angular measurement.
MISR plans to use three approaches in estimating the cloud albedo. (1) When a cloud scene is believed to be homoge- nous, a relationship based on a library of plane-parallel simu-
lations is used to estimate the albedo. The determination of
whether or not to use a homogeneous model is based on a combination of the observed heterogeneity of the cloud scene at the several pixel levels and on how well the measured
radiances fit the pattern of the homogeneous model.
(2) When a given pixel does not meet the homogeneous cloud criteria, a heterogeneous cloud model is used which has been created using Monte Carlo simulations of a variety of hetero- geneous cloud fields. The applicability of this heterogeneous (or statistical) model is also examined by evaluating how well the pattern of the measured radiances matches the hetero- geneous model. (3) In the event that even the heterogeneous model appears inappropriate the cloud albedo is estimated assuming that there is no azimuthal variation in the cloud
reflection [Diner et al., 1997].
Table 2 summarizes the narrowband albedos as inferred
from AirMISR, CAR, and the radiative transfer simulations,
as well as that measured by the Solar Spectral Flux Radiometer (SSFR) [Pilewskie et al., 1998] (data provided by,
P. Pilewskie, NASA Ames). (In obtaining the SSFR spectral albedo the CV-580 navigation data were used to isolate periods where the aircraft was near level flight (within +2.5 ø) in both pitch and roll. A moving average filter with an approximately 60 s window was applied to the navigation data to remove occasional spurious read- ings. At each selected time, the SSFR upwelling and downwelling spectral irradiance were averaged over a period of roughly 5 min before being used to calculate the albedo. (Averaging intervals of 5 to 15 min yield very similar results, while periods much smaller than 5 min yielded similar means but higher standard deviations).) It
must be stressed that all of the measurements correspond to
somewhat different times and different regions of the cloud
field. The CAR results are closest in time to the first AirMISR measurements at 2102 UTC, and these results are
highlighted in the table.
The albedos in Table 2 reported by AirMISR (and by CAR) are defined as the ratio of the measured upwelling irradiance to the downwelling irradiance at the top of the
atmosphere. Borrowing from MISR nomenclature, these
albedos are labeled as "local" albedos. As a result of absorp-
tion by ozone and Rayliegh scattering, this albedo should be
somewhat lower than the ratio of the upwelling to down-
reference surface
[•-- apparent-•
I
motion
15,210 MARCHAND ET AL.: MULTIANGLE OBSERVATIONS
O MAS 870 nm
... CAR 869 nm
1.4 ß '.' Simulation (20 km)
I ':,'•:'•
-. Simulation
(3.5
km)
•t!l/'..••,
x AirMISR
866
nm
1.3
1.2 i
:.•
1.1
1
!\•.
0.9
0.6-
0.5'' '
-80 -60 -40 -20 0 20 40 60 80
Plate 5. Modeled and Measured upwelling radiance in the azimuthal plane measured by AirMISR near
860 nm.
34OO
6000
40OO
o 2000
o z
,-- 0
i
•: -2000
-4000
-6000
-8000 -6000 -4000 -2000 0 2000
UTM - Meters East of Ship
3300
3200
3000
4000
2900
2800
2700
2600
2500
Plate 6. Stereoretrieved cloud top height (in meters) using the full MISR algorithm for the images shown
MARCHAND ET AL.: MULTIANGLE OBSERVATIONS 15,211
welling at cloud top. The simulations show that this differ- ence is about 3% at 670 nm and negligible at 860 nm.
In summary, Table 2 shows that the AirMISR-based retrievals using the MISR homogeneous model are in good agreement with the measurements of CAR and SSFR, as well
as the radiative transfer simulations. The MISR hetero-
geneous and no-azimuthal-variation models produce albedo estimates that are somewhat higher. This is not surprising since (1) the measured radiances are relatively near the principle plane and so assuming no azimuthal variation is bound to result in an overprediction and (2) the cloud upwelling is well modeled using a plane-parallel model (see
Plates 2 and 3).
5. Stereoimaging (Cloud Top Height)
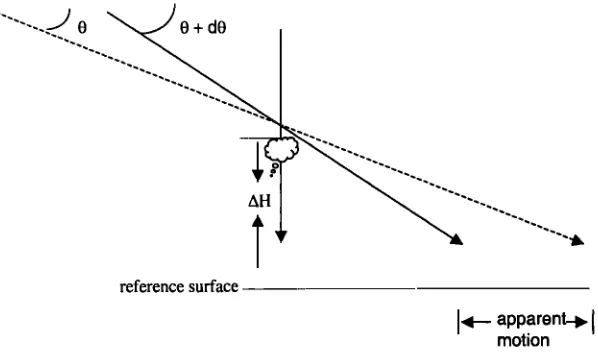
In addition to radiance measurements and corresponding albedo estimates, stereoimaging techniques can be applied to
the AirMISR multiangle data to determine the altitude of
observed objects, such as cloud tops [Moroney et al., 1999; Diner et al., 1998b]. Figure 6 shows a simple sketch of the basic concept.
Figure 7 shows the 866 nm nadir and forward +26.1 ø views obtained during one pass over the SHEBA ground. A careful inspection of the figure suggests that a number of cloud features appear to have moved between the acquisition of
these two AirMISR images. Using an estimate of the actual
cloud velocity (obtained from rawinsonde data in this case but
will be obtained by MISR using a third image), this apparent shift in position can be used to extract the cloud top height. Plate 6 shows the stereoretrieved cloud top height for the
image pair in Figure 7. For the most part, the cloud top heights displayed in Plate 6 vary between about 2.8 and
3.2 km. Given the uncertainties in the cloud velocity, location and orientation of the ER-2, as well as pointing angle
uncertainties with the AirMISR instrument itself, we estimate
that this retrieval should be accurate to approximately 500 m. The average cloud top height is consistent with millimeter-
wave radar data from the SHEBA ice station (see Plate 1),
which shows cloud tops very near 3 km for the several hours surrounding the ER-2 overpasses. Further, a careful exami- nation of the stereoderived cloud top height field shows that
the position of the retrieved valleys and peaks are consistent
with a visible interpretation of the cloud cell structure.
The retrieval is also consistent with measurements made
from the downward looking Cloud Lidar System (CLS), which was being flown onboard the ER-2 [Spinrime et al., 1982]. Plate 7 compares the AirMISR stereoderived cloud
top heights along the ER-2 ground track, with those measured by the lidar. In this plate the height retrieval, using both the
full MISR algorithm, and only a portion of the algorithm are
included.
The first step in the MISR stereoheight retrieval is to identify common features between image pairs. The MISR
approach uses a number of image and feature recognition
codes (called M2, M3, and rank sort) as well as a variable search window. A complete description of these algorithms
can be found in the work of Diner et al. [ 1998b]. The search
window restricts the size of the target image where a
matching feature is sought. If one uses a small search
window centered on the correct point in the target image, one
is unlikely to misalign the features and, of course, the retrieval
works much faster. Plate 7 shows that the lidar and complete
MISR algorithm compare very favorably (well within the estimated 500 m uncertainty). This cloud scene shows little variability in the cloud top, and part of the reason the full algorithm works well in this example is that the search window is reduced in size such that it is unlikely that a poor
match will be found. Without the reduced search window the
matcher still works well, shown here using only the M2 matcher with a large search window. However, a number of blunders (or incorrect matches) were encountered. (All those
points that do not lie near the lidar cloud top height are blunders caused by incorrect image matching.) Many but not
all of these blunders are detected as blunders by the software.
Techniques which will identify the blunders with greater fidelity are currently being investigated by the MISR science
team. Several of these techniques make use of consistency between stereo matching of a forward view with nadir and an
aftward view with nadir.
Of course, the resolution of the AirMISR images is much
higher than the MISR satellite instrument. Be that as it may, the cloud top height retrieval algorithm continued to perform well even after averaging the AirMISR data to match the
resolution of MISR, as shown in Plate 8. Plate 8 is the same
as Plate 7 only that the AirMISR radiance data were averaged to 275 m resolution prior to attempting the stereoheight
retrieval. The finite spatial resolution of the images intro-
duces a quantization of the possible retrieved heights. At the
reduced image resolution of 275 m the AirMISR quantization
(for this example) is more than 500 m; that is, a one pixel shift in the position of an object (in one image relative to the other) changes its height retrieval by more than 500 m. In Plate 8,
the small variations in heights (less than 100 m) are due to
small variations in the aircraft orientation. The handful of
points whose height retrieval is near 3800 m is the result of only a one pixel error in the image matching. Similar results to those displayed in this section were obtained on AirMISR overpasses and using various possible image pairs from the
nadir, +26.1 and +45 ø views.
6. Summary
This case study is the first step in a program to validate MISR cloud retrievals. A detailed analysis of AirMISR data
shows that the radiance measurements as well as retrievals of
cloud albedo and cloud top height (based on MISR algorithms) are in good agreement with other instruments (CAR, MAS, SSFR, CLS, millimeter cloud radar) and with
radiative transfer simulations based on a combination of
ground-based and in situ measurements.
With respect to cloud top height it was observed that the
use of a reduced search window improved the algorithm performance. This improvement will only be realized when the cloud top heights are relatively uniform, as in this case. With the reduced search window intentionally removed, the
algorithm performed well on average. The only difficulty
without the reduced search window was the ability of some poor matches (or blunders) to go undetected. However, it should be stressed that cloud regions with relatively large
variations in cloud top height (i.e., those where the reduced
search window will not be used) will generally have cloud features which are easier to identify than for this very homo-
15,212 MARCHAND ET AL.: MULTIANGLE OBSERVATIONS
4400 4200 4000 3800 3600 3400 3200 3000 2800 2600
21
Cloud Lidar Sytem
AirMISR: M2 Image Matcher
AirMISR: Full Algorithm
[]
[]
[]
[]
I I [] ! I I I
.508 21.51 21.512 21.514 21.516 21.518
Time, UTC
Plate 7. Comparison of stereoretrieved cloud top height and ER-2 CLS-measured cloud top height. Stereobased results are shown with both the full MISR algorithm (Plate 6) and the one that does not include a restricted search window.
44OO 42OO 4000 38OO 3600 3400 3200 3000 28OO 26OO
'
Cloud Lidar Sytem
[] AirMISR: Reduced Resolution, M2 Image Matcher
t J ! I t
21.032 21.034 21.036 21.038 21.04
Time, UTC
Plate 8. Comparison of stereoretrieved cloud top heights using images with resolution reduced to 275 m
15,213
... o o o CD
0 C) 0
0 ¸
d!qs •o q•oN sJolo• - wñn
.... .. : ... .:. ..,. : .... ::...
ß
o o o
o o o
o
OLLI
0 03
0 1
0 0
0 0 0
I
o o
o
o o
o c•
003
o
ouJ
o •
o •
o t
o o
t
o o o
15,214 MARCHAND ET AL.: MULTIANGLE OBSERVATIONS
Finally, with respect to cloud albedo it is worth mentioning that despite a highly reflective underlying surface (and considerable multiple scattering of photons between the cloud and the surface), typical arctic aerosols had only a small effect (-1%) on the simulated upwelling radiance and albedo (above
cloud top).
Acknowledgments. The authors would like to express their thanks and acknowledge the help of a great many people who made
this research possible. Thank you Tamas Varnai at the Goddard
Space Flight Center and Rowan Dundas at University College London for developing and running the image matching and MISR albedo software; Frank Evans for providing SHDOM and answering
lengthy inquires; Jason Li at the Goddard Space Flight Center and
Jeff Myers at the NASA Ames Research Center for providing
calibrated data from the Cloud Absorption Radiometer and MODIS
Airborne Simulator, respectively; Peter Hobbs at the University of
Washington for his helpful comments and for providing the in situ cloud data and navigational data for the CV-580; Don Perovich at the
Cold Regions Research and Engineering Laboratory for providing the
surface spectral albedo data; Taneil Uttal at the Environment Technology Laboratory for providing the millimeter cloud radar data;
James Spinhirne and Bill Hart at the Goddard Space Flight Center for providing cloud top heights from the Cloud Lidar System; Judy Curry at the University of Colorado and Don Wylie for at the University of Wisconsin-Madison for their helpful comments; and Peter Pilewskie and John Pommier at NASA Ames for providing the Solar Spectral Flux Radiometer data. We thank also our colleagues in the SHEBA Atmospheric Surface Flux group, Ed Andreas, Chris Fairall, Peter Guest, and Ola Persson, for helping to collect and process the PAM data. The National Science Foundation supported this research with grants to the U.S. Army Cold Regions Research and engineering Laboratory, the NOAA's Environmental Technology
Laboratory, and the Naval Postgraduate School. Last but not least, thank you to those at the NASA Jet Propulsion Laboratory who made this research possible, Jose D. Garcia, Marco A. Hernandez, William
C. Ledeboer, Veljko M. Jovanovic, Bill Cunningham, Carol Bruegge, and others on the MISR project who assisted in the postflight processing. This research was made possible by support of NASA
and the MISR program. We would especially like to thank David Diner for this support and insights.
References
Bruegge, C. J., V. G. Duval, N. L. Chrien, R. P. Korechoff, B. J.
Gaitley, and E. B. Hochenberg, MISR prelaunch instrument
calibration and characterization results, IEEE Trans. Geosci. Remote Sens., 36(4), 1186-1198, 1998.
Curry, J. A., et al., FIRE Arctic Clouds Experiment, Bull. Am.
Meteorol. Soc., 23(6), 1264-1276, 1999.
D'Almedia, G. A., P. Koepke, and E. P. Shettle, ATMOSPHERIC AEROSOLS: Global Climatology and Radiative Characteristics, A. Deepak, Hampton, Va., 1991.
Diner, D. J., R. Davies, T. Varnai, C. Moroney, C. Borel, and S.A.W.
Gerstl, Multiangle imaging spectroradiometer level 2 top-of-
atmosphere albedo algorithm theoretical basis, Tech. Doc. JPL D-13401, Jet Propul. Lab., Calif. Inst. of Technol., Pasadena,
1997.
Diner, D. J., et al., The airborne multiangle imaging
spectroradiometer (AIRMISR): Instrument description and first results, IEEE Trans. Geosci. Remote Sens., 36(4), 1339-1349,
1998a.
Diner, D. J., R. Davies, L. DiGirolamo, A. Horvath, C. Moroney, J.P. Muller, S. R. Paradise, D. Wenkert, and J. Zong, Multiangle
imaging spectroradiometer level 2 cloud detection and classification algorithm theoretical basis, Tech. Doc. JPL D-11399, Jet Propul. Lab., Calif. Inst. of Technol., Pasadena, 1998b.
Evans, K. F., The spherical harmonics discrete ordinate method for three-dimensional atmospheric radiative transfer, J. Atmos. Sci.,
55, 429-466, 1998.
Gerber, H., Direct measurement of suspended particulate volume
concentrations and far-infrared extinction coefficient with a laser-
diffraction instrument, Appl. Opt., 30, 4824-4831, 1991.
Gerber, H., Y. Takano, T. G. Garrett, and P. V. Hobbs, Nephelometer measurements of the asymmetry parameter, volume extinction coefficient and backscatter ratio in Arctic clouds, J. Atmos. Sci., in
press, 2000. •
King, M.D., Determination of the scaled optical thickness of clouds from reflected solar radiation measurements, J. Atmos. Sci., 44(3),
1734-1751, 1987.
King, M.D., Directional and spectral reflectance of the Kuwait oil- fire smoke, J. Geophys. Res., 97, 14,545-14,549, 1992.
King, M.D., M. G. Strange, P. Leone, and L. R. Blaine, Multiwavelength scanning radiometer for airborne measurements of scattered radiation within clouds, J. Atmos. Oceanic Technol.,
3, 513-522, 1986.
King, M.D., et al., Airborne scanning spectrometer for remote sensing of cloud, aerosol, water vapor and surface properties, J. Atmos. Oceanic Technol., 13, 777-794, 1996.
Moroney, C., R. Davies, and R. Marchand, Cloud-top heights from AirMISR stereo measurements, in Proceedings of the loth Conference on Atmospheric Radiation, pp. 110-113, Am. Meteorol. Soc., Boston, Mass., 1999
Perovich, D. K., Light reflection from sea ice during the onset of melt, J. Geophys. Res., 99, 3351-3359, 1994.
Pilewskie, P., A.F.H. Goetz, D. A. Beal, R. W. Bergstrom, and P. Mariani, Observations of the spectral distribution of solar irradiance at the ground during SUCCESS, Geophys. Res. Lett., 25(8), 1141-1144, 1998.
Spinhirne, J. D., M. Z. Hansen, and L. O. Caudill, Cloud top remote sensing by airborne lidar, Appl. Opt., 22, 1564-1571, 1982. Tsay, S.C., M.D. King, G. T. Arnold, and J. Y. Li, Airborne spectral
measurements of surface anisotropy during SCAR-B, J. Geophys. Res., 103, 31,943-31,954, 1998.
Westwater, E. R., Ground-based microwave remote sensing of meteorological variables, chap. 4, in Remote Sensing by Microwave Radiornetry, edited by M. A. Janssen, John Wiley,
New York, 1993.
T. P. Ackerman and R. T. Marchand, Pacific Northwest National Laboratory, 902 Battelle Blvd, MSIN K9-24, P.O. Box 999, Richland, WA 99352. (thømas'ackerman@pnl'gøv; roj@ pnl.gov)
R. Davies and C. Moroney, Institute of Atmospheric Physics, University of Arizona, Tucson, AZ 85721 -0081.
H. Gerber, Gerber Scientific Inc., 1643 Bentana Way, Reston, VA 20190.
M.D. King, NASA Goddard Space Flight Center, Greenbelt, MD 20771.
J.-P. A. L. Muller, Department of Geomatic Engineering, University College London, London, United Kingdom.
(Received January 14, 2000; revised April 24, 2000;


![Figure 5. Simulated and measured broadband shortwave flux at the surface. The measured flux at the SI-]•BA ice station and at three of the PAM stations is presented](https://thumb-us.123doks.com/thumbv2/123dok_us/7969054.1321596/8.605.156.452.58.351/figure-simulated-measured-broadband-shortwave-measured-stations-presented.webp)
![Synthesis of poly[(pyrrole-2,5-diyl)-co-(4-hydroxylbenzylidene)] catalysed by Maghnite– H+](data:image/gif;base64,R0lGODlhAQABAIAAAP///wAAACH5BAEAAAAALAAAAAABAAEAAAICRAEAOw==)