International Journal of Research (IJR)
e-ISSN: 2348-6848, p- ISSN: 2348-795X Volume 2, Issue 09, September 2015Available at http://internationaljournalofresearch.org
Determination of Surface roughness at different parameters
cutting speed, depth of cut & feed rate
Deepak Sangwan# & Somvir Arya
*#
M. Tech,4th sem student, I.I.E.T. Kinana.
*
Assistant Professor, Head of Mechanical Engg. Department,I.I.E.T. Kinana.
ABSTRACT
In the present research work gives the effect of different machining parameters (cutting speed, feed rate and depth of cut) on surface roughness in end milling is determined. Taguchi technique of optimization is used to select different parameter. The experimental work is carried out on hardened Die-Steel H-13. The processing of the job was done by solid carbide four flute end-mill tool under finishing conditions to calculate different variables and their levels. L-9 standard orthogonal array is used for calculation of number of variables and number of levels. Signal to Noise Ratio is used to calculate the significant parameter where as ANOVA F-Test is carried out to determine the percentage effect of each parameter.
Introduction
Automation and mass production are associated with advancement in technology. in the mass production units since the quantity of item required is very high with little or no variety special purpose machines, automatic machines or transfer lines have been used. On a CNC machine it is possible to make hundreds or even thousands of the same items in a day. Out of various machining processes, milling process has the advantage of multi-point cutting tool with high dimensional accuracy. the end milling is the most common metal removal operation encountered. In end milling the tool can cut the work-piece either horizontally or vertically. We are used three parameters (1) cutting speed (2) feed rate (3) depth of cut . and methodology adopted taguchi methodthe tool used in the Taguchi method is the orthogonal array (OA). The Taguchi method employs a generic signal-to-noise (S/N) ratio to quantify the present variation. Hass surya vf 30 cnc vs milling machine is finalized to carry out the experimentation. The range and levels of various process parameters have been identified using Pilot Experimentation. The software used for analysis in this project is Minitab 15. results
shows that the highest value of cutting speed, lower value of feed rate and higher value of depth of cut gives the better surface finish (lower surface roughness).
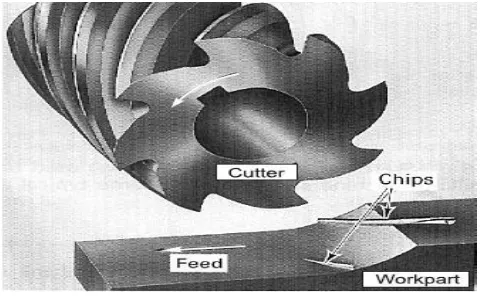
1.2 Milling Process
Out of various machining processes, milling process has the advantage of multi-point cutting tool with high dimensional accuracy. Milling process can be of two types up and down milling so any method can be used according to the requirement of work piece. Among several CNC industrial machining processes, milling is a fundamental machining operation and the end milling is the most common metal removal operation encountered. In end milling the tool can cut the work-piece either horizontally or vertically. The processing of the job can be done by different types of end-mill tool under finishing conditions.
International Journal of Research (IJR)
e-ISSN: 2348-6848, p- ISSN: 2348-795X Volume 2, Issue 09, September 2015Available at http://internationaljournalofresearch.org
traditionally performs this operation is a milling machine.
Milling is an interrupted cutting operation. The teeth of the milling cutter enter and exit the work during each revolution. This interrupted cutting action subjects the teeth to a cycle of impact force and thermal shock on every rotation. The tool material and cutter geometry must be designed to withstand these conditions. Cutting fluids are essential for most milling operations.
Figure 1.1 Schematic Milling Operation
1.3.3 End Mill
The most common cutting tool used with a vertical milling is an end-mill, which looks like a stubby twist drill with a flattened end instead of a point. An end mill can cut into a work piece either vertically, like a drill, or horizontally using the side of the end mill to do the cutting. This horizontal cutting operation imposes heavy lateral forces on the tool and the mill, so both must be rigidly constructed. By making a series of horizontal cuts across the surface of a work piece, the end mill removes layers of metal at a depth than can be accurately controlled to about one-thousandth of an inch (.001").
Work Piece Material
Work piece Hot Die Steel H-13 is high hot strength, hardness and Good resistance to heat, good hot toughness, high resistance to temperature fatigue and wear in medium heat.
Chemical Composition of H-13
Chemical Composition C Si Mn Cr Mo V
Percentage (%)
0.35 1.00 0.30 5.00 1.50 0.90
Selection of Machine
HAAS Surya VF 30 CNC VS milling machine is finalized to carry out the experimentation.
Selection of Tool
Tool used in the experiment is four flute solid carbide type flat end mill. Dry cutting condition has been recommended for the experimental work. The diameter of the end mill cutter is 10mm.
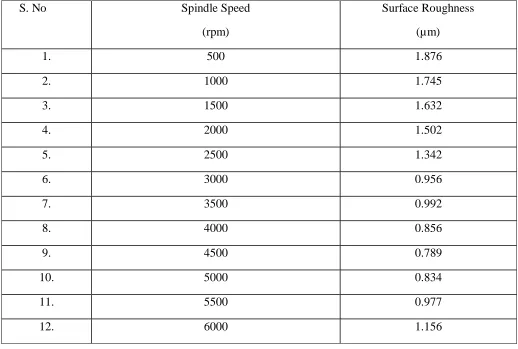
1. Effect of Spindle Speed on Performance Measure
International Journal of Research (IJR)
e-ISSN: 2348-6848, p- ISSN: 2348-795X Volume 2, Issue 09, September 2015Available at http://internationaljournalofresearch.org
Table 4.1 Spindle Speed versus Surface Roughness
S. No Spindle Speed
(rpm)
Surface Roughness
(µm)
1. 500 1.876
2. 1000 1.745
3. 1500 1.632
4. 2000 1.502
5. 2500 1.342
6. 3000 0.956
7. 3500 0.992
8. 4000 0.856
9. 4500 0.789
10. 5000 0.834
11. 5500 0.977
12. 6000 1.156
Spindle speed
0 0.2 0.4 0.6 0.8 1 1.2 1.4 1.6 1.8 2
500 1000 1500 2000 2500 3000 3500 4000 4500 5000 5500 6000
International Journal of Research (IJR)
e-ISSN: 2348-6848, p- ISSN: 2348-795X Volume 2, Issue 09, September 2015Available at http://internationaljournalofresearch.org
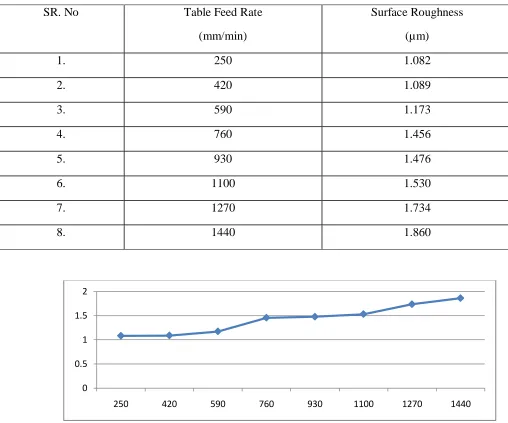
2. Effect of Table Feed Rate on Performance Measures
The table feed rate is varied from 250mm/min to 1440mm/min in steps of 170 units. The values of the other parameters are kept constant and their values are given as Spindle Speed = 4000rpm; DOC = 1.0mm. The experimentally observed data for the response characteristic for different values of table feed rate is given in Table 4.2. Figure 4.3 shows the scatter plots of table feed rate versus response characteristic. The value of surface roughness increases with table feed rate.
Table 4.2 Feed Rate versus Surface Roughness
SR. No Table Feed Rate
(mm/min)
Surface Roughness
(µm)
1. 250 1.082
2. 420 1.089
3. 590 1.173
4. 760 1.456
5. 930 1.476
6. 1100 1.530
7. 1270 1.734
8. 1440 1.860
Surface roughness v/sFeed rate
0 0.5 1 1.5 2
International Journal of Research (IJR)
e-ISSN: 2348-6848, p- ISSN: 2348-795X Volume 2, Issue 09, September 2015Available at http://internationaljournalofresearch.org
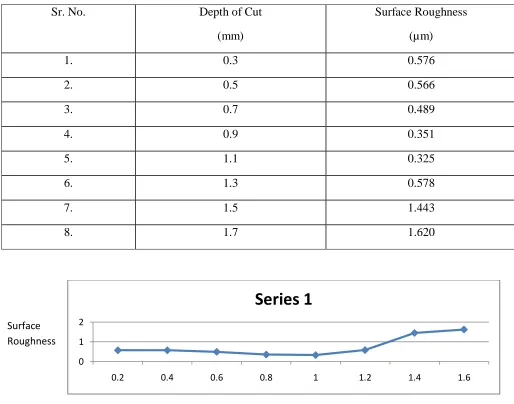
3. Effect of Depth of Cut on Performance Measures
The doc is varied from 0.3mm to 1.7mm in steps of 0.2 units. The values of the other parameters are kept constant and their values are given as Spindle Speed = 4000rpm; Table feed rate = 923mm/min; Step Over = 1.0mm; Coolant Pressure = 1.34b/inch2. The experimentally observed data for the response characteristics for different values of doc is given in Table 4.3 & Figure 4.4 shows the scatter plots of doc versus response characteristic. The value of surface roughness shows a little decrease in start but then increases rapidly.
Table 4.3 Depth of Cut versus Surface Roughness
Sr. No. Depth of Cut
(mm)
Surface Roughness
(µm)
1. 0.3 0.576
2. 0.5 0.566
3. 0.7 0.489
4. 0.9 0.351
5. 1.1 0.325
6. 1.3 0.578
7. 1.5 1.443
8. 1.7 1.620
Figure 4.4 Depth of Cut versus Response Surface Roughness
0 1 2
0.2 0.4 0.6 0.8 1 1.2 1.4 1.6
Series 1
Surface Roughness
International Journal of Research (IJR)
e-ISSN: 2348-6848, p- ISSN: 2348-795X Volume 2, Issue 09, September 2015Available at http://internationaljournalofresearch.org