DOI: 10.15680/IJIRSET.2014.0308005
Analytical Model for the Effects of Reservoir
Formation Matrix on the Performance of
Microbial Enhanced Oil Recovery
Nmegbu, Chukwuma Godwin Jacob
1Ph.D Candidate, Department of Petroleum Engineering, Rivers State University of science and technology, Rivers State, Nigeria 1
ABSTRACT: The performance of any EOR technique puts into critical consideration the reservoir geology, lithology, reservoir
uniformity, pay continuity and a wide range of other rock properties. This multi-mechanism, environmental friendly and inexpensive biotechnological approach to oil recovery (MEOR) must also put into consideration the formation characteristics for an effective and productive microbial injection project. This study tends to ascertain numerically the effects of formation matrix on the performance of MEOR by presenting a mathematical model accounting for microbial concentration distribution for various formation types. Results showed that for a homogenous reservoir, the average microbial concentration in the reservoir increased linearly with increasing days of microbial injection. Variation of porosity and permeability in heterogeneous reservoir yielded a non-linear relationship as a result of the varying rock properties when averaging method of permeability and porosity was adopted. A non-averaged permeability and porosity deduction for a heterogeneous formation will result in a more distorted concentration profile of the injected microbes. An irregularity in concentration distribution of microbes in these heterogeneous reservoirs is traceable to the distorted propagation and transportation of these injected microbes.
KEYWORDS: Formation, Heterogeneous, Homogeneous, Matrix, MEOR, Microbes
I. LITERATURE SURVEY
The rock properties and their variations from one location to another significantly influence MEOR performance and ultimately the oil recovery [6]. Fredrickson et al presented experimental results on pore-size constraints on the activity and survival of the subsurface bacteria using different grain size of the medium to high permeability [4], [7]. The microbes were investigated in fractured porous media using etched-glass micro-models [8]. [8] also used non fracture models to compare the efficiency of MEOR in fraction and non-fracture porous media. Among their considerations were the choice of microbes limited to Bacillus substilis (a biosurfactant producing microbe) and leuconostocmesenteroides (an exopolymer producing microbe). Their result showed that higher oil recovery efficiency will be achieved by using a biosurfactant producing bacteria in fractured porous media. The presentation of five successful MEOR projects was reported in [9]. These projects reflected diversity of locations, depth, porosity, permeability and temperatures which were conducted in different parts of the world. The projects included sandstone, fractured dolomite and fractured sandstone reservoirs. Reservoir depth ranged from 4450 to 6900ft, temperatures from 110oF to 180oF, porosity range from 0.079 to 0.232 and effective permeability from 17 to 300mD. Analysis of the above showed that MEOR recovers oil and reduced water production from highly permeable zones.
DOI: 10.15680/IJIRSET.2014.0308005
application, the analysis of these effects on fluid flow, microbial concentration profile and production rates of recoverable oil forms the basis of this study.
II. INTRODUCTION
Conventional oil recovery methods cannot recover all of the oil in the reservoir when the reservoir has fully depleted its primary energy drive. Hence the need for microbial enhanced oil recovery (MEOR) which is a sophisticated technique meant for recovering high viscosity crude in the reservoir. Microbial enhanced oil recovery usually termed oil bio-refining and biodegradation results in recovering heavier oil due to is viscosity reduction effects, volume displacement, surface tension reduction, acid reaction, increased permeability, improved sweep efficiency and increased reservoir pressure [1], [2]. The matrix of a reservoir formation consists of organic and inorganic materials that are under compaction in a reservoir [3], [4]. It is also the arrangement of grains in the formation, consisting of organic and inorganic materials that are under compaction in a reservoir [4], [5].The arrangement of the rock grains determines the permeability, porosity, inter-connectivity, tortuosity and fluid saturation of the formation.
III. RESEARCH METHODOLOGY
The mathematical model to be proposed for demonstrating bacteria transportation through porous media is based on a combination of the theories proposed by Gruesbeck et al [11] for description of entrainment and deposition of fines in porous media
Fig. 1 Control Volume
Fig. 1 above illustrates a control volume indicating microbial mass flow in and out at various coordinates: Total accumulation = Mass in – Mass out
i.e
b w w p
b w b w
w b
w t bs
b w
w
R B S V
C Q C bw B
S C
B U C
C B
S
t
D
(1) Removing Gradient operators and Re-writing equation (1) in 3-D gives.
b W W p
b W b bw w w b
w t bs
b w
w
R
B
S
V
C
Q
x
C
D
B
S
C
B
U
x
C
C
B
S
t
bW W
P b W b
bW W W b
W
t
R
B
S
V
C
Q
x
C
D
B
S
C
B
U
y
bW W
P b W b
bW W W b
W t
R
B
S
V
C
Q
x
C
D
B
S
C
B
U
z
DOI: 10.15680/IJIRSET.2014.0308005
Assuming single-phase fluid flow in 1-dimension (i.e X-direction) gives:
b W W p
b W b bw w w b
w t bs
b w
w
R
B
S
V
C
Q
x
C
D
B
S
C
B
U
x
C
C
B
S
t
(3) Where:
Cb = flowing concentration of the bacteria and substrate (lb/cft)
Cbs = Adsorbed concentration of bacteria and substrate at the pore surfaces (lb/cft)
Sw= Saturation of the water phase (%)
Bw = Formation volume factor of the water phase (cft/scft)
Qw= Volumetric injection rate of bacteria and substrate via the water phase (stb/day)
Φ = Rock porosity (%)
Vp = pore volume of the porous medium
Ut = The total flow velocity (ft/day)
DbW= physical dispersion of bacteria in the water phase (ft2/day)
Rb = Biological bacteria growth (day -1
) Where
b W W
C B S
Represents the accumulation of microbes and substrates in the aqueous phase.
(ϕCbs) denotes the adsorption of the bacteria and substrate in the pore space. It is a function of the rate of
detachment and retention respectively.
The term
b W
t
C B U
x represents the convection term. The velocity (U
t) in this term is defined as:
x
C
C
x
K
U
U
SS C
W
t
.
1
4) Where
UW = Darcy Velocity (flux) for the water phase (ft/day)
KC = chemotactic co-efficient (ft3/day)
CS = Concentration of substrate (lb/cft)
Chemotactic movement is defined as the directed movement of a cell towards a substrate. Microbes can sense a nutrient-rich environment and move in that direction.
While Darcy flow occurs due to pressure gradient, chemotactic migration of bacteria is assumed to be proportional to an exponential change in nutrient concentration. It is worthy of note, that chemotactic flow of bacteria is much smaller than convective flow and hence, it is significant only near static conditions. Therefore equation (4) becomes
W
t
U
U
(5)
1. The term
x C B
S x
b bw W W
is the dispersion tensor. The elements of the dispersion tensor include both molecular diffusion and mechanical dispersion. Since the mechanical dispersion is mostly negligible, then the elements are given as:
bbw D
D
(6) Db = Molecular diffusion co-efficient for bacteria and substrate in the water phase ( ft/ day )
= Tortuosity of the porous media/reservoir (dimensionless)2. The term
b b W
V C Q
is the microbial and substrate injection rate
3. The term
b W W R
B S
DOI: 10.15680/IJIRSET.2014.0308005
Bacterial growth can either occur in a single – substrate or a double substrate medium; though growth can be inhibited by alcohol or a metabolic product. The dependence of bacterial growth rate, m, on substrate concentration is
represented by Monod’s equation
S S
S m
C K
C
m a x
(7) Where
m = Maximum specific growth rate obtained in excess substrates (day -1)
CS = the concentration of growth limiting substrate (lb/cft)
Ks = The substrate concentration corresponding to half max (lb/cft). In general, KS, for most growth substrates is
very small.
Since there was no adsorption of bacteria, substitution of equations (5), and (7) into equation ( 3) yields
m W W
p b W b
bw w w b
w W b
w w
B
S
V
C
Q
x
C
D
B
S
x
C
B
U
x
C
B
S
t
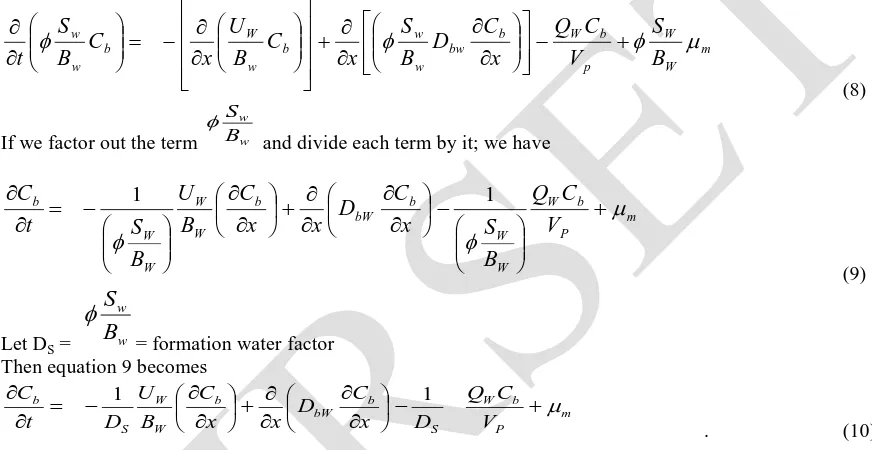
(8)
If we factor out the term w w
B S
and divide each term by it; we have
m P
b W
W W b
bW b
W W
W W b
V
C
Q
B
S
x
C
D
x
x
C
B
U
B
S
t
C
1
1
(9)
Let DS = w w
B
S
= formation water factor Then equation 9 becomes
m P
b W S b bW b
W W S b
V C Q D x C D x x C B U D t
C
1 1
. (10)
Equation (10) above is the model equation for describing microbial and substrate transport in porous media.
a. Finite Difference Approximation
FDA proves the best solution to the proposed microbial model, its description presented below;
Fig. 2: Finite difference presentation in space
DOI: 10.15680/IJIRSET.2014.0308005
Fig. 3: Discretization system for a MEOR subjected Porous media
Fig. 3 illustrates a block centered grid system which was selected for the finite difference formulation. The X and Y directions are the areal coordinates and the positive z-direction is normal to the bedding plane in the downward direction. The blocks are numbered in natural order.
The model equation for microbial and substrate transport in porous media in equation (10) above can be written as:
m ii P S b i i bW i b i W S W i b V D C x Cb D x C B D U t C
2 2 2 (11) Re-writing equation (11) using forward difference givest
t
C
C
nbiC
nbi i b
1(12)
i bi bi i b x xC
C
C
1
. .(13)
)
(
2 1 1 2 2 2x
C
C
C
i bi bi bi i b x C
(14)Substituting equation (12), (13) and (14) into (11) gives
)
(
2 1 1 1 1 2x
C
C
C
C
C
C
C
i bi bi bi i bW i bi bi i W S W n bi n bi D x B D Ut
m ii P S bi w
V
D
C
Q
(15) b. Spatial DiscretizationAt a grid-block boundary, the first term on the RHS of equation (10) can be re-written using finite difference approximation for spatial derivatives as follows:
2 1 2 1 2 1 2
1
DOI: 10.15680/IJIRSET.2014.0308005 2 1 1 2 1
i bi bi i bX
x
C
C
C
(17) And 2 1 1 2 1 i bi bi i b X x
C
C
C
(18)
Substitution of equation (17) and (18) into (16) gives
12
1 2 1 1 2 1 i bi bi i bi bi i w s w i b i w s w X X B D U x C B D
U
C
C
C
C
(19)
Assuming uniform grid-block size and spacing we have
C
biC
biC
bi
i w s w i b i w s w
X
B
D
U
x
C
B
D
U
1 1 2 12
(20)Substitution of equation (20) into equation (15) yields
)
(
2 1 1 1 1 2 1 1 2 2x
C
C
C
C
C
C
C
C
i bi bi bi i bW bi bi bi i w s w n bi n bi D X B D Ut
m ii P S bi w V D C
Q
(21)
If we assume i i i
X X 2 1
(i.e. uniform block boundary and grid block size / spacing), then
mp s b w w s w bw bi bi bi n bi n bi
V
D
C
Q
X
B
D
U
D
t
C
C
C
x
C
C
)
(
2 1 1 12
(22)c. Explicit Formulation
The explicit formulation of the model in (22) assumes a base time level of n. This implies that the microbial concentrations on the RHS of (22) assumes the n-base time level (tn) and therefore can be re-written as
mp s n bi w w s w bw n bi n bi n bi n bi n bi t V D t Q X B D U D t
C
x
C
C
C
C
C
)
(
2 1 1 1 2 (23) Resolving (23), we obtain
mn bi p s w w s w bw n bi n bi n bi n bi n bi
t
V
D
t
Q
X
B
D
tU
tD
C
x
C
C
C
C
C
)
(
2 1 1 12
(24) The above yields
mn bi p s w w s w bw n bi n bi n bi n bi n bi
t
V
D
t
Q
X
B
D
tU
tD
C
x
C
C
C
C
C
DOI: 10.15680/IJIRSET.2014.0308005
Rearranging the above
mw s
w bw
n bi n bi n bi p s w w
s w bw
n bi n
bi n
bi D B X t
tU tD
V D
t Q X B D
tU tD
x
C
C
C
x
C
C
C
)
(
)
(
2 1 1 21
2
(26)
In terms of
C
n
bi 1
, the above can be written as;
m w
s w bw
n bi n
bi p
s w w
s w bw
n bi n
bi t
X B D
tU tD
V D
t Q X B D
tU tD
x
C
C
x
C
C
)
(
)
(
2 1 1 21
2 1
(27)
Let
X
B
D
tU
tD
M
w s
w bw
x
)
(
2.
(28) Therefore equation (27) becomes
m n
bi n
bi p
s w n
bi n
bi M t
V D
t Q
M
C
C
C
C
1 1 1
2 1
(29) The following assumptions were made in deriving the deduced model:
1) The bacteria and substrate were transported into the reservoir via the water phase. 2) There was no external production during the period of microbial injection.
3) There was no adsorption of bacteria on the pore spaces during propagation and therefore bacterial rates for retention and detachment were to considered
4) Minimal substrate metabolites production
5) Change sin porosity (Ø) phase saturations (Sw) and formation volume factors (Bw) were small compared
to changes in concentrations. 6) Chemo-taxis. Not considered
7) Effects of mechanical tensor were negligible. 8) Gravitational effects were neglected.
9) Microbial injection and transportation occurred in a homogenous and isotropic reservoir ( porous media) i.e. K = constant at constant velocity ( Uw)
10) Area of microbial flow in porous media is constant.
11) There was no microbial influx at boundaries during propagation.
12) Other factors affecting MEOR such as salinity and pH were not considered. 13) No specific microbial consideration
IV. RESULTSANDDISCUSSION
Using field parameters from X field, the rock and fluid properties are presented below Formation porosity ϕ = 20%;
Reservoir Dimension x = 1000ft; y = 500ft; z = 200ft kx=Ky=Kz= 100md,
P
=2,500 Psia Sw=0.3DOI: 10.15680/IJIRSET.2014.0308005
w=1.0cp
Qw=100 bbl/day
Also,
Bulk volume (Vb) = x. y. z = (100 x 500 x 200) ft3 =100 x 106 ft3
Area of reservoir = x. y. = (1000 x 500 x 200) ft3 = 100,000ft2 Pore volume, Vp = ϕVb = 0.2 x 100 x 106 = 20 x 106 ft3
Velocity of injected water, Uw =
1000 1
2500 100
.
X P K
w
= 250 x 1.127 x 10-3 = 0.28175 x 5.615 = 1.582ft/day
Assumed Parameters;
Initial microbial concentration, Cbi = 300 lb/lft
Bacteria growth rate (Monod’s constant), m = 1.3 Day-1
Molecular Diffusion of bacteria, Db = 0.2 ft2/Day
Tortuosity of formation (Sandstone) = 2 Time-step (interval of iteration) =5 days
Calculating constants
1 . 0 2
2 .
0
b
bw
D
D ft
2/Day
06 . 0 1
3 . 0 2 .
0
w w s
B S
D
1000 1 06 . 0
) 5 582 . 1 ( ) 1000 (
) 1 . 0 5 ( )
( 2 2
x sB
t U x
D t M
w w bw
= 1.0 x 10⁻⁶ - 0.2637 = -0.1318
Recall averaged permeability for a heterogeneous reservoir Kavg, the equation below is adopted in place of K.
averaged permeability for a heterogeneous reservoir Kavg =
6 6 5 5 4 4 3 3 2 2 1 1
6 5 4 3 2 1
1 1
K L K
L K
L K
L K
L K
L
L L L L L L
K L L
n
i i
i n
i
i
(30)
Table 1 deduced average microbial concentration across the reservoir
Time (days)
Microbial concentration, lb/cft. (heterogeneous averaged permeability)
microbial concentration, lb/cft (heterogeneous non-averaged permeability)
microbial
concentration, lb/cft (homogenous)
5 307.58 298.13 306.38 10 314.12 305.28 312.78 15 321.16 312.75 319.18 20 328.11 317.48 325.58 25 331.91 320.23 331.98 30 333.12 322.00 338.38
DOI: 10.15680/IJIRSET.2014.0308005
Fig. 4: Plot of microbial concentration against time for homogenous permeability
Fig. 4 shows a plot of average microbial concentration against time in Fig. 4 gives a straight line. The implication of this is that for a homogenous reservoir system having constant permeability and porosity, there is a constant increase in biomass concentration at every point in time. Since the formation matrixes are uniformly arranged, transportation of microbes were not breached, distorted or impeded. This results in a steady and defined transportation of the injected microbes.
Fig. 5: plot of microbial concentration against time for heterogenous averaged permeability
Fig. 5 presents the response of the concentration of microbes with increasing time for a heterogeneous reservoir system, adopting the averaging method for porosity and permeability. It is observed that for varying formation matrix parameters such as porosity and permeability, the microbial concentration profile is distorted. Therefore the average microbial concentration trend with increasing time will not be uniform as seen for the homogeneous system.
300 305 310 315 320 325 330 335 340
0 5 10 15 20 25 30 35
m
icrob
ial
con
ce
n
tra
tio
n
, lb
/cf
t
Time (Days)
305 310 315 320 325 330 335
0 10 20 30 40
m
ic
rob
ial con
ce
n
trat
ion
, lb/cf
t
DOI: 10.15680/IJIRSET.2014.0308005
Fig. 6: Plot of microbial concentration against time for heterogenous non-averaged permeability.
Biomass concentration per unit time was also calculated for heterogeneous reservoir whose varying rock parameters without adopting the averaging method for porosity and permeability. The inconsistencies observed in the plots of concentration against time with different porosity and permeability is shown in Fig 6. A reduction in the values of microbial concentration was observed as microbes moved across the reservoir grid blocks form injector well to the producer, traceable to the clogging tendency of the microbes as they meander through the formation. The above phenomenon will result in an inefficient microbial oil recovery process.
Fig. 7: comparison of all matrix types showing plots of microbial concentration against time
A comparison of concentration of the injected microbes with respect to injection time is presented for homogeneous, heterogeneous and heterogeneous Averaged permeability in Fig 7. Both heterogeneous formations appear to follow the same trend, but the non-averaged permeability formation recorded a lower microbial concentration over the injection period.
V. CONCLUSION
MEOR is almost applicable to any type of reservoir with respect to their depositional characteristics, reservoir configuration, bed arrangement etc.Adaptation of the averaging method for both permeability and porosity will
295 300 305 310 315 320 325
0 5 10 15 20 25 30 35
m
icrob
ial
con
ce
n
tra
tio
n
, lb
/cf
t
Time (Days)
295 300 305 310 315 320 325 330 335 340 345
0 10 20 30 40
Microb
ial
con
ce
n
tra
tio
n
(lb
/cf
t)
Time (Days)
homogenous formation
DOI: 10.15680/IJIRSET.2014.0308005
minimize the degree of distortion in the concentration profile of the injected microbe. The performance efficiency of MEOR will be higher in magnitude for a homogenous reservoir as when compared to the performance of MEOR for Heterogeneous reservoirs, irrespective of the adaptation of the averaging method for the rock properties. It is understood that variation in rock properties such as porosity and permeability will significantly determine the transport, mobility, propagation, performance and efficiency of the MEOR process.
ACKNOWLEDGEMENT
The Author highly appreciates the efforts of Ezeanya Obinna and Pepple Daniel Dasigha for the fruitiness of this study
REFERENCES
[1] Lazar,I.,Petrisor,I.G., and Yene,T. E.,“Microbial Enhance oil recovery (MEOR)”, Petroleum Science and Technology, vol. 25.pp. 1353-1366,2007.
[2] His,C.D., Dudzik,D.S., and Buettner,J.W.,“Formation Injectivity damage due to produced water reinjection”, presented at the Society of Petroleum Engineers International Symposium on Formation Damage Control, Lafayette, Louisiana, 7‐10 Feb, SPE 27395,1994.
[3] Cunningham,A.D., Characklis,W.G.,Abedeen,F., and Crawford,D., “Influence of biofilm accumulation in porous media hydrodynamics”, Environmental Science and Technology, vol. 25 (7), 1305‐1311.1991.
[4] Fredrickson,J. E., “Pore size Constraints on the activities of Subsurface Bacteria”,Journal ofGeomicrobiology. (14), pp. 183-207,1997.
[5] Youssef,N., Elshahed,M. S., and McInerney,M. J.,“Microbial processes in oil fields: culprits, problems, and opportunities”, Advances in pplied Microbiology, vol. 66, edited,pp. 141‐251, Elsevier Academic Press Inc., San Diego, 2009.
[6] Jose,L.Z., and Rhoda,P.L., “Physical and Chemical Factors Influencing Transport of Microorganisms Through Porous Media". Applied environmental Microbiology Pp.57, 2473-2481.
[7] Fujinoto,Y. “Kinetics of Microbial Growth and Substrate Consumption”. Journal of theoretical Biology. Pp. 17-191,1963.
[8] Aliveza,S.,Ayatolahi,S. S., Hassam,M., Maryam,Z., and Fazard,S.S., “The in-situ Microbial Enhanced oil Recovery in Fractured Porous Media”. Journal of Petroleum science Engineering, Science Direct,2006.
[9] Singh,A., Van Hamme,J. D., and Ward,O.P., “Petroleum Microbiology Part-2”, Recovery, biorefining and Biodegradation Process. Chemistry Today 24(2) pp. 65667.2006.
[10]Darcy,H.,“Permeability Determination in Horizontal, Vertical or Inclined Porous Media.” Pp. 100,1860.
[11]Gruesbeck, C., and Collins, R.E.,“Entrainment Deposition of Fine Particles in Porous Media”, SPE Journal., pp.847-856, Dec. 1982.
[12]Offune, J. I., “BacterialogicalExamination of Clinical Specimens”,Achugo Publications, Owerri, Nigeria.
[13]Buchannun, R. E., and Gobbson, N. E., “Bergey Manual of Determinative Bacterology”, 9thEdn. William and Wikkiams Company, Baltimore.
Pp. 39- 596, (1994).
[14]Ryan T. A., “Microbial Enhanced Oil Recovery: A Pore‐Scale Investigation of Interfacial Interactions”, a dissertation for the degree of doctor of philosophy in chemical engineering; pp. 1-2, 2012.
[15]ZoBell,C.E., “Bacteriological processes for treatment of fluid bearing earth formation”, US patent No. 2, 413,278.
[16]ZoBell, C.E.,“Bacterial release of oil from oil bearing materials, Part I”, World Oil,126(13), pp. 1-11.
[17]Moses, V., “MEOR in the field: Why so little”, proceedings from the 1990 International Conference on Microbial Enhancement of Oil recovery, reprinted from: Microbial Enhancement of Oil Recovery Recent Advances, edited by E.C. Donaldson, Elsevier Science Publishers, 1991, p 21-28, 1990.
[18]Baviere, M.,“Basic concepts in enhanced oil recovery processes”, Elsevier Applied Science, Critical reports in Applied Chemistry, Vol. 33.