HIGHER EDUCATION EXPENDITURE AND ECONOMIC GROWTH IN KENYA
LUCY NYIVA WAMBUA
A RESEARCH PROJECT SUBMITTED TO THE DEPARTMENT OF ECONOMIC THEORY IN THE SCHOOL OF ECONOMICS IN PARTIAL FULFILLMENT OF THE REQUIREMENTS FOR THE AWARD OF THE DEGREE OF MASTER OF ECONOMICS (POLICY AND MANAGEMENT)
OF KENYATTA UNIVERSITY
ii
DECLARATION
This project is my original work and has not been presented for a degree in any other University or any other award.
Signature………Date………
LUCY NYIVA WAMBUA
K102/CTY/PT/26950/2013
This research project has been submitted for examination with my approval as
University Supervisor:
Signature……….Date………
DR. CHARLES MUGENDI (PHD)
DEPARTMENT OF ECONOMICS THEORY
SCHOOL OF ECONOMICS
iii
DEDICATION
I dedicate this study to my family who supported and encouraged me all through my
iv
ACKNOWLEDGEMENTS
I thank the Almighty God for enabling me to write this paper. I am grateful for the
good health, strength, financial providence and grace freely granted. I am also greatly
v
TABLE OF CONTENTS
DECLARATION ... ii
DEDICATION ... iii
ACKNOWLEDGEMENTS ... iv
TABLE OF CONTENTS ... v
LIST OF TABLES ... viii
LIST OF FIGURES ... ix
OPERATIONAL DEFINITION OF TERMS ... x
ABBREVIATIONS AND ACRONYMS ... xii
ABSTRACT ... xiii
CHAPTER ONE ... 1
INTRODUCTION ... 1
1.1 Background ... 1
1.1.1 History of Higher education in Kenya ... 6
1.1.2 History of Economic Growth in Kenya ... 9
1.1.3 Trend of GDP and Expenditure in Higher education ... 10
1.2 Statement of the problem ... 11
1.3 Research Questions... 13
1.4 Objectives of the study ... 13
1.5 Significance of Study ... 14
1.6 Scope of the study ... 14
CHAPTER TWO ... 15
LITERATURE REVIEW ... 15
2.1 Introduction ... 15
2.2 Theoretical Literature ... 15
2.2.1 Education ... 15
2.2.2Human Capital expenditure by Schultz (1961) ... 16
2.2.3 O-Ring theory ... 18
2.2.4 Estimating the Private Return to Schooling: The Mincer model. ... 20
2.2.5 Endogenous Growth theory... 21
2.3 Empirical Literature ... 23
2.4 Overview of Literature ... 25
CHAPTER THREE ... 28
vi
3.1 Introduction ... 28
3.2 Research Design... 28
3.3 Theoretical Framework ... 28
3.3.1 The human-capital augmented Solow model ... 28
3.4 Empirical Models, Models Specification and Estimation ... 32
3.4.1 Pre Estimation Tests ... 32
3.4.1.1 Unit Root Test ... 32
3.4.1.2 Cointegration ... 33
3.4.2 Vector Error Corrección Model (VECM) ... 34
3.6 Data Type and Sources ... 35
3.7 Data Collection ... 35
CHAPTER FOUR... 36
EMPIRICAL FINDINGS ... 36
4.1 Introduction ... 36
4.2 Descriptive Analysis ... 37
4.3 Stationarity Analysis ... 39
4.4 Model Estimation ... 41
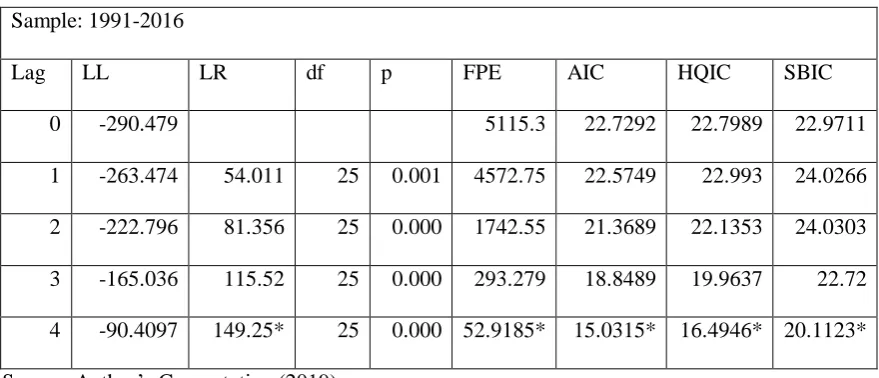
4.4.1 Lag Order Selection ... 41
4.4.2 Cointegration ... 42
4.4.3 Vector Error Correction Model (VECM) ... 43
4.4.4 Testing Short-Run causalities of the model Variables... 45
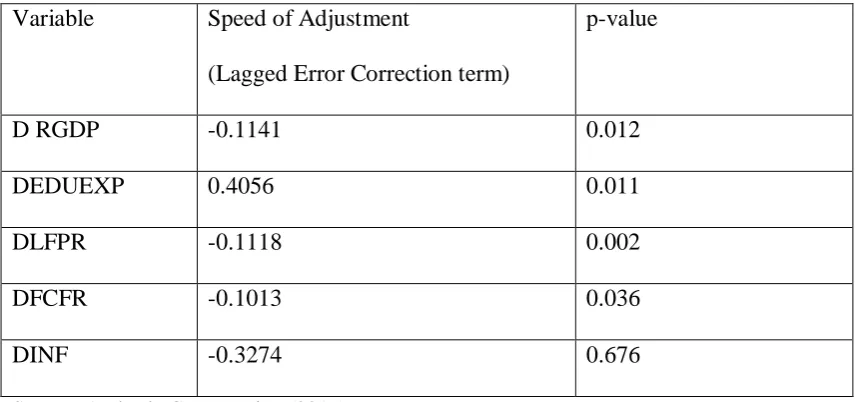
4.4.7 Error Correction Model ... 47
4.5 Post Estimation Tests ... 49
4.5.1 Normality of Residuals ... 49
4.5.2 Lag Order Autocorrelation ... 50
4.5.3 Model Stability ... 51
4.5.4 Roots of the Companion Matrix ... 51
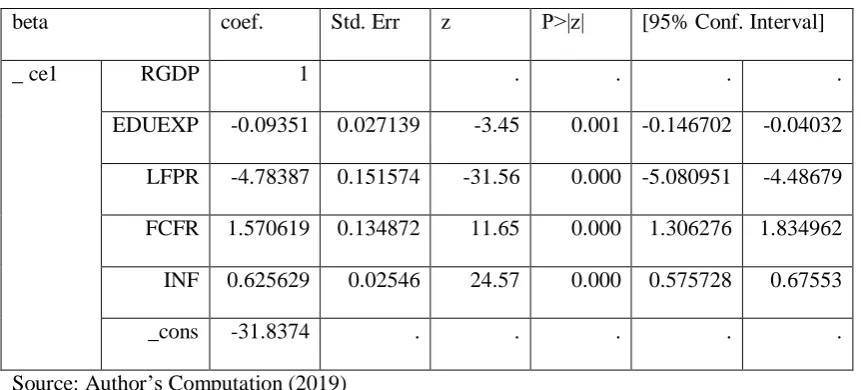
4.6 Discussion of Results ... 52
CHAPTER FIVE ... 55
SUMMARY, CONCLUSION AND POLICY IMPLICATIONS ... 55
5.1 Introduction ... 55
5.2 Summary ... 55
5.3 Conclusion ... 56
vii
viii
LIST OF TABLES
Table 4.1: Descriptive Analysis ... 38
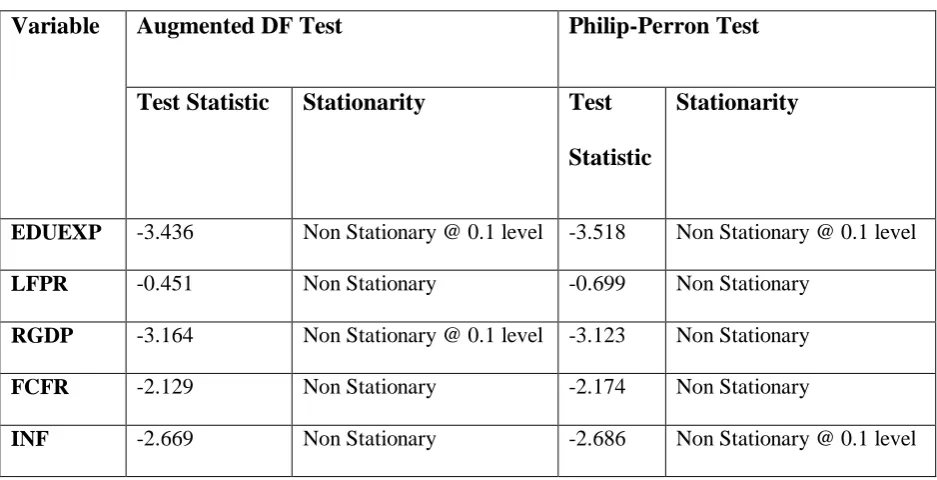
Table 4.2: Unit Root Test... 40
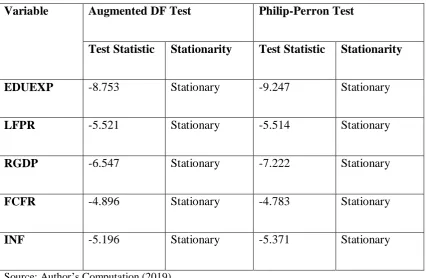
Table 4.3: Unit Root Tests Taking First Difference ... 41
Table 4.4: Selection Order Criteria ... 42
Table 4.5: Johansen Tests for Cointegration ... 43
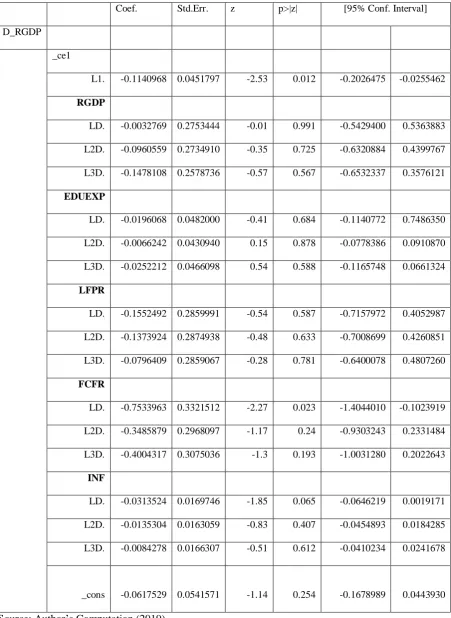
Table 4.6: Vector Error Correction Model ... 44
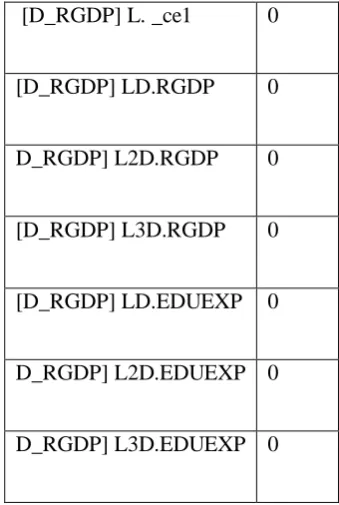
Table 4.7: Testing joint (for all lags) short run causality of EDUEXP towards RGDP by setting the null that joint short run causality is zero at p≤0.05, yields the following results. ... 45
Table 4.8: Testing Joint short run causality of model variables including EDUEXP (p≤0.05) ... 45
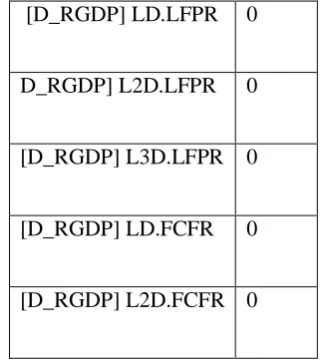
Table 4.9 Testing Joint short run causality of model variables without EDUEXP (p≤0.05) ... 46
Table 4.10: Long run Error Correction Terms ... 48
Table 4.11: Johansen Normalization Restriction Imposed ... 49
Table 4.12: Jarque-Bera Test for Normality of Distributed Disturbances ... 50
ix
LIST OF FIGURES
Figure 1.1: Comparison of the trend between Expenditure in higher education and
GDP………..10
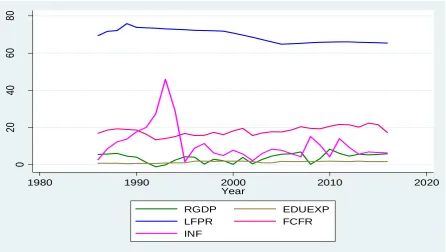
Figure 4.1: Trends in GDP Growth, Education Expenditure, Labor Force
x
OPERATIONAL DEFINITION OF TERMS
Causality: Is the capacity of past estimations of one variable to foresee another variable.
Cointegration: This refers to when there is a long-run economic relationship between variables.
Economic growth: Refer to an increase in a country’s output of goods and services, measured by changes in real Gross Domestic
Product.
Government Expenditure: Refers to the amount spent on goods and services, public debt servicing, and on capital investment by the
government.
Gross domestic product: This is the monetary measure of all goods and services produced over a given time period (usually a year)
excluding net property income from abroad.
Higher Education: Alludes to a level of training that is given by colleges, Technical schools, foundations of innovation and other
university-level establishments that grant scholastic
degrees or expert accreditations that is Tertiary
Education.
Higher Education Expenditure: This is refers to the act of committing funds geared towards higher education
Human Capital: Refers to the value of human capacities. It can be invested through education, training and enhanced
benefits that lead to an improvement in the quality and
xi
Productive Government Expenditure: It is the expenditure that increases the productive potential of the economy. It involves an
addition to the capital stock and production of tangible
assets
Vector Autoregressive: Is a forecasting technique in economics that does not distinguish between endogenous and exogenous
variables but is concerned with the path through time of
xii
ABBREVIATIONS AND ACRONYMS
ADF Augmented Dickey-Fuller
AIC Akaike Information Criteria
CHE Commission for Higher Education CUE Commission for University Education ECM Error Correction Model
ECT Error Correction Term
FPE Final Prediction Error
GDP Gross Domestic Product
HELB Higher Education Loans Board HQIC Hannan Quinn Information Criteria
IMF International Monetary Fund MME Modified M-Estimator OLS
Ordinary
KIPPRA Kenya Institute of Public Policy Research and Analysis KNBS Kenya National Bureau of Statistics
OECD Organization for Economic Cooperation and Development SBIC Schwarz’s Bayesian information criterion
USIU United States International University VAR Vector Auto-Regressive
xiii ABSTRACT
1
CHAPTER ONE INTRODUCTION 1.1Background
There has been a strong belief among economists that educational advancement
would prompt heighten growth, more riches and salary circulation, more prominent
correspondence of chance, accessibility of gifted human influence, a decrease in
human population, increased life expectancy, low crime rates and political security. It
is this belief that has led to widespread investment in education.
Schultz (1981) noted that the future welfare of man was based on principle
determinants such as population quality and enhanced learning. Explaining this
further, Harbison (1973) argues that the wealth of a county relies upon its ability to
build up its human resources and less on their physical assets. He goes further to say
that a nation which is unable to create skill and knowledge of its people and to use
them appropriately in the national economy will not be able to develop.
Education is considered as the pathway to economic success, the way to logical and
innovative progression, the way to battle joblessness, the establishment of social
equity, the initiate of political socialization and cultural diversity (Pscharopolos,
1988). Education is additionally observed as a tool for guiding and directing social,
economic and political elements and the generational developmental imperative of
societies (Ayodo and Gravenir, et al., 1999).
Education adds to the development of national income and individual income. While
2
capital and machinery became essential in modern social structures. In today’s social
orders, learning drives monetary development and improvement. Higher education is
the fundamental source of that information, its generation, dispersal and its retention
by any general public. Economic growth right now relies upon the ability to create
knowledge-based products. However, the fate of knowledge economies depends more
on their ability to create knowledge through research improvement as opposed to
knowledge-based products. Therefore, knowledge economies put more prominent
esteem and bestow higher need to the generation and disbursement of knowledge.
Therefore, it is evident that higher education foundations are a major source for
providing the human capital. (Wilkinson et, al 2013)
Higher education is paramount in building up the human capital that result in the
organizations that are viewed as an essential factor of progress. Higher education has
facilitated the rise of a lively middle-class society, which was not part of aristocracy
which was land-tied and that drew its benefits from feudalism. The middle-class
society comprises of professionals such as the bookkeepers, engineers, legal
counsellors, educators and many other specialists. This was important for the
advancement of modern institutions of capitalism and democracy (Crawley, 2004).
While it is obvious that there has been a considerable growth in higher education, it is
not clear exactly how important this vast growth is. Researchers have not been able to
get a decent hold on two basic yield estimates on how to gauge quality in higher
education and how to decide the value added by higher education over and beyond the
understudy's inborn capacities. It is completely conceivable that even in frameworks
3
people who approach it and crowd out from work others with comparable capacities
but lack formal education qualifications (Wolf, 2004). As indicated by Bloom et al
(2006), Higher education may make more prominent tax income, increment of reserve
funds and venture, and prompt a more innovative and urban culture. It can likewise
enhance a country's wellbeing, lead to a decreased populace, enhance innovation, and
strengthen governance.
The circumstances have changed as of late. Public universities no longer depend fully
on the state for their funding. The asset allotment arrangements received in a few
nations demonstrate that administrations encourage pioneering exercises which create
pay and a closer association among universities and beneficial sectors, particularly in
innovative work. Furthermore, numerous legislatures have enabled the private sector
to operate institutions of higher education, sector which is developing quickly in
many nations. These have reinforced market forces in higher education, now and
again crossing the limits of national frontiers (Anywanwu and Erhijakpor, 2007).
In both developed and underdeveloped nations, education enhancement has been
broadly perceived as the key to improving growth and development. In the past few
decades, macroeconomic literature has highlighted how education as a measure of
4
From one perspective, as asserted by Stevens and Weale (2003), since education
brings about individuals gains, the same should be observed for the entire nation, as
the benefits are expected to trickle down to the entire nation leading to economic
growth (Sianesi and Van Reenen, 2003).
Human capital is semantically the blend of human and capital. From the economic
viewpoint, the capital alludes to ‘components of production’ used to make
merchandise or services but are not expended in the process (Boldizzoni, 2008). Aside
from the importance of capital in the economic point of view, the human assumes the
responsibility of every single economic movement, for example, production,
consumption, and transaction. On the foundation of these ideas, human capital can be
viewed as a production component that generates added-value through inputting it.
The creation of human capital can be classified into two types. The first is to use ‘human as labour force’. This is where economic products are generated by inputting
labour force just like any other factor of production such as capital, land, machinery,
and labour hours. Up until the 1950's, most economists’ had asserted the significance
of such quantitative work. The other depends on the suspicion that the use of physical
capital may have a similar impact with that of human capital on education and
training (Little, 2003). Taking into account that the supposition acknowledges that,
the human capital expansively incorporates the significance of human being as the ‘maker’. As per the arguments, it will in general be perceived that the latter is more
important than the former (Beach, 2009). Several literary works show that human
5
found that human capital was the essential component to increase people's wages as
opposed to an increase in production factors (Salamon, 1991).
Amassing of human capital through education impacts numerous divisions.
Macroscopically, numerous analysts argue that gathering of one's human capital on
education and training investment to a great extent influences the development of an
individual' wage, firms' efficiency, and national economy (Denison, 1962; Schultz,
1961). Microscopically, Lepak and Snell (1999) demonstrate that a company's upper
hand is determined by the investment of human capital involved with value-creating
potential.
Human capital is highly valued in the work place, as it is believed that a highly
educated worker is efficient in their undertakings. Education is believed to enhance
specialists and therefore increase profitability. Alongside the conviction of education
improves workers by enhancing specialists' profitability, numerous researchers
emphasize the significance of education and training in the human capital field
(Griliches and Regev, 1995; Rosen, 1999).
Economists and researchers have proposed numerous ways in which education may
affect growth, not only through the individual’s returns' but also through a variety of
externalities. Highly developed countries, the most discussed externality is education
where they focus most on innovation and technology which makes labour more
efficient and leading to economic growth. Regardless of the gigantic enthusiasm for
the connection between education and economic growth, the proof is fragile, best case
scenario (Bils and Klenow, 2000).More so, when it comes to the relationship between
6 1.1.1 History of Higher education in Kenya
In Kenya, after the completion of Primary and Secondary education, graduates have a
variety of choices. The choices are based primarily on their performance in Kenya
Certificate of Secondary Education and also financial capability. Graduates who have
performed well can proceed to Public Universities. Others may opt to join private
universities for a number of reasons such as unavailability of the desired course in the
public university or failure to qualify for the desired course in public university. For
graduates who do not qualify for public university selection, they also have the option
of joining private universities depending on their performance as well. The other
graduates, who do not meet the university cut-off points, have the option of joining
Vocational schools. Examples of the Vocational schools are; Teachers Training
colleges, Technical colleges and mid-level colleges where they graduate with diploma
certificates. There are also other graduates who choose to join the job market.
Post-secondary education centers in Kenya known as polytechnics started as shadow
system forms of education. According to Court and Ghai (1974) "The shadow systems
were established to complement the formal system by meeting needs which were not
being met and which may have a wider application in the national system."
In the polytechnics, students learning were focused mainly on: On-the job training,
acquiring sills which would be essential in everyday life. In the late 1990s
polytechnics fell out of favour. With the slow demise of Polytechnics, others
converted to colleges such as Utalii College. It is during this period that we see
7
In Kenya, establishment of University education can be traced from back to 1961 with
Royal Technical College becoming University College, Nairobi. It was a constituent
of the University of East Africa which had two other constituent colleges in Dar es
Salaam and Kampala (Makerere). Up until 1966, The University of East Africa
offered programmes of the University of London. In 1970, the University of East
Africa was dissolved to create three independent universities in Nairobi, Dar es
Salaam and Makerere. The University of Nairobi was thus established as the first
university in Kenya(C Chacha, 2004).
Since independence in the year 1963, Kenya placed education in high regard as the
tool that would promote economic and social development (Sifuna, 1998). This
brought about fast development and expansion of institutions of education in order to
accommodate qualified persons who would in turn, bring forth some reforms to
reflect the aspirations of an independent state (Court and Ghai, 1974).
Throughout the 1970’s Kenya continued to expand The University of Nairobi in an
effort to provide education for all qualified Kenyans who would in turn, serve in both
the public and private sectors. As the number of Kenyans seeking higher education
increased, it led to the establishment of other universities like; Moi University in
1984, Kenyatta University a former constituent of the University of Nairobi in 1985
and Egerton University a previous agricultural college in 1988.
In late 1988, Jomo Kenyatta College of Agriculture and Technology became a
8
college of Moi University, and later a full-fledged Maseno University in 2001 and
later Masinde Muliro University was established in 2007.
In order to accommodate the high number of students that demanded higher
education, a parallel programme was established in 1998 at the University of Nairobi.
Later on, the program has been acquainted with every state-funded college. Students
under the parallel programme are self-supported while those in the normal program
are supported by the Government, which pays 70 percent of the expense of education
through credits from the Higher Education Loans Board (HELB). The education loan
is to be repaid once the student graduates and the one year grace period lapses.
Nonetheless, in July 2008, HELB extended its loan facility to self sponsored students
who faced cash flow difficulties.
In 2007 again, an even greater need to expand the number of universities arose with
the then sitting President establishing 15constituent colleges of the then existing 7
fully fledged public universities. The university colleges were later chartered in late
2012 and in 2013.At present university education has been expanded, leading to a
total of 23 fully fledged public universities and 10 constituent colleges.
Not forgetting the private universities which emerged in the 1980’s and 1990’s, a
majority being religiously controlled with the exception of USIU (United States
International University). The private universities have increased tremendously over
the last three decades to have 17 Chattered universities, 5 constituent colleges, 14
institutions with Letter of interim authority and 1 registered private institution
9
Commission for Higher Education (CHE) was established in 1995 under the
provisions of the Universities Act. This commission was later on replaced by The
Commission for University Education (CUE). The Commission has made incredible
strides in ensuring the maintenance of standards, quality and relevance in all aspects
of university education, training and research. The Commission continues to uphold
quality assurance practices in university education.
1.1.2 History of Economic Growth in Kenya
After Kenya’s independence in the year 1963, GDP averaged at 7% that is between
the years 1964 and 1976, right before the death of the first president of Kenya Jomo
Kenyatta. However, between the years 1982 and 1990 GDP growth declined,
averaging 1-2%. Between the year 1997 and 2002, the economy grew at an average
rate of 1% per annum. In the year 2003, after Mwai Kibaki took over as president,
GDP growth quickly picked up to 2.3% in the year 2004 reaching an all time high of
7% in the year 2007. GDP growth declined to 1% in the year 2008 due to post
election violence then picked up to 2.9% in the year 2009 before averaging 5%
between the years 2009 and 2013. At that time Kenya’s GDP was US$55.1 Billion
with a Population of 44.83 Million and a per capita of US$1,229. Between the years
2013 and 2017 GDP growth averaged 5% per annum. In the year 2018, the GDP
growth averaged 5.7% in the first quarter and nearly 6.3% in the second quarter,
which is much higher compared to the first quarter of the year 2017when it grew by
4.7%. In 2019, real GDP growth continues to accelerate attaining 5.7% in the first
10
Real GDP is expected to continue to improve largely because of the continuing
expansions in the various sectors of the economy such as tourism, transport,
construction and a recover in the agricultural sector.
1.1.3 Trend of GDP and Expenditure in Higher education
This is a display of the growth rate in GDP and amount invested by the central
government in Higher education.
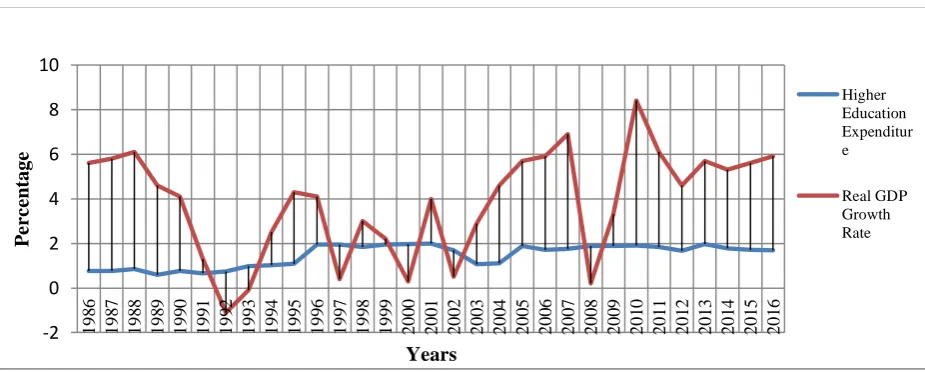
Figure 1.1: Comparison of the trend between Expenditure in higher education and GDP
Source: Various Economic Surveys
From diagram 1.1 it is observed that there is a positive correlation between
investments and GDP where the higher the GDP, the higher the investment in higher
education. This trend has been observed almost in all the years. However, there have
been a few exceptions where higher education investment is not correlated with GDP
economic growth. This can be attributed to the internal reforms within the higher
education department. There can also be observed some years with great variations
from the previous in both investment and GDP growth. Some of the notable years can
be explained as follows. In 2009/2010 there was a spike in higher education
11
investment. This was attributed to an expansion of capacity among the existing public
universities. This expansion had to do with opening new constituent colleges and
campuses. In 2011/2012 there was a drastic increase in the expenditure on higher
education from the previous year. This was attributed to the increase in development
expenditure because of the expected double intake by the universities later in the year.
In 2004 to 2005, an increase in GDP growth rate was observed; this was contributed
by the stabilization of the Kenyan currency after the new political regime took over.
There were extensive reforms coupled by the empowering of regulatory bodies like
the Central Bank of Kenya, the Capital Markets Authority, the Insurance Regulatory
Authority among others has given rise to a vibrant private sector and also the
economy was boosted by both foreign and local investments as the climate was
becoming favourable. In 2007 to 2009 there was a decrease In the GDP growth rate
due to the elections and violence that followed thereafter, affecting significant
development and economic growth.
1.2Statement of the problem
Higher education investment has been at the centre of government policy since
independence with a commitment to fight ignorance set as a key goal of independent
Kenya. Subsequent decades saw the establishment of the first university in Kenya
raising the number to 7 in three decades. By the year 2000, about 50,000 people
enrolled in higher education institutions, a number that increased rapidly to 100,000
enrollments in 2010. According to the country’s blueprint, vision 2030, Kenya aims
at becoming a prosperous middle-income country centred on developing its human
12
plans, the government has increased spending on higher education to nearly 100
billion Kenya Shillings, targeting over 200,000 beneficiaries. This has led to increased
student intake through expansion of existing universities, upgrading constituent
colleges to universities totaling to more than 40 fully fledged Universities in Kenya
(KIPPRA, 2017).
The widespread consensus that higher education is a major driver of economic
competitiveness in an increasingly knowledge-driven global economy has made
quality university education the most esteemed factor of production in recent times
(Ojiambo, 2009). Thus, the massive expenditure by the government on higher
education is expected to have significant impacts on the economic performance. The growth of the country’s economy started at -0.3 in 2001 to 7% in 2007 then looped to
1.7% in 2008 after the violence following the disputed elections. In the following 8
years, the country’s economic growth has oscillated between 4.7 and 6.2%. Despite
the rise in human capital development through investing in higher education, it is not
clear whether huge investment in the sector by the government has a bearing on
growth. Education improves the quality and efficiency of labour (Kapur and Crowley,
2008), thus the increased output of graduates from the university is expected to impact
on growth either directly or through other mechanisms.
Many Studies on the phenomenon have analyzed the effect of government
expenditure in the entire education system that is the relative elasticity of government
expenditure in primary, secondary and tertiary level (Ojiambo, 2009; Mutiso et al.,
2015) and how government expenditure on a multitude of factors in human
13
However, few studies have been carried out to measure the direct relationship of
government expenditure on higher education and economic growth. Such is a study
like ‘The Impact of Human Capital on Economic Growth in Sri Lanka’ (Rathnayaka
and Athukorala, 2012), a research that studied the impact of expenditure on different
levels of education on economic growth, this included higher education as a level of
education.
While some of these studies may suffer from methodological weaknesses (Thuku and
Maingiet al, 2013), they also fail to measure the causality and direction of causality
thus yielding varied inconclusive results. In order to bridge this gap and yield results
that can lead to more targeted policy recommendations on higher education
expenditure, this study aimed at assessing how government expenditure in higher
education affects the performance of the economy and causal relationship between the
two variables.
1.3Research Questions
i. What is the relationship between government expenditure on higher
education and economic growth in Kenya?
ii. What is the causality and direction between government expenditure on
Higher education and economic growth in Kenya?
1.4 Objectives of the study General objective
The main objective of the study was to determine the relationship of government
14 Specific Objectives
i. To assess the relationship between government expenditure on higher
education and economic growth in Kenya.
ii. To establish the causality and direction between government expenditure on
higher education and economic growth in Kenya
1.5 Significance of Study
The study generated insights into the relationship between expenditure in higher
education and economic growth in Kenya.
The results of the study are useful in giving proper policy recommendation regarding
government investment in higher education in Kenya. The study added knowledge to
the existing literature on the same. Finally, the study sought to bridge the knowledge
gap in that area of study and also invoke more research to be undertaken.
1.6 Scope of the study
This study was limited to the periods of 1986 to 2016since this period was
characterized by a substantial increase of higher education recipients, and because
time series data for expenditure in higher education is available for this period of
time. The research project also looked at the causality and direction of higher
education expenditure in Kenya and economic growth over the said span of years. The
research project was divided into five chapters. Chapter one introduces the study and
its objectives. Chapter two presents the theoretical and empirical literature. Chapter
three focused on research design and methodology. Empirical results are presented
and discussed in chapter four while the summary, conclusions and policy implication
15
CHAPTER TWO LITERATURE REVIEW 2.1 Introduction
This section reviews the literature on the works done by various aspects on higher
education investment and economic growth. The chapter includes a review of the
theoretical and empirical literature on higher education and economic growth.
2.2 Theoretical Literature 2.2.1 Education
Education is an essential tool that will lead a country to dynamic advancement and
sustainability of human capital. An economist Gary Becker, a Nobel Laurent once
emphasized the role of education as the key to development of the human capital. In
this day and age, knowledge and skills are paramount for progress.
Mincer (1981) hypothesized that similarly as collection in individual human capital
produces individual financial development (salary), the equivalent applies for social
benefits. Human capital is a factor of production which works hand in hand with
physical capital. Human capital is acquired through several ways, such as informal
and formal education and on the job training through training, work experience
mobility of labour not forgetting knowledge and vocational training. Researchers and
other economists have conducted a statistical study on the cost of education and its
returns. The study concluded that employers tend to pay educated employees higher
wages as opposed to their less-educated workers, this is because of their ability to
16
Ashton and Green (1996) postulated that with no doubt education brings about
economic success. They argued that there is great competition worldwide when it
comes to modern technology which is basically Knowledge-based. Their discussion
was based on how education and training can be improved so as to attract prosperity.
Becker, Mincer and Schultz (1970) contended that investment in education and
training develops a supply of knowledge and skills (as capital) in the populace that
can profit national economies and fuel monetary development. Numerous others have
stressed the significance of investment in human capital as a basic determinant of
long-haul economic growth.
Harbison (1987) adds to the contention by affirming that human capital is the main
source of wealth and prosperity in a country. He depicted physical capital and other
tools of production as passive and human beings as the ultimate factor of production
who uses the passive factors of production to build economic and political
organizations to enhance national development.
2.2.2Human Capital expenditure by Schultz (1961)
This is the hypothesis of human capital investment as proposed by Schultz (1961)
who contends that both knowledge and skill are a type of capital and that this capital
is a result of "intentional investment." Schultz speaks of how Western nations have
increased their national yield as a result of investment in human capital. He
additionally makes a connection between an increase in human capital and the general
17
This theory has three sections, the first one deals with ‘shying Away from Investment
in Man’. It argues that economists for a long time now have been afraid to refer to
human beings as capital. Schultz whole concept has been based on investing in
people. With education and training, he suggests that many opportunities are opened
up, most of which would not have been realized if not for education. He compares acquisition of education with acquiring a ‘means of production’ as it introduces a new
method of production which was otherwise not there, to begin with. With education,
workers can be in charge of their productivity and earnings due to the acquisition of
skill and knowledge.
The second section deals with Economic Growth from Human Capital. Schultz argues
that the observed differences in earnings between individuals are as a result of the
differences in access of education and health. He gave an example of
African-American Children who venture out to look for employment. They come across a
barrier resulting from lack of human capital that is they have no sufficient education
and training to get the desired employment. This kind of barrier will be experienced
mostly in underdeveloped countries of marginalized communities where food and
shelter is a major concern and therefore short-term investments are made to cater to
for these basic needs. In developed societies where acquiring basic needs is not a
problem they lean towards long-term investments, like education, health and
migration (assisting refugees to resettle and find employment by offering them an
opportunity to learn and improve their skills). In the long-run, these investments will
18
The third section deals with 'Scope and Substance of These Investments'. Schultz
contends that as individuals invest in human capital; their primary aim must be on acquisition of relevant skill set that will contribute in one’s ability to be efficient in
production. He strongly believes that any enhancement in human capital leads to
increased profitability. He argues that in as much as cost will be incurred in the
investment process (school fees, lack of income while in school etc) in the long-run,
the returns will greatly outweigh the cost.
2.2.3 O-Ring theory
Kremer (1993) hypothesized the O-ring hypothesis of economic improvement, a
model of economic advancement. The hypothesis suggests that in order for work to be
of high and significant quality, tasks must be executed proficiently together. The key
component of this model is positive assortative coordinating, whereby individuals
with comparative expertise levels work together. The name originates from the 1986
Challenger carry fiasco, a calamity caused by the disappointment of a solitary O-ring.
Kremer believes that the O-ring hypothesis clarifies why rich nations create more
entangled items, have bigger firms and significantly higher labourer profitability than
poor nations.
There are five noteworthy suppositions of this model: firms are hazard unbiased, work
markets are aggressive, specialists supply work flexibly, labourers are imperfect
substitutes for each other, and there are adequate complementarities of assignments.
Production is separated into 'n' undertakings. Workers can utilize a huge number of
19
interpretation. It could mean the likelihood of a worker effectively finishing a task,
the quality of task completion expressed as a percentage, or the quality of task
completion with a margin of error that could reduce quality. The output is determined
by multiplying the q values of every one of the n tasks and then multiplying this
outcome by another term (suppose, D) representing the individual attributes of the
firm. Below is the production function.
qiqj qiqjDF ...2.1
Here we see a four-person economy with two lowly skilled workers (qL) and two
highly skilled workers (qH)
Below equation indicates the productive efficiency of skill matching:
L H L
H q q q
q 2 22 ...2.2
By this equation, total product is maximized by pairing those with similar skill levels.
Jones (2013) expounds upon Kremer's O-ring hypothesis to clarify why differences in
laborer skills are linked to the huge variances in productivity levels despite causing
unexceptional differences in wages within a nation. For this reason, he distinguishes
between O-ring occupations, employments including high vital complementarities
regarding aptitude and foolproof occupations; employments portrayed by diminishing
returns to labour and expect both technologies to be accessible to all nations. He at
that point proceeds to demonstrate that little global variances in worker skills per
20
2.2.4 Estimating the Private Return to Schooling: The Mincer model.
The Mincer model was proposed by Jacob Mincer in 1974 by demonstrating that "if
the main expense of going to class an extra year is the cost of understudies time, and
if the corresponding increment in profit caused by this extra year is steady after some
time, at that point the log of income would be directly identified with person's long
periods of schooling"(Kruegel and Lindahl, 2001).
He acknowledges on-the-job experience also enhance productivity and therefore
wages, and hence below Mincerian equation:
……….2.3
Where Wi represents individual’s wage, Si the level of schooling and Xi the years in
the labour market (experience) and εia disturbance term. This equation has become
one of the most used regression models in economic literature. Psacharapoulous
(1994, 2004) calculated these estimates for several countries, in order to compare the
results. He concluded that the Micerian regression adjusts quite well the data and that
the correlation between a return to schooling and GDP per capita in a given country is
negative and statistically significant.
In this condition, β1 is the key variable to consider and relates to the gain in log wage
for an individual that opts for an extra year of schooling as opposed to going straight
to work.
i i
i
i S X B X
W01 2 3 2
21
Broadly, these estimates go from 0.05 to 0.15, with somewhat bigger estimates for
ladies than for men (Kruegel and Lindahl, 2001).
2.2.5 Endogenous Growth theory
Endogenous growth theory brings out the idea that, economic growth is as a result of
endogenous and not external forces. Endogenous growth theory holds that investment
in the human resource, technological advancement, and information contributes
towards economic growth. The theory also centers on positive externalities and
overflow impacts of a knowledge-based economy which will prompt economic
growth. The theory essentially holds that the long-run growth rate of an economy
relies upon policy measures, for instance, subsidies for innovative work.
In the mid-1980s, a group of economists scholars were dissatisfied with the consensus
that exogenous elements determined long-run growth. They supported a model that
displaced the model with unexplained technical progress with a model in which the
key determinants of growth were in the model. Research by Kenneth Arrow (1962),
Hirofumi Uzawa (1965), and Miguel Sidrauski (1967) formed the basis for this study.
Paul Romer (1986) together with several other economists did away with
technological change and supported that growth in these models is because of
unlimited investment in human capital which had an overflow impact on the economy
and reduces the diminishing return to capital accumulation.
The AK model, the least difficult endogenous model, gives a steady-savings rate of
endogenous growth. It shows technological progress with a solitary parameter
22
diminishing returns to scale to lead to endogenous growth. Various reasons for this
supposition have been given, for example, positive overflows from capital investment
to the economy as a whole or upgrades in innovation prompting further enhancements
(learning by doing). In any case, the endogenous growth theory is additionally upheld
by models in which optimally determined the consumption and saving, optimizing the
resources allocation to research and development leading to technological progress.
There are a number of other literary works on education, and human capital, some of
the works were by; Nelson and Phelps (1966) argued that a more educated labour
force would mimic frontier technology faster.
A state that is further away from the frontier stands to benefit more from catching up.
Benhabib and Spiegal (1994) added that a more educated labour force would also
innovate faster.
Acemoglu, Aghion, and Zilibotti (2003) gave a clarification to why higher education
may be more growth-enhancing in some states than in others. They gave an example;
in states where exceptionally educated people make up an expansive share of the
workforce, the states get more growth out of investing in higher education as opposed
to states in which highly educated workers make up only a small share. In both
developed and developing countries, education advancements have been recognised
as essential in enhancing growth.
Several theories have been advanced to emphasise the role of human capital and the
23
highlighting a link between human capital and economic growth are augmented
Solow neo-classical approach and the new growth theories.
2.3 Empirical Literature
Empirical studies have been undertaken in order to support this theoretical premise.
Most of these studies focus on education and economic growth. Very few research
studies have specifically looked into the relationship between higher education and
economic growth. We shall look at the empirical literature available for education and
economic growth and higher education and economic growth.
Machuki et, al (2013) researched on the relationship between human capital (as
proxied by capital expenditures on education and health) and economic growth in
Kenya (1981-2011). He used the Ordinary Least Square multiple regression analytical
method to examine the relationship between capital expenditures on education,
healthcare and economic growth. The results showed a positive relationship between
health expenditures and economic growth; while showing a significant but negative
relationship between education expenditures and economic growth. The results can be
influenced by the estimation method used in this case (OLS), that is its advantages
and disadvantages when compared to other estimation methods and the selected years
of study. This study however covered expenditure on entire education system and not
expenditure on higher education only, hence the research gap addressed in this
research study.
Rathnayaka and Athukorala (2012) took up a research study to identify the impact of
24
Capital on economic growth in Sri Lanka. The study also examined how different
skill levels in human capital that is Primary, Secondary and higher education affect
economic growth. For the econometric estimation, Vector Error Correction Model
(VECM) was employed.
The results of the VECM showed that the short-run impact of both government
expenditure on university education and general education are significant, however,
the magnitude of the coefficient of general education is greater than the university
education. The difference between this research and the research in question is the
country of origin, hence the specific data used. Therefore this necessitates a research
study to be undertaken for the case of Kenya.
The causality between government expenditure on education and economic growth in
Malaysian economy was studied by Hussin, Muhammad and Razak (2012) using time
series data from 1970 to 2010 and applying Vector Auto Regression (VAR)
technique. The results showed that education expenditure had Granger-Causality with
GDP. They also found out that economic growth cointegrated with fixed capital
formation, labour, labour force participation and government expenditure on
education and would to a greater extent influence long-run economic growth. Apart
from the varying data due to the country of origin and time frame selected, this study
used entire education expenditure as opposed to higher education expenditure which
is used in this research study, which leaves a gap to be filled by the results of this
research study.
Sianesi and Van Reeenen (2003) undertook a survey on the relationship between
25
developing countries. The model of choice was the Solow model and growth
accounting. The results indicated that human capital increases productivity,
suggesting that education is productivity enhancing, and not merely a device used by
individuals to signal their ability to potential employers. The survey results suggest
that a one year increase in average education raises the level of output per capita by
between three and six percent, or raise the rate of potential growth by just over one
percentage annually depending on the model adopted. The study focused on education
as a whole and variable of choice to represent human capital in the production
function was number of years in schooling as opposed to capital injected in higher
education.
Lau, Jamison, and Louat (1990) estimated an aggregate production function relating
real GDP to capital stock, labour force, land and average education of the labour force
based on data for 58 developing countries. They found positive and statistically
significant estimates for the elasticities of output with respect to average education. In
their study, sub-Saharan Africa had the lowest elasticity - of 0.03 – followed by the
Middle East and North Africa. Barro and Sala-i-Martin (1995). This study majored on
the average education of a particular labour force in various developing countries as
opposed to this study which looks at expenditure geared into developing human
capital in Kenya.
2.4 Overview of Literature
Theoretical literature has shown that education is central to economic growth as it
enhances labour productivity and shapes production trajectories through pushing for
26
investment in education is imperative in building the stock of skills and abilities
essential in economic growth in that education and training systems improves per
capita productivity and efficiency in production (Mincer, 1981; Ashton and Green,
1996). Considering human capital as a means of production, investing in its
development imparting skills will not only strengthen the economy but also improve people’s standards of living (Schultz, 1961). Kremer O-ring theory through
assortative matching shows the variation in income and income inequalities per
country is linked to skills difference. However, Mincer model introduces the skills
gained in the job market and empirical verification have shown that there is a more
significant contribution to labour efficiency by one year spent in on job learning than
return to school. Endogenous growth theory shows that investment in human capital
creates positive spillover and this only varies with the type of investment from
subsidies, research and development and innovation.
On the other hand, empirical studies have measured the productivity of human capital
(Sianesi and Van Reeenen 2003), return on investment (Hussin, Muhammad and
Razak, 2012) by measuring expenditure on education, average school years (Barro
and Sala-i-Martin, 1995), elasticity of output with respect to average education (Lau,
Jamison, and Louat 1990) and relative impact of investment in education and health
(Machukiet al., 2013). These studies have shown that education and development of
human capital have positive impacts on personal productivity and economic growth
through enhancing efficiency with an exception of the research study by Machuki et
al., 2013 observed that investment in health has significantly positive impacts on
27
citing anomalies in the sector in Kenya. Barro and Sala-i-Martin (1995) also observes
that investment in education has varied impacts depending on the level; particularly
primary level has negative impacts on economic growth
Having reviewed several empirical works on education and economic growth, we
have learned a great deal from them. The studies tend to differ from this research
study in question in a number of ways such as country of origin of the research study,
variables used to represent human capital like number of years used in education, the
model employed in the study and econometric analysis method used. Majority of the
studies however only focus on education as a whole and not higher education, and the
ones that do, do not apply to Kenya. These studies have therefore gone a great length
to expose the necessity of conducting this research study of relationship between
higher education expenditure and economic growth in Kenya, with Higher education
expenditure representing human capital in the augmented Solow Model. We are
however also persuaded by the argument of Bils and Klenow (2000) that existing
studies tend to establish correlation, but tend not to establish causation and the
28
CHAPTER THREE
RESEARCH DESIGN AND METHODOLOGY 3.1 Introduction
This chapter specifies the model and the methodology used to examine the
relationship between higher education expenditure and economic growth in Kenya.
It's followed by an explanation of variables used, sources of the data and the
diagnostic tests employed in the study.
3.2 Research Design
This research sought to unravel the relationship between higher education expenditure
and economic growth in Kenya. The research study is a non-experimental time series
study. The research used data study recorded between the years 1986 and 2016. The
collected data was analysed using Vector Error Correction Method (VECM) after
undergoing time series diagnostic tests. Time series analysis was adopted in this study
because of the sample size selected. VECM was used in analysis because it allows for
analysis and interpretation of short and long run relationships and also allows for
causality tests.
3.3 Theoretical Framework
3.3.1 The human-capital augmented Solow model
The study adopted the human-capital augmented Solow model as postulated by
Mankiw, Romer and Weil (1992). They presented Solow’s (1956) model of economic
growth augmented to include human capital investment as a separate input into a
standard Cobb-Douglas production function. Augmented Solow model estimated two
specifications. The first specification assumes that the economy is in steady state and
29
1t L t A t H t K t Y ………3.1
Where Y is output, A is technology, K is physical capital, H is human capital, and L is
labour.
The parameters α and β are the output elasticities with respect to physical and human
capital (shares of physical and human capital in total income), respectively. Mankiw,
Romer and Weil (1992) extended the Solow dynamics of physical capital
accumulation to human capital.
Thus the dynamics of growth takes the form:
t skYt
K
tK ) ……….3.2
t nL
tL ……….3.3
t gA
tA ………...…………3.4
t shY
t H
tH ………...…..3.5
Where sk and sh denote the fraction of devoted income to the accumulation of,
respectively, physical and human capital, n is the rate of growth of labour, g is technological progress, and δ is the rate of depreciation. Assuming the existence of a
steady state with α + β < 1, Mankiw, Romer and Weil (1992) obtained the following
steady-state estimable version of the model:
………3.6
The equation above provides the basic framework for testing the augmented Solow
model. The model predicts that the steady-state level of income per capita is
A
gt
n g
sk
Sh30
positively affected by investment in both physical and human capital and negatively
affected by population growth, depreciation, and exogenous technological progress,
and requires that the second specification of the augmented Solow model relaxes the
assumption that the economy is in steady state.
Letting y* be the steady-state level of income per effective worker and y(t) the actual
value at time t. Mankiw, Romer and Weil (1992) showed that the speed of
convergence can be obtained by linear approximation around the steady state:
t y y t t y ln * lnln
………3.7
Where
ng 1
The first-order differential equation above implies that
yt 1 e
ln
y* e ln
y
0Ln t t
Where y(0) is income per effective worker at some initial point in time.
1 ln
0
………...………3.8 ln 1 1 ln 1 1 ln 1 1 0 ln ln y e S e sk e g n e y t t t h t t t Since income per effective worker y (t) is not observable, Mankiw, Romer and Weil
(1992) expressed equation above in terms of income per capita and obtained the
31
...3.9 0 0 ln 1 ln 1 ln 1 1 ln 1 1 0 ln 1 0 0 ln ln L Y e sh sk e g n e gt A e L Y Y L t t t t t t Solow growth model predicts conditional convergence, i.e. convergence to a steady
state that may differ across countries. Thus, the finding that the parameter estimate of
0 0 ln L YY is significantly less than zero, which implies; λ> 0, provides additional evidence in
favour of the augmented Solow model
Mankiw, Romer and Weil made three other important assumptions;
1. Investment in human capital is the same as investment in physical capital, as
individuals forego consumption to redirect their income to human capital
accumulation.(comparable to the fraction sK invested in physical capital)
2. Human Capital and physical capital depreciates at the same constant rate δ.
3. Output produced in an economy can be used for either consumption or
investment in (physical or human) capital.
From equation 3.9, we get the model specification
LnY = α + β1 (EDUEXP) + β2(LFPR) + β3(GFCF) + μi
Where:
Y = Real GDP
EDUEXP = Higher education expenditure
LFPR = Labor Force Participation Rate
32
3.4 Empirical Models, Models Specification and Estimation 3.4.1 Pre Estimation Tests
Both linear and non-linear specifications of the functional relationship in the equation
were estimated using time series data for the period 1986-2016. Time-series data
usually exhibits non-stationarity (has both time and variable specific variant) and if
the OLS method is applied directly, the results would be spurious. Because of this,
diagnostic tests were done before the model is fitted using Vector Error Correction
Model.
3.4.1.1 Unit Root Test
Unit root test was the first diagnostic procedure done on the properties of the data and
aimed at testing for stationarity. The test is important and helps in avoiding spurious
regression problem as most standard econometric procedures require time series tests
to be stationary. This study required some order of stationarity for the time series data,
as this is a prerequisite in cointegration analysis and Granger causality version
VECM.
The study used the Augmented Dickey-Fuller (ADF) and Philip Peron (PP) tests to
test the unit root in the data.
s
Y
Y
Y
i t tp
i t
t
11 1
2
………3.10
Where Y is the choice variable; ∆ is the first difference operator; αi (for i = 1&2) and
33
Based on the Vector Auto regression, appropriate lag length selection is important in
order to assure the research findings reflect the real economic situation and
importantly the findings are consistent with economic as well as econometric theories.
Akaike Information Criteria (AIC) was used to choose the lags in this study to
determine the order of integration of a particular series, the equation has to be
modified and include the second difference on lagged first and p lags of second
differences as follows
i t tp
i t
t
Y
Y
Y
12 1
1 1 2
………3.11
Where ∆2is the second difference operator; Ѳ1and Ѳiare constant parameters; and ξtis
a stationary stochastic process. Due to the inclusion of difference lagged term i.e. ‘p’
the error terms (stand ξt) in the respective equations are serially independent. To test
stationary, the augmented Dickey Fuller (ADF) [Dickey and Fuller, 1891] and
Phillips and Perron (1988) tests were applied to equations 1 and 2. The null
hypotheses are H0: α2 = 0 against H0: α2≠ 0 and H0: Ѳ1= 0 against H0: Ѳ1≠ 0
respectively which signifies non-stationarity of both Yt-1 andΔYt-1.
3.4.1.2 Cointegration
After testing for stationarity, the next step was to test for cointegration to assess the
long- run linkages among study variables. The premises behind cointegration is that
there exists a vector whose linear combination with variables of I(d) make such
variables I(0) thus stationary or co-integrated, or possess a long run (equilibrium)
relationship. This study employed Johansen Maximum likelihood test to check for
cointegration. Whether the variables are co-integrated or not, using the Johansen (1991,
34
incorporates a parametric correction for serial correlation. This means that the
estimates are robust to simultaneity bias, and it is robust to departure from normality
(Johansen, 1995). Johansen method detects a number of co-integrating vectors in
non-stationary time series and will therefore be used to determine the rank r and to
identify a long-run relationship of Investment in higher education (EDUEXP) and
Real Gross Domestic Product (RGDP)
3.4.2 Vector Error Corrección Model (VECM)
The Granger representation theorem (Granger, 1988) states that if two variables (say
Gross Domestic Product (GDPt) and Education Expenditure (EEt)) are co-integrated and
each is individually I (1), then neitherY1tGrangercausesY2tor Y2tto Y1t.. Therefore,
Vector Error Correction Model (VECM) captures the dynamics of both short-run and
long-run causality of the variables. The model is expressed as follows;
C
EC
RGDP
RGDP
ht th r h k t j n k k t k n k
t , 1 1
, 1 1 , 2 , 12 1 1 , 1 , 11 1 1 1
1
EDUEXP
………...3.12 13 . 3 ... ... ... ... ... ... ... ... ... 2 1 , , 1 1 , 2 , 22 1 1 , 21 , 21 1 1 2 2EDUEXP
EDUEXP
C
EC
RGDP
t t h h r h k t j n k k t k n k t
Where, ECh,t−1is the hth error correction term, the residuals from the hth cointegration
equation, lagged one period, and αij,k describes the effect of the kth lagged value of
variable j on the current value of variable of i: I,j = GDP1 , EDUEXP . VECM