Available online:
https://pen2print.org/index.php/ijr/
P a g e | 1122
Network Intrusion Detection Using Machine Learning
Techniques
Sayi sruthi.k & Liston Deva Glindis
Master of Engineering Computer Science Engineering Dhanalakshmi Srinivasan College of Engineering, Coimbatore
Assistant Professor Dhanalakshmi Srinivasan College of Engineering, Coimbatore
ABSTRACT Network traffic anomaly indicates a possible intrusion in the network and therefore
anomaly detection is important to detect and prevent
the security attacks. The early research works in this
area and commercially available in Intrusion
Detection Systems (IDS) they are mostly
signature-based. The problem of signature based method is that
the database signature needs to be updated as new
attack signatures become available and therefore it is
not suitable for the real-time network anomaly
detection. The recent trend in anomaly detection is
based on machine learning classification techniques.
We apply seven different machine learning
techniques with information entropy calculation to
Kyoto 2006+ data set and evaluate the performance
of these techniques. Our findings show that, for this
particular data set, most machine learning
techniques provide higher than 90% precision, recall
and accuracy. However, using area under the
Receiver Operating Curve (ROC) metric, we find that
Radial Basis Function (RBF) performs the best
among the seven algorithms studied in this work.
Keywords— Kyoto 2006+ data set ,Accuracy, precision ,Recall , ROC metrics
I.INTRODUCTION
The usage of network is changing at a very fast rate.
The amount of network traffic volume is also rapidly
increasing. Monitoring network traffic for anomaly
detection is not a new concept as there are many types
of attacks besides the virus and malware. Those
attacks can impact not only the host computers, but
also the network performance significantly, or in the
worst case scenario, it can completely stop some
network services. The early research work on the
anomaly detection was mostly signature-based. The
problem of signature based method is that the
database signature needs to be updated as the new
signatures become available and therefore it is not
suitable for the real-time network anomaly detection.
Thus, more investigations on the network traffic
anomaly detection using advanced machine learning
classification techniques are required to detect new
type of anomalies. Machine learning is becoming
popular in recent years. This is due to the emergence
of many new computing technologies as well as
availability of more data. Although the machine
learning techniques have been around for a long time,
finding a way to use them efficiently and in real time
is a new trend. As mentioned earlier, using machine
learning techniques to detect intrusion has been
researched by many people. However, to the best of
Available online:
https://pen2print.org/index.php/ijr/
P a g e | 1123
detection do not have these methods implemented;
today the existing methods are signature based. In
addition, among the various methods attempted by
the researchers it is not well established what
methods are more suitable for this application.
Further, there needs to be evaluated using a common
benchmark data for comparing various techniques. In
this paper, we use seven techniques on a well-known
data set (Kyoto 2006+) [21-22] and evaluate the
performance of those machine learning techniques in
terms of accuracy, recall, and precision. The seven
techniques adopted are: K- Means, K-Nearest
Neighbors (KNN), Fuzzy C-Means (FCM), Support
Vector Machine (SVM), Naïve-Bayes (NB), Radial
Basis Function (RBF) and Ensemble method
comprising of the above mentioned six algorithms.
These algorithms are all evaluated first using three
well-known metrics called (i) precision, (ii) recall
and (iii) accuracy and next using the ROC metric. We
find the ROC metric is more suitable for ranking the
results of the algorithms.
II.LITERATURE SURVEY
There are several projects undertaken and various
methods proposed for network intrusion detection.
Various technologies has been used to implement this
to keep our network secure. Following are the few
papers which propose the idea about network anomaly
detection using machine learning classifiers
1) Anomaly Detection based on Machine Learning: Dimensionality Reduction using PCA and Classification using SVM AUTHORS: Annie George In this Anomaly detection has emerged as an
important technique in many application areas mainly
for network security. Anomaly detection based on
machine learning algorithms considered as the
classification problem on the network data has been
presented here. Dimensionality reduction and
classification algorithms are explored and evaluated
using KDD99 dataset for network IDS. Principal
Component Analysis for dimensionality reduction and
Support Vector Machine for classification have been
considered for the application on network data and the
results are analyses. The result shows the decrease in
execution time for the classification as we reduce the
dimension of the input data and also the precision and
recall parameter values of the classification algorithm
shows that the SVM with PCA method is more
accurate as the number of misclassification decreases.
2)A data mining framework for building intrusion detectionmodelAUTHORS:W.K.Lee,S.J.Stolfo According to him there is often need to update an
installed intrusion detection system (IDS) due to new
attack methods or upgraded computing environments.
There are many current IDSs which is constructed by
using manual encoding of expert knowledge, changes
to these IDSs are expensive and slow. We describe a
data mining framework for adaptively building
Intrusion Detection (ID) models. The central idea is
to utilize auditing programs to extract an extensive
set of features that describe each network connection
or host session, and apply data mining programs to
learn rules that accurately capture the behavior of
intrusions and normal activities. These rules can then
be used for misuse detection and anomaly detection.
New detection models are incorporated into an
existing IDS through a meta-learning (or co-operative
learning) process, which produces a meta detection
Available online:
https://pen2print.org/index.php/ijr/
P a g e | 1124
We discuss the strengths of our data mining
programs, namely, classification, meta-learning,
association rules, and frequent episodes. We report
on the results of applying these programs to the
extensively gathered network audit data for the 1998
DARPA Intrusion Detection Evaluation Program
3)A Review of Anomaly based Intrusion Detection Systems AUTHORS: V. Jyothsna, V. V. Rama Prasad, K. Munivara Prasad With the advent of
anomaly-based intrusion detection systems, many
approaches and techniques have been developed to
track novel attacks on the systems. High detection
rate of 98% at a low alarm rate of 1% can be
achieved by using these techniques. Though
anomaly-based approaches are efficient,
signature-based detection is preferred for mainstream
implementation of intrusion detection systems. As a
variety of anomaly detection techniques were
suggested, it is difficult to compare the strengths,
weaknesses of these methods. The reason why
industries don’t favor the anomaly-based intrusion
detection methods can be well understood by
validating the efficiencies of the all the methods. To
investigate this issue, the current state of the
experiment practice in the field of anomaly-based
intrusion detection is reviewed and survey recent
studies in this. This paper contains summarization
study and identification of the drawbacks of formerly
surveyed works.
4) Research of Intrusion Detection based on Principal Components Analysis
AUTHORS: CHEN Bo, Ma Wu, It is the effective way of improving the efficiency of intrusion
detection is to reduce the heavy data process
workload. In this paper, the dimensionality reduction
technology is used in the classic dimensionality
reduction algorithm principal component to analysis
large-scale data source for reduced-made features of
the original data to be retained and improved the
efficiency of intrusion detection. And also they use
BP neural network training data after dimensionality
reduction, this method will be effective in normal and
abnormal data distinction, and it achieved good
results.
5) Solving multiclass learning problems via error-correcting output codes AUTHORS: G.Dietterich, G.Bakiri In this paper they recommended that
Multiclass learning problems involve finding a
definition for an unknown function f(x) whose range
is a discrete set containing k > 2 values (i.e., k
"classes"). The definition is acquired by studying
collections of training examples of the form (xi,
f(xi)). Existing approaches to multiclass learning
problems include direct application of multiclass
algorithms such as the decision-tree algorithms C4.5
and CART, application of binary concept learning
algorithms to learn individual binary functions for
each of the k classes, and application of binary
concept learning algorithms with distributed output
representations. In this paper they compares these
three approaches to a new technique in which
error-correcting codes are employed as a distributed output
representation. We show that these output
representations improve the generalization
performance of both C4.5 and back propagation on a
wide range of multiclass learning tasks. We also
Available online:
https://pen2print.org/index.php/ijr/
P a g e | 1125
to changes in the size of the training sample, the
assignment of distributed representations to particular
classes, and the application of over fitting avoidance
techniques such as decision-tree pruning. Finally, we
show that--like the other methods--the
error-correcting code technique can provide reliable class
probability estimates. Taken together, these results
demonstrate that error-correcting output codes
provide a general-purpose method for improving the
performance of inductive learning programs on
multiclass problems.
III.WORKING PRINCIPLE
1.K-Means algorithm: Wang also presented an improved K-Means algorithm to overcome the
sensitivity problem of initial center selection. The
basic idea was to choose the initial centers as
decentralized as possible. The K-Means improved
algorithm was applied on KDD Cup 1999 data set.
2.clustering algorithm Hu et al proposed to solve the problem of high false positive in network
intrusion detection system using clustering algorithm.
They attempted two clustering algorithms namely
K-Means and Fuzzy C K-Means. DARPA 2000 and
LLDOS data set are used for the validation of the
algorithm. The Fuzzy C Means algorithm worked
better than K-Means.
3.KNearestNeighbor(KNN)algorithmGovindarajan and Chandrasekhar proposed an improved K Nearest
Neighbor (KNN) algorithm for network anomaly
detection application. Their proposed algorithm
yields a reduction of the run time by up to 0.01 % and
0.06 % while error rates are lowered by up to 0.002
% and 0.03 % for normal and abnormal behavior
respectively.
4.C-Means clustering algorithmRen et al put forward Fuzzy C-Means clustering algorithm for
intrusion detection. The algorithm was applied on six
different subsets of KDD Cup 1999 data set with
5000 records each. The detection rate varies between
50.3% and 90.5% whereas the false positive rate
ranges between 0.2% and 4.1%.
5. SVMalgorithm ZhuandLia put forward the SVM algorithm for intrusion detection based on space
blocks and sample density. Their main contribution
lies in developing an algorithm to reduce the sample
size and thereby the learning speed. The SVM model
works on the reduce sample set. The authors selected
100,000 records from DARPA data set and used
Radial Basis Function (RBF) as the kernel function
for the SVM. This improved SVM works with better
accuracy and learning speed than the traditional SVM
algorithm.
IV.EXISTING SYSTEM
The early research work was on the anomaly
detection was mostly signature-based.NSL-KDD data
set where used for the evaluation of clustering
algorithms. In network anomaly detection .Network
anomaly detection technique using entropy metrics
was proposed and it was compared with the results
obtained using volume metric .Wang introduce An
improved K-means clustering algorithm based on
information entropy and frequency sensitive
Available online:
https://pen2print.org/index.php/ijr/
P a g e | 1126
detection was used based on space block and sample
density. Their main contribution lies in developing an
algorithm to reduce the sample size and thereby the
learning speed.A SVM model for intrusion detection
was proposed to use short sequence data and label
them as anomaly or normal using SVM model. The
SVM based model can be used to detect data
accurately, reduce miss probability and can be
effectively used for real-time intrusion detection.And
also four different types of neural network models for
probe attack detection was used to secure our
network from attacks.
V.DRAWBACK OF THE EXISTING SYSTEM
The problem of signature based method is that the
database of signature needs to be updated as the new
signatures become available and therefore it is not
suitable for the real-time network anomaly detection.
Major issues in intrusion detection research is to find
good labelled data sets which contain representatives
of different types of intrusion and normal traffic
data.KDD’99 data set contains anomaly labels and
descriptions. The two major drawbacks are: (i) the
data set is more than ten years old and therefore does
not reflect current threats(ii) even though there are 41
features describing a flow, the most common
descriptors, such as source port, are omitted.
VI.PROPOSING SYSTEM
Here in this paper the whole framework of the new
approach are mentioned. Then we discuss the four
main modules, i.e., k-means clustering
module,neuro-fizzzy training module, SVM training vector module,
and radial-SVM classification module. The proposed
intrusion detection technique initially clusters the
given training data set by using k-means clustering
technique into k-clusters, where 'k' is the number of
desired clusters. In the next step, neuro-fizzzy
training is used to train 'k' neural networks, where
each of the data in a particular cluster is trained with
the respective neural network associated with each of
the cluster. Subsequently, vector for SVM
classification is generated. This vector consists of
attribute values obtained by passing each of the data
through all of the trained neuro-fuzzy classifiers, and
an additional attribute which has membership value
of each of the data. As a last step, classification is
performed by using radial SVM to detect intrusion
has happened or not. Our proposed technique comes
up with a solution where the number of attributes
defining each of the data is reduced to a small
number through a sequence of steps. This process
ultimately results in making the intrusion detection
more efficient and also yields a less complex system
with a better result. In this paper, seven techniques
are used on data set (Kyoto 2006+) and performance
of those machine learning techniques are evaluated in
terms of accuracy, recall, and precision. The seven
techniques adopted are: K-Means, K -Nearest
Neighbours (KNN), Fuzzy C-Means (FCM), Support
Vector Machine (SVM), Naïve-Bayes (NB), Radial
Basis Function (RBF) and Ensemble method
comprising of the above mentioned six algorithms.
These algorithms are all evaluated first using three
well-known metrics called (i) precision, (ii) recall
and (iii) accuracy and next using the ROC metric.
The results obtained for RBF are much better than
that of K-Nearest neighbour (KNN) ,K-Means (KM)
and Fuzzy C-Means (FCM) algorithms..Using the
Available online:
https://pen2print.org/index.php/ijr/
P a g e | 1127
recall and accuracy .Our findings show that, for this
particular data set, most machine learning techniques
provide higher than 90% precision, recall and
accuracy. Under the Receiver Operating Curve
(ROC) metric, the Radial Basis Function (RBF)
performs the best among the seven algorithms studied
in this work.
A.PROPOSED SYSTEM ARCHITECTURE
Fig. 1. PROPOSED MAIN ARCHITECTURE
VI. PROPOSED SYSTEM DATA SET AND MODULES
Unlike many research networks, which only provide
flow data or sanitized raw TCP data, each observation in KDD’99 data set contains anomaly
labels and descriptions. This data source has been
widely used in research]. While it is commonly used
in algorithm evaluation, there are two major
drawbacks: (i) the data set is more than ten years old
and therefore does not reflect current threats, and (ii)
even though there are 41 features describing a flow,
the most common descriptors, such as source port,
are omitted. To eliminate these drawbacks a new
data set for evaluation purpose called Kyoto2006+ is
used. This new data set contains 24 features - 14
features are the same as in the original KDD’99 data
set and there are 10 extra features. Six out of the 10
extra features are connection information that was
omitted in the original data set but deemed relevant
and necessary later by researchers working in this
field. Kyoto 2006+ data set is built on three years of
real traffic data collected using 348 honey pots . The
traffic data was labeled using three security software:
SNS7160 IDS, Clam Antivirus, and As hula. It is not
possible to do any type of data analysis directly using
the raw data. First it is important to preprocess the
data. The preprocessing of the data mainly has three
components: (i) Identification of data which are not
formatted properly and fix them or remove them
from the data set (ii) Identification of the normal
traffic flows and the anomalies or infected traffic
flows (iii) Calculation of entropy for each network
feature In our experiments, entropy of each traffic
feature is used before applying the machine learning
techniques. The formula shown in Equation (1) is
used to calculate the entropy from the raw data in
order to get more informative aggregated data such as
source address entropy, destination address entropy,
etc. The entropy is a highly established measure in
other applications as well as in anomaly detection
application . Entropy captures the degree of dispersal
or concentration of a distribution. For an empirical histogram X = {ni=1, 2,…,N},
meaning i occurs ni times in the sample, then the
entropy can be defined as: H(X)=
Available online:
https://pen2print.org/index.php/ijr/
P a g e | 1128
number of distinct values seen in the sampled set of
traffic flows and S=∑𝒏𝑰=𝟏𝐧𝐢 . As can be seen from
Equation (1), the sample entropy lies in the range
between (0, log2N). The entropy takes a value of 0
when the distribution is maximally concentrated and
a value of log2N when it is maximally dispersed. We
randomly choose and create two separate data sets
from Kyoto 2006+ data: one set is used for training
(for supervised techniques) and one set for testing.
For unsupervised techniques (the clustering
algorithms), test data set is used for validation. The
next task is to create data profiles for different time
bins and with no time overlapping. Each of these
time bins has a start time, end time and various
aggregate features derived from flows which fall
within that particular time bin. For example, total
bytes is the total amount of bytes transmitted by all
flows with a start time after the bin start time and
before the bin end time. The entries that fit in
between are ignored. Time bins are units for periods
of time for which the data are collected. Hence, if a
flow starts at 12:00 am and ends at 12:01 am, the
metrics collected for this period will fit in 12:00 AM
– 12:05 AM time bin assuming a five-minute bin is
used. We created a time profile program where the
bin period can be varied. It is worth noting that
detection of anomalies can vary with the chosen time
bin period. For each time bin, the entropy metrics are
extracted from the flow information. All data
processing is done using Java programming
language.
VIII.TECHNOLOGYUSEDFORTHESYSTEM
As mentioned in the previous section, seven machine
learning techniques are employed on the labeled
traffic data. For each algorithm we visualize the
confusion matrix which shows the following widely
used raw metrics. (1) TP (True Positive): this is
defined as the number of anomalous traffic flows
predicted is actually anomalous. (2) FP (False
Positive): this is defined as the number of traffic
flows predicted as anomalous but actually normal
(3)TN (True Negative): this is defined as the number
of traffic flows predicted as normal and actually
normal (4) FN (False Negative): this is defined as the
number of traffic flows predicted as anomalous but
actually normal. Our aim is to maximize TP and TN
while minimizing FP and FN. Based on these metrics
we also derive the following metric:
Precision=TP/(TP+FP) , Recall = TP/(TP+FN)
Accuracy = (TP+TN)/(TP+TN+FP+FN) As seen, the
higher the value (1 being maximum) of these factors,
the better the classification result is. All analyses
were performed using the R programming language.
The precision, accuracy and recall metrics for all
algorithms are presented in Table 1. From Table 1, it
is evident that the predicted precision and accuracy
match quite satisfactorily with the data set used for
evaluation. However, the recall result is quite low in
a few cases which indicate high values of false
negative. The results obtained for KNN are much
better than that of K-Means (KM) and Fuzzy
C-Means (FCM) algorithms as can be seen from in
Table 1. We fine tune the number of neighborhoods
to 15 in order to achieve good results. For K - Means
and Fuzzy C-Means, two clusters are chosen with
random initial centroids. The two clusters represent
Available online:
https://pen2print.org/index.php/ijr/
P a g e | 1129
precision value is 0.9565 and the accuracy is 0.9754
implying most anomalous flows are detected as
anomalous. Both K-Means and Fuzzy CMeans results
are not satisfactory, i.e. although precision and
accuracy results are over 75%, the recall value is
quite poor – only 25%. The results of Naïve-Bayes
(NB) algorithm on the test data set are quite
comparable to that of KNN; all three metrics show
over 90%. SVM also performs better than FCM and
K-Means. The RBF technique shows very good
results with high precision, recall and accuracy. For
this special neural network technique, we have used
15 neurons in the hidden layer. In general, all
machine learning algorithms perform quite
satisfactorily, except K-Means and Fuzzy CMeans.
However, the results of K-Means and Fuzzy
C-Means can be probably improved by choosing more
than two clusters and with improved algorithms for
choosing initial centroids. Further work is warranted
in this area. The Ensemble algorithm combines the
results of the above mentioned six algorithms and use
majority voting for the final prediction. Using the
Ensemble algorithm, we also obtain a high precision,
recall and accuracy, but slightly worse results than
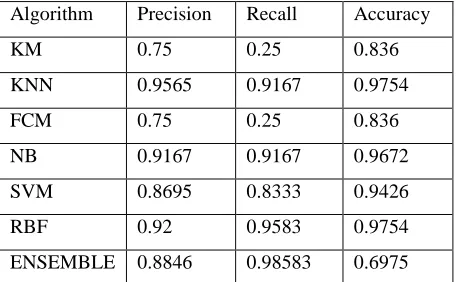
that of RBF. Table 1:presision,Recall and Accuracy
Algorithm Precision Recall Accuracy
KM 0.75 0.25 0.836
KNN 0.9565 0.9167 0.9754
FCM 0.75 0.25 0.836
NB 0.9167 0.9167 0.9672
SVM 0.8695 0.8333 0.9426
RBF 0.92 0.9583 0.9754
ENSEMBLE 0.8846 0.98583 0.6975
It is somewhat difficult to compare the results of the
seven algorithms discussed here using multiple
performance metrics. As can be seen from Table 1,
although KNN has a higher score for precision value,
and the same score for accuracy as compared to RBF,
the recall value is about 91.67% - much lower than
that of RBF (0.9583). Depending upon theapplication
of interest, one may choose a higher precision over
recall. The same is true for the accuracy metric. In
this investigation, we use another metric called ROC
(the Receiver Operating Curve) to compare the
results of the six algorithms and the Ensemble
algorithm as shown in Table 2. Among the seven
algorithms, RBF perform the best with an ROC value
of 0.9741 and FCM and KM have the lowest ROC of
0.6148. Our proposed Ensemble algorithm provides
an ROC value of 0.9639 –the second best result.
Some work has been already conducted using
Ensemble methodologies for anomaly detection that
perform better results than individual algorithms
[23-25]. There is scope for further research in this area.
Table 2: ROC Metrics for Evaluation of the
Algorithms
Algorithm ROC
RBF 0.9741
ENSEMBLE 0.9639
KNN 0.9532
NB 0.9481
SVM 0.8823
KM 0.6148
FCM 0.6148
IX. CONCLUSION AND RESULT
This work presented six commonly using six machine
learning techniques as well as an Ensemble method
Available online:
https://pen2print.org/index.php/ijr/
P a g e | 1130
anomaly detection. We compared those methods and
obtained the preliminary results using the sample data
from Kyoto 2006+ data set. The RBF classification
technique worked the best with an ROC value of
0.9741, whereas the Ensemble method came close
with ROC of 0.9631. Although the Ensemble
technique used in this study did not provide the best
result, the technique has potential and further work in
this area is worth-pursuing. While KDD-Cup 1999’
data set has been used by more than 50% of the
researchers working in the network security area [1],
there is only limited work performed using Kyoto
2006+ data set. Also, in this work, we proposed to
use information entropy as the traffic features
followed by machine learning classification
techniques for network anomaly detection.
X. REFERENCES
[1] M. Ahmed, A. N. Mahmood, and J. Hu, “A survey of network anomaly detection techniques”,
Journal of Network and Computer Applications, vol.
60, 2016.
[2] Syarif I, Prugel Bennett A, Wills G., “Unsupervised clustering approach for network
anomaly detection”, Networked Digital Technologies
Communications in Computer and Information
Science, vol. 293. Berlin Heidelberg: Springer, 2012,
pp.135–45.
[3] A. Lakhina, M. Crovella and C. Diot, “Mining
Anomalies Using Traffic Feature Distributions”,
Proc. of ACM SIGCOMM, 2005.
[4] S. Novakov, C.-H. Lung, I. Lambadaris, Ioannis
N. Seddigh, “Studies in applying PCA and wavelet algorithms for network traffic anomaly detection”,
Proc. of IEEE 14th International Conference on High
Performance Switching and Routing, 2013, pp.
185-190.
[5] S. Novakov, C.-H. Lung, I. Lambadaris, Ioannis
N. Seddigh, “Combining statistical and spectral
analysis techniques in network traffic anomaly detection”, Proc. of IEEE Conf. on Next Generation
Networks and Services, 2012, pp. 94-101.
[6] C-F Tsai, Y-F Hsu, C-Y Lin, W-Y Lin,
“Intrusion detection by machine learning: A review”,
Journal on Expert Systems with Applications, vol.
36, 2009.
[7] M. Eslamnezhad and A-Y Varjani, “Intrusion
Detection Based on MinMax K-means Clustering”,
Proc. of the 7th International Symposium on
Telecommunications, 2014.
[8] S. Wang, “Research of Intrusion Detection Based
on an Improved K-means Algorithm”, Proc. of the
2nd International Conference on Innovations in
Bio-inspired Computing and Applications, 2011.
[9] L. Hu, T. Li, N. Xie, J. Hu, “False Positive
Elimination in Intrusion Detection Based on Clustering”, Proc. of the 12th International
Conference on Fuzzy Systems and Knowledge
Discovery, 2012.
[10] H. Li and Q. Wu, “Research of Clustering
Algorithm based on Information Entropy and
Frequency Sensitive Discrepancy Metric in Anomaly
Detection”, Proc. of the International Conference on
Information Science and Cloud Computing
Companion, 2013.
[11] M. Govindarajan and R. M. Chandrasekaran,
“Intrusion detection using k-Nearest Neighbor”, Proc.
of the 1stInternational Conference on Advanced
Available online:
https://pen2print.org/index.php/ijr/
P a g e | 1131
[12] W. Ren, J. Cao, X. Wu, “Application of
Network Intrusion Detection Based on Fuzzy
C-Means Clustering Algorithm”, Proc. of the 3rd
International Symposium on Intelligent Information
Technology Application, 2009.
[13] S.A. Mulay, P. R. Devale, G.V. Garje, “Intrusion Detection System using Support Vector Machine and Decision Tree”, International Journal of
Computer Applications, vol. 3, no. 3, 2010.
[14] X. Bao, T. Shu and H. Hau, “Network Intrusion
Detection Based on Support Vector Machine”, Proc.
of the International Conference on Management and
Service Science, 2009.
[15] G Zhu and J. Liao “Research of Intrusion
Detection Based on Support Vector Machine”, Proc.
of the International Conference on Advanced
Computer Theory and Engineering, 2008.
[16] L. Bo and C. Y. Yan, “The research of Intrusion Detection based on Support Vector Machine”, Proc.
of the International Conference on Computer and
Communications Security, 2009.
[17] Ghosh A & Schwartzbard A - A study using
Neural Networks for anomaly detection and misuse
detection - Reliable Software Technologies - (
http://www.docshow.net/ids/usenix_sec99.zip). [18] Ghosh A, Schwartzbard A & Schatz A,
“Learning program behavior profiles for Intrusion Detection”, Proc. of the Workshop on Intrusion
Detection and Network Monitoring, 1999.
[19] I. Ahmad, A. B. Abdullah & A. S. Agamid, “Application of Artificial Neural Network in Detection of Probing Attacks”, Proc. of the IEEE
Symposium on Industrial Electronics and
Applications, 2009.
[20] J. Song, H. Takakura, Y. Okabe, M. Eto, D.
Inoue, and K. Nakao, “Statistical analysis of honey
pot data and building of Kyoto 2006+ data set for
NIDS evaluation”, Proc. of the 1st Workshop on
Building Analysis Data Sets and Gathering
Experience Returns for Security, 2011, pp. 29–36.
[21] J. Song, H. Takakura, Y. Okabe, M. Eto, D.
Inoue, and K. Nakao, “Description of Kyoto
University Benchmark Data”, Available online:
www.takakura.com/Kyoto_data/, Last accessed on
2017.
[22] J. Song, H. Takakura and Y. Okabe,
“Cooperation of Intelligent Honeypots to Detect Unknown Malicious Codes”, Proc. of the WOBBAT
Workshop on Information Security Threats Data
Collection and Sharing, 2008.
[23] A. B-Perin, “Ensemble-based methods for
intrusion detection”, Master’s thesis, Available online
at:
http://code.ulb.ac.be/dbfiles/Bal2012mastersthesis.pd