TABLE OF CONTENTS:
Vol. 38, No. 8, November 1985
ARTICLESPredation
483
Evaluation of Wolf Control to Reduce Cattle Predation in Alberta by Ronald R. Bjorge and John R. GunsonPlants and Soils
487492
497
500 504
513
516 522
526
Recovery of Vegetative Cover and Soil Organic Matter during Revegetation of Abandoned Farmland in a Semiarid Climate by J.F. Dormaar and S. Smoliak Denitrification and Bacterial Numbers in Riparian Soils of a Wyoming Mountain
Watershed by M.R. Hussey, Q.D. Skinner, J.C. Adams, and A.J. Harvey Effects of Tillage and Manure on Emergence and Establishment of Russian Wil- drye in a Saltgrass Meadow by D.M. Mueller, R.A. Bowman, and W.J. McGinnies Storage Life of Illinois Bundleflower and Western Indigo Seed by C.A. Call Morphology and Growth in Seedlings of Several C4, Perennial Grasses by P.I.
Coyne and J.A. Bradford
Dormancy Breaking and Germilution Requirements of Nimble Will @f&&r- gia schreberi Gmel.) !&eds by Jerry M. Baskin and Carol C. Baskin
Variation and Names in the Pou secun& Complex Elizabeth Anne Kellogg Precipitation, Soils and Herbage Production on Southeast Wyoming Range Sites by R.H. Hart and M.J. Samuel
Plant Associations within the Interior Valleys of the Umpqua River Basin, Oregon by Winston Paul Smith
Burning Effects
531
Effects of Clipping on Burned and Unburned Creeping BIucstem by R.S. Kalmb- acher, F.G. Martin, W.S. Terry, D.H. Hunter, and L.D. White535 The Effects of Fire on the B1ackbrush (Coleogyne romotis~u) Commun- ity of Southwestern Utah by Jim Callison, Jack D. Brotherson, and James E.
Bowns ,
Animal Nutrition and Grazing flfects
539543
546
551
Cattle Grazing Blue Grama Rangeland I. Seasonal Diets and Rumen Fermentation by F.T. Mc.Collum, M.L. Galyean, L.J. Krysl, and J.D. Wallace
Cattle Grazing Blue Grama Rangeland II. Seasonal Forage Intake and Digesta Kinetics by F.T, McCollum and M.L. Galyean
Dietary Overlap Among Axis, Fallow, and Black-tailed Deer and Cattle by Henry W. Elliott HI and Reginald H. Barrett
Effects of Jackrabbit Grazing, Clipping, and Drought on Crested Wheatgrass Seedlings by Bruce A. Roundy, Greg J. Cluff, J. Kent McAdoo, and Raymond A. Evans
Biomass Estimates
556
An Evaluation of Beta Attenuation for Esthnating Abovegound Biomass in a Tallgrass Prairie bj Alan K. Knapp, Marc D. Abrams, and Lloyd C. Hulbert TECHNICAL NOTES558 The Relationship of Stocking Intensity and Stockhq Pressure to Other Stocking Variables by David L. Scarnecchia
PublIshed bimonthly-January. March, May, July, September, November
Copyright 1985 by the Socrety for Range Manage- ment
INDIVIDUAL SUBSCRIPTION IS by membershrp II-I the Socrety for Range Management.
LIBRARY or other INSTITUTIONAL SUBSCRIP- TIONS on a calendar year basrs are $56 00 for the Unrted States postpard and $66.06 for other coun- trres. postpard Payment from outsrde the Unrted States should be remitted m US dollars by rnterna- tional money order or draft on a New York bank. BUSINESS CORRESPONDENCE, concerning sub- scrrptrons. advertising, reprints, back issues, and related matters, should be addressed to the Manag- ing Edrtor. 2760 West Fifth Avenue, Denver, Colo. 80204.
EDlTORIALCORRESPONDENCE,concernmgmanu- scriptsorotheredrtonal matters, should beaddressed to the Edrtor. 2760 West Frfth Avenue, Denver, Colo. 80204.
INSTRUCTIONS FOR AUTHORS appear on the rnsrde back cover of each issue. A Style Manual is also avarlable from the Society for Range Manage- ment at theaboveaddress@$1.25forsinglecopies; $1 00 each for 2 or more.
THE JOURNAL OF RANGE MANAGEMENT (ISSN 0022-409X) is published SIX times yearly for $56.06 per year by the Socrety for Range Management, 2760 West Fifth Avenue. Denver, Colo 80204. SECOND CLASS POSTAGE paid at Denver, Colo. POSTMASTER: Return entire journal with address change-RETURN POSTAGE GUARANTEED-to Socrety for Range Management. 2760 West Frfth Avenue, Denver. Cola. 80204.
VIEWPOINTS
560
Observation on Why Mongrels May Make Effective Livestock Protecting Dogs byR.P. Coppinger, C.K. Smith, and L. Miller
562 The Role of Fourwing Saltbush in Mined Land Reclamation: A Viewpoint by D. Terrance Booth
BOOK REVIEWS
565 Management of Australia’s Rangelands edited by G.N. Harrington, A.D. Wilson, and M.D. Young; Las Gramineas de Mexico. Tomo I. by Alan A. Beetle; North
American Game Birds and Mammals by A. Starker Leopold, Ralph J. Gutierrez, and Michael
T.
Bronson; Physiology and Biochemistry of Drought Resistance in Plants edited by L.G. Paleg and D. Aspinall; and The Behavior of Domestic Animals by Benjamin L. Hart.567 INDEX
Managing Editor PETER V. JACKSON Ill
2760 West Fifth Avenue Denver, Colo. 80204 Editor
PATRICIA G. SMITH
Socrety for Range Management 2760 West Fifth Avenue Denver, CO 80204 Book Review Editor GRANT A. HARRIS
Forestry and Range Management Washington State Universrty Pullman, Wash. 99164-6410 The Journal of Range Management serves
as a forum for the presentation and discussion of facts, ideas, and philosophies pertaining to the study, management, and use of range- lands and their several resources. Accord- ingly, all material published herein is signed and reflects the individual views of the authors and is not necessarily an official position of the Society Manuscripts from any source- nonmembers as well as members-are wel- come and will be given every consrderation by the editors. Submissions need not be of a technrcal nature, but should be germane to the broad field of range management. Edrtor- ial comment by an individual is also welcome and subject to acceptance by the editor, will be published as a “Viewpoint.”
ASSOCIATE EDITORS E. TOM BARTLETT
Dept of Range Scrence Colorado State Unwerslty Fort Collins, CO 80523 GARY FRASIER
780 West Cool Drive Tucson, Ai! 85704 G. FRED GIFFORD
Dept. of Range Wildlife, and Forestry Universrty of Nevada
Rena. Nev. 89506 THOMAS A HANLEY
Forestry Scrences Lab. Box 909
Juneau, Alaska 99802 N THOMPSON HOBBS
Colorado DIV. of Wildlife 317 W. Prospect Fort Collrns. Colo 80526 W.K. LAUENROTH
Department of Range Science Colorado State University Fort Collins, CO 80523
LYMAN MCDONALD Statistics Department
College of Commerce and Industry Universrty of Wyommg
Laramie, WY 82071 ROBERT MURRAY
US Sheep Experrment Statlon Dubois. ID 83423
DARREL UECKERT
Texas Agricultural Expenment Station 7887 N. Hrghway 87
San Angelo, TX 76901 BRUCE WELCH
Shrub Science Laboratory 735 N 500 E
Provo, UT 84701 LARRY M WHITE
USDA ARS
S. Plains Range Research Statron 2000 18th St.
Woodward. OK‘73801 JAMES YOUNG
USDA ARS
GRASLAN
KILLS
YOUR
TOUGHEST
Brush BulletsrM are the newest form of Graslan? especially formulated for spot treatment to kill undesirable brush in pastures and rangeland. Brush Bullets let
selectively treat individual trees, clumps rush
problems
or fencerows.. . killing spotty brush before they spread.
Brush Bullets work the same as Graslan pellets applied by plane, but you apply the Bullets by hand. No messing with sprays or sprayers. Just take the Bullets from the plastic, resealable pail and toss them under the brush you want to kill. The label tells you how many Bullets to use and how to apply them for different brush problems. Since Graslan is not a restricted use pesticide, you don’t need a pesticide license.
When you need to clear large areas of overgrown brush, your local GRASLAN specialist can prescribe the formula for orooer aerial application. By air, you can cover areas that are hard to reach on the ground. And bv flvina on Graslan pellets, you don’t have the drift-problems associated with liquid spraying.
Talk over your brush control needs with your Graslan representative. He can advise you on how to get the best results.. . whether you use an aerial application or apply Brush Bullets yourself. For the name of
your nearest Graslan representative, call toll-free:
l-800-428-4441.
Kills more than 50 brush species, roots and all.
6 @
Whichever form you use, G;aslan killsa wide variety of woody plants and weeds. And it kills the whole plant . . . roots and tops. . . givini,grass more room to grow.
mce Graslan works slowly (one to three years, depending on rainfall) you won’t see the
Making more of the land you graze.
You don’t just want to kill brush, you want better orazino. So YOU can use the land vou have to raise-more-cattle, more efficiently. Graslan may just be your most cost effective way to expand without adding acres. More grass. Graslan lets you kill the brush you want to kill, leaving more moisture, nutrients and sunlight for more grass.Better nutrition. Grasses, whether native or seeded, provide more palatable, more nutritious forage than woody plants and weeds.
Increased stocking rate. Grazing studies consistently show that with proper management, Graslan-treated acres support more animal units than untreated acres. In many cases, stocking rates can be doubled.
Higher weaning weights. Research also
fast burnback of top growth you see with some other herbicides. It may take a little longer, but this thorough kill means brush can’t come back or resprout. And you can apply Graslan any time the ground is not frozen. You don’t have to wait until spring when brush is actively growing.
shows that with improved nutrition and aood management, cows have higher conce$ion rates, deliver more live calves and produce heavier calves at weaning.
Improved water supply. A sprawling growth of brush soaks up a lot of water and produces very little forage..Without brush, thatwater can be used for grass, for livestock, and increased soil moisture.
Greater land value. While all the benefits of brush control with Graslan make your grazing land more productive, they also make that same land more valuable. So Graslan is not only a tool for today, it’s an investment for tomorrow. Talk to your Graslan representative or call the toll-free number above. And start clearing the way to better grazing with Graslan.
Elanco Products Company A Division of Eli Lilly and Company 740 South Alabama Street Indianapolis, Indiana 46285
SOCIETY FOR
RANGE MANAGEMENT
President
EDWARD A. MCKINNON Box 3474 Sta. B.
Calgary, Alta., Canada T2M2Ml 1st Vice-President
F E “FEE” BUSBY ’ i283 Park,
Laramie, WY 82870 2nd Vice-President JACK R. MILLER
7 Azalea Ct. Petaluma, Calif. 94952 Executive Vice-President PETER V. JACKSON Ill
Society for Range Management 2768 West Fifth Ave.
Denver, Colo. 88284 (303) 571-0174 Directors 1983-85 PAT 0. CURRIE
Livestock and Range Research Station Miles City, Montana
DAVID A. FISCHBACH Box 218
Faith, South Dakota 57626 1984-1986
JOHN R. HUNTER Range & Wildlife Dept. Texas Tech University Lubbock, Texas 79489 DICK WHETSELL
P.O. Box 1289 Pawhuska, OK 74856 1985-1987
REX CLEARY P.O. Box 1898 Susanville, Calif. 96130 ROBERT ROSS
386 E. Story
Bozeman, Mont. 59715
The term of office of all elected officers and directors begins in February of each year during the Society’s annual meeting.
Contribution Policy
The Society for Range Management may accept donations of real and/or personal property, subject to limitations imposed by State and Federal Law. All donations shall be subject to control by the Board of Directors and their discretion in utilization and application of said donations. However, consideration may be given to the donor’s wishes concerning which particular fund account and/or accounts the contribution would be applied.
We recommend that donor consult Tax Advisors in regard to any tax consideration that may result from any donation. Donations may be made by bequests, legacies, devises or transfers from private individuals, partnerships, corporations, foundations, sections, organizations, estates, and trusts, or a memorial fund established as an expression of remembrance to members of real and/ or personal property. Donations can be sent to the Society for Range Management, Executive Vice-President, 2760 West Fifth Avenue, Denver. Colorado 80204.
The Society for Range Management, founded in 1948 as the American Society of Range Management, is a nonprofit association incorporated under the laws of the State of Wyoming. It is recognized exempt from Federal income tax, as a scientific and educa- tional organization, under the provisions of Section 501(c)(3) of the Internal Revenue Code, and also is classed as a public foundation as described in Section 509(a)(2) of the Code. The name of the Society was changed in 1971 by amendment of the Articles of Incorporation.
The objectives for which the corporation is established are:
-IO develop an understanding of range ecosystems and of the principles applicable to the managemem of range resources;
--to assisf all who work with range resources to keep abreasr of new findings and techniques in the science and art of range management;
-to improve rhe effectiveness of range management to obtainfrom range resources the products and values necessary for man S welfare;
--to create a public appreciation of the economic and social benejits to be obtained from the range environment:
-to promote professional development of its members.
Evaluation of Wolf Control to Reduce Cattle Preda-
tion in Alberta
RONALD R. RJORGE AND JOHN R. GUNSON
Abstract
Results of wolf (Canis @I.@ control to reduce predation of cattle in northwestern Alberta are reported. Numbers of wolves declined from about 40 prior to control to 3 following the strych- nine poisoning of 26 wolves during 2 winters, 197PsO and 1980-81. Additional losses of wolf pack members occurred from natural mortality and dispersal following the removal of the majority of their packmates. In 3 of 6 instances where packs took baits, entire
packs of 2,4, and 6 wolves were killed. Ingress of wolves occurred within 1-2 years. Total mortality of cattle declined from a mean of 64 (3.4%) during 4 years prior to control to 36 (Xg$@during 2 years
following control. Selectivity of strychnine poisoning was renson- ably good although more emphasis on preventive management is recommended.
Wolf (Cam3 lupus) depredations of livestock and subsequent wolf removal have occurred throughout the settlement of North America (Young 1944, Lopez 1978) and currently occur in western Canada (Gunson 1983a), Ontario (Kolenosky 1983), and Minne- sota (Fritts 1982). Despite controversy and costs associated with these control programs, evaluations have been limited.
In Alberta, wolves occur in the northern and western two-thirds of the province, with current numbers estimated at about 4-5,000 (Gunson 1983b). Wolf-livestock complaints are most common near the forest-agricultural fringe in Alberta and other isolated areas of the province. The Alberta Fish and Wildlife Division (AFW) initiated annual livestock-related wolf control in 1972, consisting of complaint investigation and removal of wolves if predation or mauling was confirmed. During 9 years (1972-8 l), 729 wolves were known to have been removed.
Results of wolf control conducted during studies of wolf preda- tion of cattle in northwestern Alberta during 1975-81 are evalu- ated. This paper reports details of wolf removal, nontarget kill, response of wolves to vacant territories, and the impact of wolf removal on cattle. Results are discussed in relation to management of wolf-livestock conflicts.
Study Area
The study area, located adjacent to or near the Simonette River (54“ SS’N, 117O 5O’W) in northwestern Alberta, encompassed 7 adjacent grazing leases ranging in size from 5 to 59 km*. All leases were located on crown lands in the vicinity of the forest- agricultural fringe. Total numbers of cattle pastured on all leases during the May through October grazing season varied from 1,558 (1979) to 2,288 (1976).
The area is within the boreal forest (Strong and Leggat 1981); trembling aspen (Populus tremuloides)is the dominant tree species with balsam poplar (Populus balsamifera), willow (Salix ssp.), and alder (Alnus spp.) also occurring. The topography is generally flat, but interrupted by the banks (to 120 m) of numerous creeks and the
Ronald R. Bjorge is Regional Habitat Biologist, Alberta Fish and Wildlife Div- ision, Bag 900-26, Provincial Building, Peace River, Alberta. John R. Gunson is Carnivore Management Unit Leader, Alberta Fish and Wildlife Division, OS. Longman Building, 6909 - 116 Street, Edmonton, Alberta.
The authors acknowledge W. Johnson for capable assistance throughout most of the project. Additional field assistance was provided by C. Dobson, K Schmidt, D. Wig, and W. Wynnyk. Predator control staff, Alberta Fish and Wildlife Division, provided details of their wolf control. Cattlemen on the study area a~ thanked for their cooperation and assistance.
Manuscript accepted April 25, 1985.
Simonette and Latornell Rivers. During the grazing period aver- age water depth in the rivers varied up to 1 m, but increased occasionally by several meters following periods of heavy rainfall. Moose (Alces alces)were common; and wapiti (Cervus elaphus),
white-tailed deer (Odocoileus virginianus), and mule deer (0.
hemionus) occurred in some areas. Black bear (Ursus americanus)
and coyotes (Canis latrans) were abundant throughout the area.
Methods
We counted and examined cattle entering and leaving grazing leases for signs of attacks by predators. Carcasses discovered by cattlemen were investigated by study personnel rapidly, usually within 24 hours of receiving a report, partly because of require- ments of a compensation program. Cattlemen checked their stock approximately every 2 weeks, while study personnel, travelling by horse and fixed-wing aircraft, occasionally inspected herds. Dead animals were examined to determine cause of death; only those cattle with definite signs of attack including subcutaneous hemor- rhages, blood trails, and/ or teeth and claw marks, were classified as predator kills. Wolf kills were easily distinguished from those of bear; bites were evident on wolf kills and maulings, while wounds from claws or heavy blows were evident on cattle killed by bears. Tracks and sometimes scats were observed at kills, supporting other data used to determine the predator responsible.
Most of the wolves were captured in #48 and #114 Newhouse traps. One wolf was captured in a neck snare similar to those utilized by Nellis (1968) for coyotes. Captured wolves were res- trained with a modified hay fork or forked stick, examined for sex, reproductive status and general condition, radio-collared (AVM Instrument Company; Champaign, Illinois), and released. Radio- collared wolves were aerially located, usually twice/week during May through October, and weekly during other months.
We travelled by fixed-wing aircraft, horse, and all terrain vehicle during summer and by fixed-wing aircraft and snowmobile during winter. Histories of wolf packs and individuals (and thus popula- tion estimates) were constructed from analyses of relocations of radioed wolves, aerial and ground observation of radioed and other wolves, pelage colour, carcasses, and tracks. Because this variety of data sources was used to estimate populations and our study area was relatively small (1,340 km*), we believe our esti- mates are reliable. Removal of 26 wolves through wolf control near the termination of the study revealed no surprises; all these wolves had been included in earlier population estimates.
AFW predator control personnel conducted wolfcontrolduring the winters of 1979-80 and 1980-8 1. The placement of the 12 poison bait stations was determined entirely by predator control person- nel with no consultation with us. Control consisted of unpoisoned draw baits surrounded by several bite-sized portions of poisoned meat, each with 2 cubes of 280 mg strychnine. These were buried in the snow lo-30 m from the larger bait. This is the usual technique used for wolf control during winter in Alberta.
Government wolf control was not conducted during the first 4 years of the study despite documented livestock damages from wolves, although wolves were illegally poisoned in 1978. In lieu of wolf control, cattlemen received 100% of annually established values for confirmed kills and 80% value for cattle missing in the
Table 1. Results of wolf control on the Simonette cattle leases in northwestern Alberta during 1979-80 and 1980-81.
Winter Bait Date set Date removed Wolves taken Date wolves killed Non-tare& species
1979-80 1 10 Dec. 24 Mar. Matlock Pack 6 of 6
2
3 4 5 6
TOTAL
1980-8 1 7 14 Jan. 26 Mar. 1 26 Mar.
8 9 10 I1 12 TOTAL
10 Jan. 14 Mar.
10 Dec. 10 Jan. 10 Jan. 10 Jan.
1 Apr. 24 Mar. 24 Mar. 24 Mar.
14 Jan. 26 Mar.
30 Jan. 20 Feb.
4 Mar. 27 Mar.
23 Jan. 5 Feb.
5 Feb. 25 Feb.
Junction Pack 4 of 8
1 1 2
Muskeg Lake Pack 5 of 7 1
0 0 20
1
South Matlock Pack 4 of 4 0
0 0 6
11 Feb.
8 Feb.
4 Jan. 24 Mar. 24 Jan.
23 Feb.
1 Feb.
IO Feb.
1 Coyote 5 Magpies 5 Ravens
1 Hairy Woodpecker
1 Coyote 1 Raven
6 Coyotes 6 Ravens 1 Magpie 1 Red Fox
1 Coyote
fall. This compensation was available only in our study area through a special program of the Alberta Predator Indemnity Program and resulted in rapid reporting of dead or missing cattle.
The 2 X 2 ch&test was used to determine if the incidences of mortality and mauling (attempted predation) among cattle dif- fered significantly before and after wolf control.
Results and Discussion Removal of Wolves
Seven of the 12 baits established during 1979-81 (Table 1) resulted in killing 26 wolves. Numbers of wolves on the study area dropped from 39 or 40 during fall 1979 to 3 during summer 1981 (Table 2). The control program required 56 man-days and cost $8,325.00 or $320 per wolf.
Mean number of days from bait establishment until wolves were killed was 48 (range 1 l-94). Wolves radio-monitored during the control program did not always consume bait at first encounter.
For example, the Muskeg Lake Pack visited bait stations within its territory every week between first baiting on 10 December 1979 and 25 February 1980, when 5 of the 7 wplves were poisoned. The Colony Pack spent at least 15 days within 1 km of a bait station during January 1980. Tracks indicated these wolves had fre- quented the site often, but bait was not consumed during that winter. The Matlock and Junction Packs consumed baits on the first known encounter. These data indicate that considerable time may be required to effect wolf removal, especially if baits are placed out in early winter.
All 26 wolves killed at bait stations died within 150 m of the bait. However tracks in the snow indicated that 3 additional wolves staggered up to 1 km from bait sites. They were still travelling and apparently affected by poisoning but their eventual fate was unknown. Elsewhere in wolf control in northwestern Alberta most wolves killed at bait stations died near the baits but several wolves have travelled up to 1 km before dying (G. Craig, person. com-
Table 2. Number of wolves in the vicinity of the Simonette cattle leases in northwestern Alberta before and after wolf control during winters 1979-80 and 1980-81.
Wolves
Number (Fall)
Poisoned at Bait
Shot or TrauDed
Poisoned-
Related Other
Estimated Remaining (Soring)
_- . .
1979-80 Muskeg Lake Pack 7 5 0 0 0 2
Matlock Pack 6 6 0 0 0 0
Colony Pack 6 0 2 0 0 4
Junction Pack 10 4 3 1’ 0 2
South Matlock Pack 4 0 0 0 0 4
Long Lake Pair 2 2 0 0 0 0
Swan Lake Pair 2 0 1 0 0 12
Lone wolves 2-3 3 0 0 0 0
TOTAL 3940 20 6 1 0 12-13
1980-8 1 South Matlock Pack 4 4 0 0 0 0
Colony Pack 9 5’ 2 0 0 2
Lone wolves 3-4 2 0 0 24 I
TOTAL 16-17 11 2 0 2 3
I-Wolf 18 died after separation from all but one member of the Junction Pack. Z-This wolf could have been poisoned and classified as a single wolf. J-These 5 wolves were illegally poisoned.
‘-Two radio-collared lone wolves paired during February and dispersed during March 1981.
Table 3. Mortality of cattle and numbers of wolves on summer grazing leases in the vicinity of tbe Simonette River, northwestern Alberta.
Cattle Mauled Cattle Mortality Loss
Year
Predators’
Cattle on Causes Other Cattle wolves*
Study Area Wolves Bears Wolves Bears than predation Unknown Missing Total % Present Before Wolf Control
1976 2288
1977 2023
1978 1784
1979 1558
After Wolf Control
1980 1772
1981 1804
6 3 I 1 123 1 50 65 2.9 23-25
5 3 I 0 1 3 65 70 3.5 29-33
13 2 3 1 1 1 58 64 3.6 28-3 1‘
19 1 8 1 2 3 43 57 3.7 39-40
8 1 3 1 2 0 38 44 2.5 1617
0 1 1 0 2 0 24 27 1.6 34
I-These include only known predator kills. Other kills by wolvesand bears occurred but were not detected due to remoteness, large pasture size, dense tree cover, and completecon-
sumption.
*-Wolves present during early winter.
J-Seven cattle died from bloat following escape from a grazing lease.
‘-Six wolves were illegally removed during 1977-78 and 5 during 1980-8 1.
mun.). Fuller and Novakowski (1955) also indicated that most wolves died near strychnine baits, although they reported one dying about 400 m away.
Survivors of packs depleted by wolf control demonstrated vari- able behavior including emigration, death from starvation, and increased dependence on livestock. One of 2 members that sur- vived wolf control in the Muskeg Lake Pack during winter 1979-80 left the area the following May. During December 1981 this wolf #20, an adult male, was killed with another at a government poison bait 248 km from the last radio-location. These wolves had been killing cattle in this area, indicating wolf 20 became more depend- ent upon cattle following removal of the majority of his pack and his dispersal. Prior to wolf control on our study area, his pack was primarily dependent on wild prey, although they did kill 1 yearling heifer and wounded 2 other heifers.
Wolf 17, a black female pup, and a small grey wolf of unknown sex and age travelled together following the deaths of at least 4 of the 8 members of the Junction Pack on 8 February 1980. Following a radio-location on 26 March, wolf 17 was found dead. Tracks in the snow indicated she had been walking up a relatively steep bank, collapsed, slid downhill and died. Numerous porcupine (Erethizon dorsatum) quills were located on her mouth and face, one rib was broken and she was emaciated with an empty stomach. Several days earlier a small grey female wolf, likely 17’s companion, was shot near a farmyard about 1 km from where wolf 17 died, and within the general area where these 2 wolves had been living following control.
Age and experience of wolves surviving control appeared to be important factors in their continued survival. For example, wolf 13, a large adult wolf, survived the illegal poisoning of most of the remainder of the Colony Pack in 1980-81. However, wolf reduc- tions may be greater than indicated by the number of wolves at bait stations as suggested above.
Nontarget Kill
In the control reported here, relatively few nontarget animals were taken (Table 1). Although quantitative data relative to densi- ties of fur-bearers are unavailable, coyote densities appeared greater than those of wolf. While capturing wolves for radio- collaring, we made 39 coyote captures versus 28 wolf captures in leg-hold traps. Only 9 coyotes were taken on poison baits com- pared to 26 wolves, suggesting greater selectivity for wolves although some coyotes may have left the area during winter. Other furbearers relatively common and regularly harvested by regis- tered trappers in the region include fisher (Martespennanti), lynx
(Felix lynx), and short-tailed weasel (Mustela erminea). None of these were taken on poison baits, although 1 red fox (Vulpes vulpes) was killed. The few nontarget animals taken during 694
bait-nights were largely due to experienced control personnel and the technique of burying small drop baits in the snow. Animals other than wolves apparently did not readily retrieve these baits from beneath the snow.
Wolf Response to Vacant Territories
Ingress of wolves to vacant territory following control was noted. After illegal poisoning of 6 black wolves on the study area during early winter of 1977-78, the resultant vacant territory was occupied by another pack of 8-10 wolves during summer of 1979. Because only 1 wolf survived the illegal control and the new pack was composed of many grey animals, we concluded this was a different group of wolves.
A range shift was evident for wolf 13 following removal of adjacent packs (Junction, Muskeg Lake, and Matlock) during winter of 1979-80. This wolf separated from the Colony Pack and travelled with a small black wolf throughout portions of the former territory of these 3 packs. Ingress of lone wolves into territories vacated through wolf control was suspected during 1980. Three of 5 wolves captured that year were lone, compared to 0 of 9 and 1 of 6 in 1979 and 1978, respectively. During September 198 1 a pack of at least 7 wolves appeared in portions of the territories formerly occupied by the Colony and Junction Packs. By 1982 local cattle- men and hunters were reporting that wolves were again common in the area.
Wolves commonly disperse from established packs (W.B. Bal- lard, R.O. Stephenson and T.H. Spraken 1981, unpublished final report, Nelchina Basin Wolf Studies, Alaska Dept. of Fish and Game; Fritts and Mech 1981) to search for a mate and vacant territory (Mech 1973, Rothman and Mech 1979). Movements of lone wolves and newly formed pairs are largely influenced by the activities of packs. Normally these wolves tend to avoid territories of packs (Fritts and Mech 1981, Van Ballenberghe et al. 1975) although lone wolves have occasionally been known to join estab- lished packs (Fritts and Mech 1981). An absence of howling (Har- rington and Mech 1979, Joslin 1967) and a scarcity of recent scent marks (Peters and Mech 1975) may encourage dispersing wolves to remain in vacant territories. Thus repopulation of vacant territo- ries created through wolf control may occur relatively quickly through immigration of wolves from other areas.
Impact of Wolf Removal on Cattle Mortality
Total mortality of cattle from all sources decreased from a mean of 641 year during the 4 pre-control years to 441 year (KO. 10) and 27/year (X0.01) following year 1 and 2 of wolf control, respec- tively (Table 3). Numbers of cattle mauled but not killed were lower (X0.05) after the 2nd year of control. Also, numbers of cattle known to have been killed by wolves declined after wolf
control was initiated (Table 3). We believe that wolf control, and thus less wolf predation of cattle in 1980 and 1981, was primarily responsible for the observed lower mortality during those years.
Elsewhere, wolf control has reduced subsequent prevalence of predations (Fritts 1982, Tompa 1983). In Minnesota, wolf removal reduced losses in most cases, but some depredations stopped even though control was unsuccessful, while in other cases depredations continued despite wolf removal. Fritts (1982) attributed such vari- ation to differential behavior of specific wolf packs, changes in farm management practices, pack versus lone wolves, and wolf densities. In British Columbia, Tompa (1983) reported 34% of 104 cases of control were highly effective whereas in 28% of the cases control was not effective.
A major disadvantage of wolf control is the fairly rapid repopu- lation from surrounding areas. To reduce costs of repetitious con- trol, annual harvests by hunters and trappers should be encour- aged. During the 6 years of our study only 4 wolves were harvested by trappers. Special programs to train trappers in wolf capture are needed.
In our area, total mortality was relatively high during 1976 (65 losses-2.9%) and 1977 (70 losses-3.5%) despite only modest numbers of wolves during those years (compared to 1979) and fewer observed maulings and kills. We did not observe higher levels of bear predation (Table 3) or disease during those years, and because of the remoteness of the pastures, we do not believe theft occurred. These somewhat greater-than-expected losses during the 1st 2 years of study were likely related to 2 factors.
Perhaps most importantly, preventive techniques should be emphasized in wolf-livestock management. Such measures include sending only healthy and non-pregnant animals to pasture (Bjorge 1983), checking cattle regularly, rounding up cattle in early fall, and removing carcasses to discourage scavenging. Techniques cur- rently under evaluation include use of surveyors’ flagging on fen- ces, installation of bright lights, and taste aversion conditioning (Fritts 1982). However, in remote pastures it is unrealistic to expect prevention of all depredations by wolves. Techniques utilized to prevent sheep depredation by coyotes (Robe1 et al. 1981, Boggess et al. 1978) such as corralling at night or use of guard dogs are not feasible to prevent wolf depredations on large, remote cattle pas- tures. Grazing leases should be located as close to agricultural development as possible in order to afford more protection from predation.
First, losses to flooding were probably higher during these years when very high water levels occurred on the Simonette River following 2-3 day rains. On several occasions the level of this river rose rapidly causing extensive bank erosion and loss of vegetation (including large trees). During intervening periods of low water levels, we often observed cattle crossing the river and 6 of 7 pas- tures included portions of the river. Precipitation data from Envir- onment Canada at Grande Prairie, 70 km to the west, indicated May-September rainfall exceeded the 40-year mean of 256 mm during 3 of the 6 years: 1976-394 mm, 1977-341 mm, and 1980-305 mm. It should also be noted that losses were the lowest during 1981, the year of least wolves and lowest rainfall-156 mm.
Literature Cited
Bjorp, R.R. 1983. Mortality of cattle on two types of grazing areas in northwestern Alberta. J. Range Manage. 36:20-21.
Bjorge, R.R., and J.R. Gunson. 1983. Wolf predation of cattle on the Simonette River pastures in northwestern Alberta. p. 106-l Il. In: L.N. Carbyn (Ed.) Wolves in Canada and Alaska: their status, biology and management. Can. Wildl. Serv. Rep. 45.
Boggess, E.K., R.D. Andrews, and R.A. Bishop. 1978. Domestic animal losses to coyotes and dogs in Iowa. J. Wildl. Manage. 42362-372.
Fritts, S.H. 1982. Wolf depredation of livestock in Minnesota. U.S. Dep. Int. Fish and Wildl. Serv. Pub. 145.
Second, but of lesser importance, cattlemen may have removed a few stock and reported them as missing during the initial period of study when we were less familiar with the area and their operations. We did not, however, determine that this occurred.
Another factor tending to obscure the direct relationship between numbers of wolves and total cattle losses is that some of the increases in wolf numbers occurred in areas only peripheral to the pastures. Only the Junction Pack was located primarily within cattle leases.
Fritts, S.H., and L.D. Me&. 1981. Dynamics, movements and feeding ecology of a newly protected wolf population in northwestern Minne- sota. Wildl. Monogr. 80.
Fuller, W.A., and N.S. Novakowski. 1955. Wolf control operations, Wood Buffalo National Park, 1951-52. Wildl. Manage. Bull. (II). Can. Wildl. Serv.
Predation by wolves was an important source of cattle mortality, because 17 (41%) of 41 animals found dead of known causes were killed by wolves. However, of 327 dead or missing cattle only 49 carcasses were located (Table 3). We have previously (Bjorge 1983, Bjorge and Gunson 1983) pointed out that cattle dying from preda- tors are more difficult to discover than cattle dying from other causes because they are often completely consumed, especially by wolves. Wolves, in all probability, killed greater than 41% of the missing cattle. Because of complete consumption by wolves, large pastures, and tree cover, more intensive searches would not have improved our sample significantly. These results are in contrast to those of sheep pastured on open range (Klebenow and McAdoo 1976) and cattle managed more intensively (Gee 1979), where most dead animals are found.
Gasaway, W.C., R.O. Stephenson, J.L. Davis, P.E. Shepherd, and O.E. Burris. 1983. Interrelationshius of wolves, orev, and man in interior Alaska. Wildl. Monogr. 84. _
._ _-
Gee, C.K. 1979. Cattle and calf losses to predators-feeder cattle enterprises in the United States. J. Range Manage. 32152-154.
Gunson, J.R. 1983a. Wolf predation of livestock in western Canada. p. 102-105. In: L.N. Carbyn (Ed). Wolves in Canda and Alaska: their status, biology and management. Can. Wildl. Serv. Rep. 45.
Gunson, J.R. 1983). Status and management of wolves in Alberta. p. 25-29. In: L.N. Carbyn (Ed). Wolves in Canada and Alaska: their status, biology, and management. Can. Wild]. Serv. Rep. 45.
Harrington, F.H., and L.D. Mech. 1979. Wolf howling and its role in territorial maintenance. Behavior LXVII: 207-249.
Joslin, P.W.B. 1967. Movements and homesites of timber wolves in Algon- quin Park. Amer. Zoo. 7279-288.
Management Implications
In this study strychnine poisoning was effective in reducing numbers of wolves and subsequent mortality of cattle. Where depredations occur, wolves can be removed quickly and relatively cheaply during mid- to late-winter using this method. A variety of other techniques have been used in wolf control, including aerial shooting (Gasaway et al. 1983), other toxicants (Tompa 1983), and mechanical devices (Young 1944, Lopez 1978, Fritts 1982), but these methods are either less effective in forested areas or are considerably more expensive and time consuming. Although the use of strychnine to remove predators remains controversial, data in this report may assist agencies in selecting control methods.
Klebenow, D.A., and K. MeAdoo. 1976. Predation on domestic sheep in northeastern Nevada. J. Range Manage. 2996-100.
Kolenosky, G.B. 1983. Status and management of wolves in Ontario. p. 35-40. In: L.N. Carbyn(Ed). Wolves in Canada and Alaska, their status, biology, and management. Can. Wild]. Serv. Rep. 45.
Lopez, k. 1978. Of wolves and men. Charles Scribner’s Sons. New York.
Mech. L.D. 1973. Wolf numbers in the Suoerior National Forest of Minne- sota. USDA Forest Serv. Res. Pap. NC-97.
Nellis, C.H. 1968. Some methods for capturing coyotes. J. Wildl. Manage. 30402-405.
Peters, R.P., and L.D. Me&. 1975. Scent marking in wolves. Amer. Sci. 63:628-637.
Robel, R.J., A.D. Dayton, F.R. Henderson, R.L. Meduna, and C.W. Spaeth. 1981. Relationships between husbandry methods and sheep l&es to canine predators. J. Wildl. Manage. 45:894-909.
Rothman. R.J.. and L.D. Meeh. 1979. Scent marking in lone wolves and newly formed pairs. Anim. Behav. 27:750-760. -
Strong, W.L., and K.R. Legpt. 1981. Ecoregions of Alberta. Alberta Energy and Natural Resources Tech. Rep. Number T/4.
Tompa, F.S. 1983. Problem wolf management in British Columbia: con- Van Ballenberghc, V., A.W. Erickaon,and D. Byman. 1975. Ecology of the flict and program evaluation. p. I 12-I 19. In: L.N. Carbyn (Ed). Wolves timber wolf in northeastern Minnesota. Wildl. Monogr. 27.
in Canada and Alaska: their status, biology, and management. Can. Young, S.P. 1944. The wolves of North America. ,Part 1: their history, life
Wildl. Serv. Rep. 45. h$ts, economic status, and control. Amer. Wtldl. Inst., Washington,
Recovery of Vegetative
ter during Revegetation
Semiarid Climate
J.F. DORMAAR AND S. SMOLIAK
Abstract
Cover and Soil Organic Mat-
of Abandoned Farmland in a
Much of the farmland in the Canadian Prairie region has been abandoned over the years and allowed to revert to weedy cover and eventually to grassland. While some of the changes in vegetation during plant succession have been documented, limited hrfonna- tion is available on changes in soil characteristics. The purpose of this study was to assess the vegetative cover and soil transforma- tion under similar semiarid climatic conditions with an annual precipitation of about 310 mm on 3 sites abandoned in 1925,1927, and 1950 as compared to adjacent native range. Total C and N, water-stable aggregates between 1.0 and 5.0 mm, and polysaccha- ride content increased, while chelating resin-extractable C, humic acid/fulvic acid ratios, caloric content of the rootmass, and dehy- drogenase activity decreased in the successional sequence. Never- theless, more than 55 years will be required to aiiow soil to return to native range standards under moderate grazing by livestock. Revegetated range may have to be subjected to lighter grazing pressures than usual to allow the vegetation to continue to increase its rootmass and thus the soil chemical properties. A hypothesis to explain changes in root- and top-mass ratios with time on the basis of the quality of soil nitrogen has been advanced.
Many of the level grasslands in southeast Alberta and southwest Saskatchewan were cultivated early in this century. However, from 1916 to 1935, it became evident that many of these areas were entirely unsuited for crop production because of adverse climatic conditions and the nature of the marginal or submarginal lands that were cultivated. A combination of a series of years of average or below average rainfall, drifting soil, and low prices of agricultu- ral products forced many settlers to abandon their farms. Some 1.6 million hectares of abandoned farmlands were allowed to revert to annual and perennial weeds and eventually to grassland. Across the border in Montana, U.S.A., the economic situation was much better after the severe drought between 1917 and 1921 (Gieseker 1931) and dryland farming was firmly established. However, large parts of southern Alberta and Saskatchewan, Canada, were consi- dered unsuitable for cultivation and have remained in permanent rangeland (Fig. 1).
A recent study assessed the possible impact of 40 to 49-year-old stands of crested wheatgrass on soil organic matter characteristics, by comparing four stands with adjacent native range (Dormaar et al. 1978, 1980). At one seemingly native range site, 49 years of
Authors are soil scientist and rangeland ecologist, respectively, Agriculture Can- ada, Research Station, Lethbridge, Alta. TIJ 4B1.
The authors thank C.D. Bticker, Administrator, Alberta Remote Sensing Centre, Alberta Environment, Edmonton, for permission to use the Landsat border scene (Fig. I).
Manuscript accepted April 15, 1985.
JOURNAL OF RANGE MANAGEMENT 36(6). November 1665
naturally reverting to native range after 10 years of cultivation was not sufficient time for the soil to have chemical and physical characteristics similar to those of adjacent native range. This was of interest in terms of time as a soil-forming factor. Old-field successions have been described by Booth (1941), Whitman et al. (1943), Tomanek et al. (1955), and Haug and Van Dyne (1968), while Rice (1976) explained the causes of succession. The purpose of this study was to assess the vegetation and changes in a number of soil chemical properties during the succession of abandoned cropland to native range under semiarid climatic conditions.
Materials and Methods sites
Three fields of similar topography at the Agriculture Canada Research Substation, Manyberries, Alta., were chosen for the study. The fields included sites containing cropland, abandoned 30 to 55 years before the study and allowed to revegetate by secondary succession, and adjoining unbroken native range of the Mixed Prairie Association. The native range and the adjacent cultivated areas have been grazed by cattle at a moderate rate to provide a 50% carryover of forage.
The treatment received by the abandoned fields was as follows: Site 1925-The revegetatingfield was ploughed in 1910, cultivated
for 15 years, and abandoned in 1925.
Site 1927-The revegetating field was ploughed in 19 17, cultivated for 10 years, and abandoned in 1927.
Site 1950-The revegetating field was ploughed in 1920, cultivated intermittently for 30 years, and abandoned in 1950.
Vegetation
Vegetative ground cover and species composition of the study sites were determined by the vertical point method (Lodge and Campbell 1965). A total of 2,100 points were located at each site in August, 1981. Nomenclature for vascular plants follows that given by Moss (1959). Forage yields were obtained by harvesting the plants at ground level in 10 randomly located I-m2 quadrats at each site in August, 1981 and 1982, and oven-drying the harvested samples.
Soil
The soils are members of the Orthic Brown Subgroup of the Chemozemic Order (Aridic Ustochrept): a dark yellowish brown (1OYR 4/4, wet) friable Ah surface horizon of 7 cm with pH Hz0 of 6.9 is underlain by about 13 cm of a brown (10YR 5/3, wet) columnar Bm horizon with a pH Hz0 of 6.1; the Ck horizon occurs
at about 20 cm below the surface, is very pale brown (IOYR 713, wet) and has a pH Hz0 of 1.7. The climate is semiarid and annual preapeation averages about 310 mm.
Ten soil cores, 6.5 X 60 cm, were obtained at random locations (April, 1982)fromeachfieldand the rootsineach 15-cmincrement were washed by the method essentially as described by Lauenroth and Whitman (197 1). Weight of organic mass was calculated on an ash-free, oven-dry basis (da@ Energy content of the roots from the O-IS-cm level was determined on 0.5-g samples in a Parr adiabatic calorimeter and expressed on a daf basis.
The Ah horizon (O-IS-cm) was sampled (September, 1980) on 3 subplots in each of 4 sampling areas with similar landscape posi- tion within each field. The subplot samples were combined, mixed, air-dried, and ground to pass through a l-mm screen. Organic matter (OM) was determined by the method outlined by Walkley and Black (1934), chelating resin-extractable carbon(C) and the humic acidlfulvic acid carbon ratios as described by Dormaar (1973), total nitrogen (N) as by Association of Official Agricultural Chemists (1950), hydrolysable-N, hexosamine-N, and amino acid- N (on samples collected in April, 1982) as by Bremner (1965), and polysaccharides as by Brink et al. (1960). Dehydrogenase activity was determined at pH 1.6 on fresh, moist soil (September, 1980) within 24 hours after its collection by measuring the triphenylfor- mazan (forma=“) produced by reduction of 2,3,5-triphenyltetra- zolium chloride when soil was incubated with 2amino-2-(hydro- xymethyl)propane-1:3diol buffer (0.5 M) at 3O’C for 5 hours
488
(Ross 197 1). The soil variables chosen were considered to be sensi- tive indicators of soil changes and have been used previously (Dormaar et al. 1978).
Water-stable aggregates (April, 1982) were determined by the wet-sieving technique (Yoder 1936); undisturbed cores were ana- lyzed for bulk density (U.S. Salinity Laboratory Staff 1954).
It is recognized that chemical, physical, and vegetational changes that may occur within and on the soil are undoubtedly affected by a host of environmental changes that vary with years. Ideally, the most accurate assessment of such changes could be made from repeated analyses of samples taken periodically from well-replicated field plot tests over many years. Although replica- tion and application of current statistical analyses to newly estab- lished field plot experiments is common and undeniably desirable and useful, valid information and data can still be gained from early established. unreplicated field experiments, includingrcvege- tation of abandoned farmland studies, by virtue of their antiquity (Ridley and Hedlin 1968, Dormaar and Pittman 1980, Dormaar 1983). Time has exerted a type of replication on the revegetation of the abandoned farmland study described here.
Multiple sampling of a single plot at any one time reduces variance attributable to analytical sampling errors (Federer 1955), but does not constitute a replication of the applied treatment. Standard errors were calculated to check the variability within the results of any analysis for each set of 4 soil samples, but they were not tabulated. The root weights were analyzed using analysis
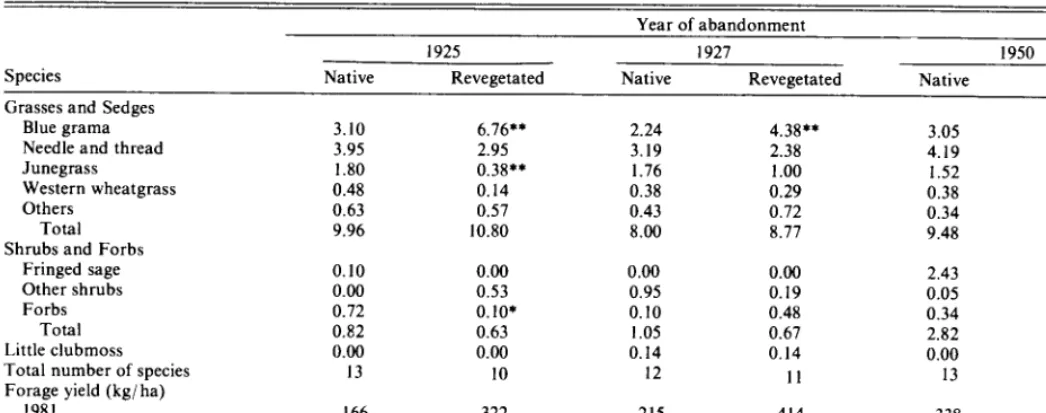
Table 1. Vegetative ground cover (%) by species and forage yield on native range and revegetated native range, Mnnyberries, Alberta, 1981-82.
Year of abandonment
1925 1927 1950
Species Native Revegetated Native Revegetated Native Revegetated
Grasses and Sedges
Blue grama 3.10 6.76*’ 2.24 4.38** 3.05 6.52**
Needle and thread 3.95 2.95 3.19 2.38 4.19 2.14*
Junegrass 1.80 0.38** 1.76 1.00 1.52 1.00
Western wheatgrass 0.48 0.14 0.38 0.29 0.38 0.14
Others 0.63 0.57 0.43 0.72 0.34 0.05
Total 9.96 10.80 8.00 8.77 9.48 9.85
Shrubs and Forbs
Fringed sage 0.10 0.00 0.00 0.00 2.43 0.95**
Other shrubs 0.00 0.53 0.95 0.19 0.05 0.19
Forbs 0.72 0.10* 0.10 0.48 0.34 0.38
Total 0.82 0.63 1.05 0.67 2.82 1.52**
Little clubmoss 0.00 0.00 0.14 0.14 0.00 0.00
Total number of species 13 10 12 11 13 10
Forage yield (kg/ ha)
1981 166 322 215 414 338 784
1982 244 392 380 620 292 440
Mean 205 357 298 517 315 612
**,*Significantly different at the 1% and 5% levels, respectively, as determined by the Chi-Square test.
Table 2. Below-ground biomass (g/m*) on native range and revegetated range, Manyberries, Alberta, 1982 (average of 10 cores 6.5-cm diameter X E-cm depth).
Year of abandonment Increment
(cm) o-15 15-30 30-45 45-60 Total Caloric content
@J/g)
Potential energy
@J/m?
1925 1927 1950 Mean
Native Revegetated Native Revegetated Native Revegetated Native Revegetated
1,373** 808 1,385** 716 1,058** 618 I ,272** 714
406* 357 466* 408 555** 361 476* 375
300** 264 428** 309 337** 181 35588 251
315** 199 290** 244 21288 125 272** 189
2,394** 1,628 2,569*’ 1,677 2,162** 1,285 2,375*+ 1,530
19.2 19.2 19.3 19.5 19.3 22.4
26,362 15,514 26,731 13,943 20,419 13,709
*,**Significantly different from adjacent revegetated range at EO.05 and m.01, respectively
of variance techniques, while the vegetative ground cover was compared by the Chi-Square Goodness-of-fit test. The soil charac- teristics were analyzed by paired analyses (t-test) for each year. An analysis of variance test was also used to compare the year means, realizing, of course, that there is a loss of accuracy.
Results Vegetation
Species composition of the vegetation on the native and revege- tated range sites differed (Table 1) as there was much more blue grama (Bouteloua gracilis (HBK) Lag.) cover on the revegetated range than on the native range sites. There was less needle-and- thread (Stipa cornata Trim. and Rupr.) on the 1950 revegetated site and less junegrass (Koeleria cristata Pers.) on the 1925 revegetated site than on adjacent native range sites. The amounts of western wheatgrass (Agropyron smithii Rydb.) and the total of other grasses and sedges were similar on the revegetated range and the native range sites. The total vegetative ground cover of all grasses and sedges was similar on the revegetated and native range sites. Total ground cover of fringed sage (Artemisiu frigidu Willd.) was greater on the 1950 native range site than on the revegetated site. The ground cover of forbs was greater on the 1925 native range
site than on the revegetated site. Little clubmoss (Selaginellu densa Rydb.) was present only on the 1927 sites. There were more species recorded on the native range sites than on the revegetated range sites.
Total forage production was greater on the revegetated range than on the native range in both years (Table 1). Mean forage yields were from 73 to 94% greater on the revegetated range sites.
Below-ground biomass was consistently greater on native range sites than on revegetated range sites (Table 2). The greatest differ- ence, from 70 to 93%, occurred in the top 15-cm increment while the smallest difference was in the next 15- to 30-cm increment. Although the rootmass in the 0- to 15-cm increment of the native range next to the 1950 revegetated soil was considerably lower as compared to the other 2 native range fields, the examined chemical properties of the soil of the 3 native range fields were similar.
Soil
Total OM and total N of the revegetated soil were higher in the 1925 abandoned site than in the 1950 abandoned site (Table 3). However, this provided only limited information in terms of the composition of the OM. Although the 1950 revegetated soil had the lowest OM content, more of this OM was extractable by
Table 3. Characteristics of the organic matter of Ab horizons of native range and revegetated native range (average of four samples)
Year
of Status
abandon- of
ment range
Resin- Water-stable aggregates --,-
extract-
Organic Total able C >l.O Bulk Total Am
matter N
(%) (%) (&
Total mm density acio ar
HA/ FA’ (%) (%) (g/cm? (% of Total N)
Hvdrolysable N Poly-
ino Hexos- Ammo- . saccha- nine nium (mg/- rognase rides Dehyd-
IOOg) activity2
1925 Native Revegetated
1927 Native
Revegetated
1950 Native
Revegetated
S.E. of the 12 native samples 1925~s 1927 1950 vs
1925/ 1927
1.82** 0.148** 26.8 3.51 62.9 36.9 1.30 76 44 7 Is** 342 31
1.63 0.137 28.7 3.48 62.8 36.7 1.29 76 43 6 17 339 36
1.80** 0.151** 27.7. 3.54* 62.7 36.7 1.29 75 43 6 16* 347*+ 32**
1.54 0.135 32.3 2.97 64.3 36.1 1.29 77 44 7 17 273 42
1.84** 0.150.. 26.0. 3.51** 63.2** 37.1** 1.29 76’+ 45** 7*+ 15** 342** 29**
1.46 0.119 41.1 2.18 76.6 30.3 1.35 81 52 9 19 225 46
0.01 0.001 0.5 0.01 0.1 0.1 0.00 0.3 0.6 0.3 0.3 2 1
* * l *
* ** ** l * ** l * l * ** ** ** ** **
1Humic acid/Fulvic acid ratio.
Wehydrogenase activity was measured as nmol formazan.released/g dry soil/hour.
*,**Significantly different from adjacent revegtated range at PI 0.05 and PSl.01, respectively, as determined by the t-test.
chelating resin. The humic acid/fulvic acid ratios further con- firmed this change in composition of the OM. Dehydrogenase activity of the revegetated soil was lower in the 1925 than in the
1950 site.
of natural revegetation in grazed fields.
Even though the below-ground root material was less in the revegetated areas, above-ground productivity was greater partly because of the chemical properties of the soils.
Although the trend of the total water-stable aggregates did not correlate with the OM content of the soil, there was increased aggregation in the smaller-sized (Cl .O-mm) aggregate fraction dur- ing the early stages of revegetation. In the revegetated soil, bulk density, defined as the mass of dry soil per unit bulk volume, decreased from the 1950 to the 1925 site. Since there was no change in texture, the soil was thus more loose and porous in the 1925 site than in the 1950 site. This was also reflected in the change in the larger-sized (>l.O-mm) water-stable aggregates.
More N was released into solution by the 6N hydrochloric acid from the 1950 revegetated soil than from any of the other soils. Almost all hydrolysable N was accounted for by the sum of (amino acid + hexosamine + ammonium)-N in the 1950 revegetated soil but, with all other five soils, around 10% of the total hydrolysable N was not identified.
Rice and Pancholy (1972) found that inhibition of nitrification increased with the progress of succession toward the climax ecosys- tem. It thus appears likely that the greater inhibition of nitrifica- tion aids in the buildup of the available N in the form of ammonium-H (NHrN). Rice (1976) showed that the amount of NH4-N increased from a low in the first successional stage to a high in the climax, whereas the amount of nitrate-N (NOs-N) decreased from a high in the first successional stage to a low value in the chmax. The NHrN values in the present study were 2.12 and 4.82 pg/g (native range: 5.64 pg/g), while the NOs-N values were 6.35 and 3.52 pg/g (native range: 3.17 pg/g) for the 1950 and 1925 revegetated fields, respectively.
The roots of the 1950 revegetated field had the highest caloric content (Table 2). Still, the rootmass of the native range repres- ented a higher potential source of available energy than that of the abandoned fields returning to native range even after 55 years.
Discussion
The 3 pairs of native versus revegetated native ranges were not replicated by year because similarly treated, nearby abandoned fields were not available; historically, only a field was set aside. However, inasmuch as the data of the 3 native range sites generally demonstrated good agreement and the recovery data always sequentially approached the native range data (Table 3), it is reasonable to accept the data from the revegetated native ranges as representative of their position in the successional sequence.
Dormaar and Ketcheson (1960) noted that corn roots in NH4-N treated soils exhibited greater ramification than those in NOsN treated soils, while Bosemark (1954) established that at increased NOs-N levels an inhibition of root growth of wheat was the result, in part, of reduced cell multiplication. It may thus be postulated that both increased above-ground biomass, caused by the probable higher over the season NOs-N levels in the revegetated soils, (i.e., earlier in the successional stages), and increased rootmass, caused by higher over the season NHI-N levels, (i.e., at the climax ecosys- tem stage), are credible observations.
More than 55 years are required for the revegetated, abandoned crop fields to approach native range conditions if they are moder- ately grazed after abandonment, even though the 1925 field was only cultivated for 15 years. On the revegetated sites the high proportion of blue grama indicates that this grass is more plentiful during succession than at climax. This study supports the conclu- sions of Whitman et al. (1943) that 60 years or more may be required for the development of climax vegetation by the process
An alternative explanation for increased above-ground biomass on the revegetated fields would be the increased mineralization of N in the organic matter during the period of cultivation of the prairie range. Since a large percentage of the OM in Brown Cher- nozemic soils is still only partially decomposed (Dormaar 1975), there is a potential for considerable mineralization. Cycles of dry- ing and wetting will further enhance this mineralization process. It is likely that both mechanisms, i.e., the effect of the NOs/NH4 ratios and increased mineralization due to the period of cultiva- tion, contributed to the increased above-ground productivity. Schuman et al. (1984) showed that a significant loss in organic C and N occurred as a result of 5 years of cultivation when compared to native range sites.
On the basis of the decrease in OM extractable by chelating resin, increase in the humic acid/fulvic acid ratios, and increased aggregation further along the successional sequence, it may be