IMPACT OF CONDITIONAL CASH TRANSFER PROGRAM ON HOUSEHOLD
CONSUMPTION IN KITUI COUNTY
WILSON ONYANGO ODUOR
A RESEARCH PROJECT SUBMITTED TO THE SCHOOL OF ECONOMICS,
DEPARTMENT OF ECONOMIC THEORY IN PARTIAL FULFILMENT FOR THE AWARD
OF MASTERS IN ECONOMICS (POLICY AND MANAGEMENT) OF KENYATTA
UNIVERSITY
ii
DECLARATION
This research project is my original work and has not been presented for a degree or any other
award in any university.
Signature: ……….…… Date: ………..….
Wilson Onyango Oduor
Bsc (Economics & Mathematics)
Reg. No. K102/CTY/PT/22803/2012
This research project has been submitted for review with my approval as university supervisor.
Signature: ……… Date: ………
Julius Korir (PhD)
Economic Theory Department
School of Economics
Kenyatta University
iii
DEDICATION
iv
ACKNOWLEDGEMENTS
In the first place, I want to express my gratitude and praises to our Almighty God for bringing
me this far. In a very special way, I want to sincerely thank Dr. Julius Korir who has been my
supervisor, and source of inspiration and guidance during the development of this manuscript.
Also am grateful to Dr. Shadrack Mwilaria for his support and great contributions towards this
work; their advice and encouragement enabled me to soldier on. My gratitude also goes to the
entire School of Economics, Kenyatta University fraternity both teaching and non-teaching staff
for their invaluable inputs to this study. Though it would be invidious to mention all of them by
names, many of my colleague students in Kenyatta University and workmates have been behind
the success of this paper. In particular I thank Thomas Lelekoitien, Cassim Zuberi and all other
staff of National Drought Management Authority, United Nations World Food Program,
ActionAid-Kenya and Catholic Diocese of Kitui for making this work a success. To all those
who contributed both knowingly and unknowingly to this work I’m so indebted to you. Thanks
also to Dr. Samuel Muthoga and Silvanus Okumu among others for their willingness to read,
comment and improve this paper. They are however not responsible for any omissions or errors
v
TABLE OF CONTENTS
DECLARATION ... ii
DEDICATION ... iii
ACKNOWLEDGEMENTS... iv
TABLE OF CONTENTS ... v
LIST OF TABLES... vii
LIST OF FIGURES ...viii
ACRONYMS AND ABBREVIATIONS ... ix
OPERATIONAL DEFINITION OF TERMS ... xi
ABSTRACT ... xii
CHAPTER ONE: INTRODUCTION ... - 1 -
1.1 Background ... - 1 -
1.1.1 Conditional Cash Transfer Programs Globally ... - 1 -
1.1.2 Conditional Cash Transfer Program in Kenya ... - 3 -
1.1.3 Conditional Cash Transfer Program in Kitui County ... - 5 -
1.2 Statement of the Problem ... - 9 -
1.3 Objectives of the Study ... - 10 -
1.4 Working Hypothesis ... - 11 -
1.5 Significance of the Study... - 11 -
1.6 Scope of the Study ... - 11 -
CHAPTER TWO: LITERATURE REVIEW ... - 12 -
2.1 Introduction ... - 12 -
2.2 Theoretical Literature ... - 12 -
2.2.1 The Modern Model of Consumption ... - 12 -
2.2.2 The Certainty Equivalent/Perfect Foresight Model ... - 14 -
2.2.3 Theory of the Consumer ... - 15 -
2.3 Empirical Literature ... - 20 -
2.4 Overview of the Literature ... - 26 -
CHAPTER THREE: RESEARCH METHODOLOGY... - 28 -
vi
3.2 Research Design ... - 28 -
3.3 Theoretical Framework ... - 29 -
3.3.1 Identification of the Impact ... - 30 -
3.4 Model Estimation ... - 34 -
3.5 Definition and Measurement of Variables ... - 37 -
3.6 Study Area ... - 39 -
3.7 Data Types and Sources ... - 40 -
3.8 Data Collection ... - 40 -
3.9 Data Analysis ... - 40 -
3.10 Diagnostic Tests ... - 41 -
CHAPTER FOUR: EMPIRICAL FINDINGS ... - 41 -
4.1 Introduction ... - 41 -
4.2 Summary Statistics ... - 41 -
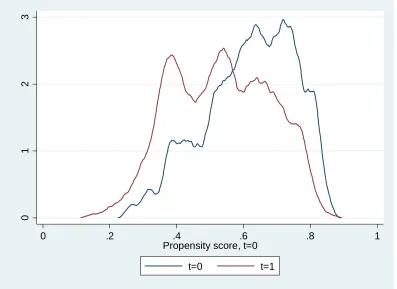
4.3 Propensity Score Estimate ... - 44 -
4.4 Average Impact of Participation in the Conditional Cash Transfer Program ... - 49 -
4.4.1 Impact of CCT on Consumption Expenditure of Program Beneficiaries ... - 51 -
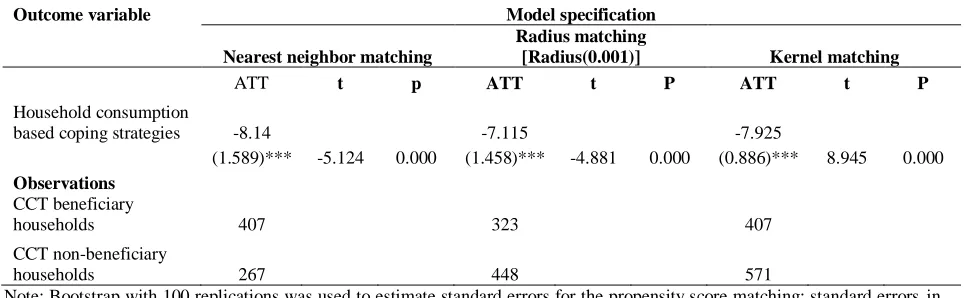
4.4.2 Impact of CCT on Consumption Based Coping Strategies of Program Beneficiaries ... - 52 -
CHAPTER FIVE: SUMMARY, CONCLUSIONS AND POLICY IMPLICATIONS ... - 55 -
5.1 Introduction ... - 55 -
5.2 Summary ... - 55 -
5.3 Conclusions ... - 57 -
5.4 Policy Implications ... - 58 -
5.5 Areas of Further Research ... - 60 -
REFERENCES ... - 60 -
vii
LIST OF TABLES
Table 3.1: Definition and Measurement of Variables ... - 37 -
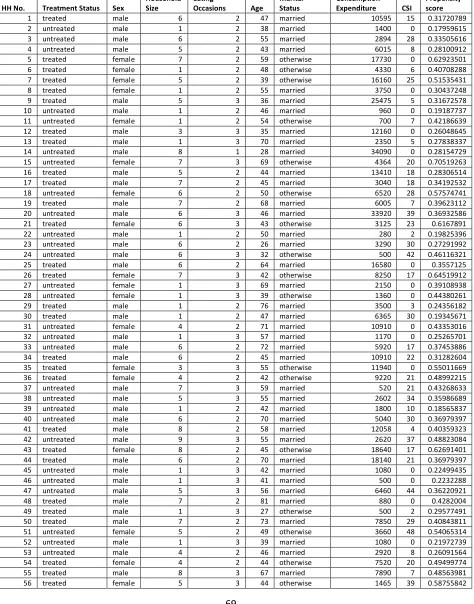
Table 4.1: Sex and Marital Status of Household Head, and Household Eating Occasions per Day ... - 42 -
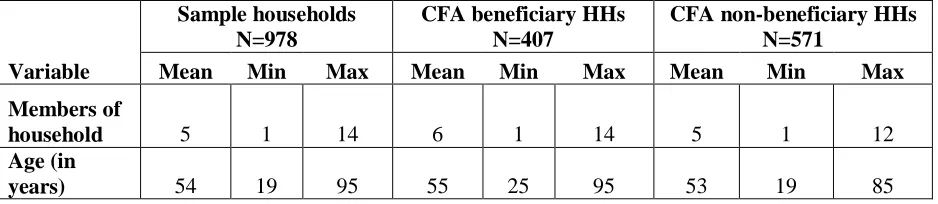
Table 4.2: Household Size and Age of Household Head ... - 43 -
Table 4.3: Total Consumption Expenditure and Consumption Based Coping Strategy ... - 43 -
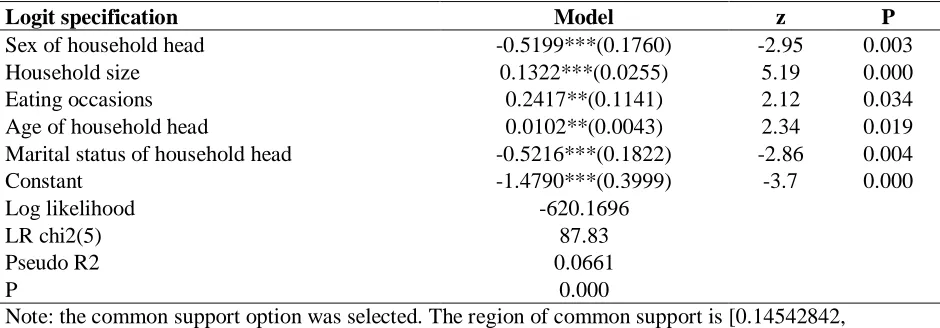
Table 4.4: Logit Estimates for Participating in the Conditional Cash Transfer Program (n=978) ... - 46 -
Table 4.5: Description of Estimated Propensity Score in Region of Common Support ... - 46 -
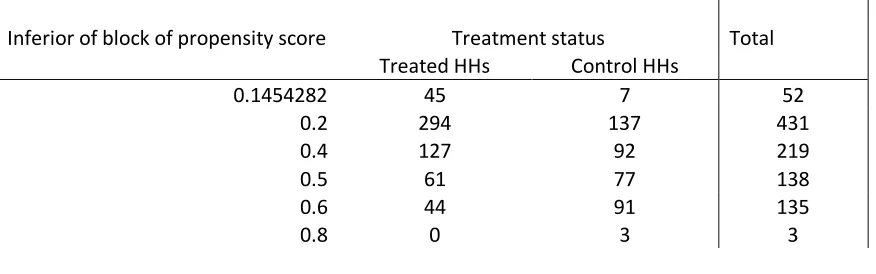
Table 4.6: Distribution of Treated and Control Households Based on the Propensity Score ... - 47 -
Table 4.7: Estimates of the Impact of CCT on Consumption Expenditure of Program Beneficiary ... - 51 -
Table 4.8: Estimates of Impact of CCT on Consumption Coping Strategies of Program Beneficiary .. - 53 -
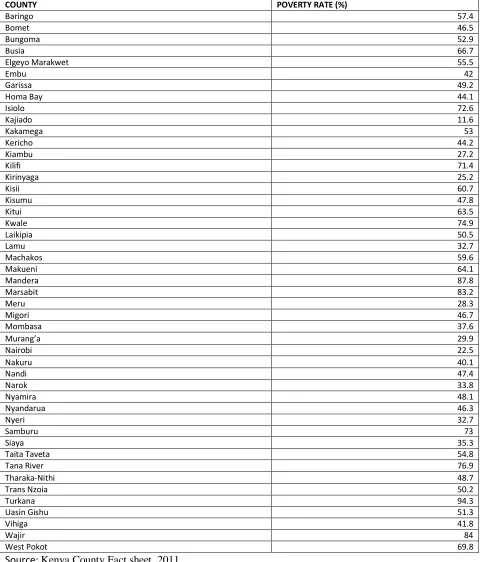
Table A1: Poverty Rates for Counties in Kenya ... - 68 -
viii
LIST OF FIGURES
Figure 1.1: Poverty Rates among Kenya’s Counties based on KIHBS 2009 data. ... - 8 -
ix
ACRONYMS AND ABBREVIATIONS
AAIK ActionAid International – Kenya
ALRMP11 Arid Land Resource Management Program 11
ASAL Arid and Semi-arid land
CARITAS – KITUI Catholic Dioceses of Kitui
CCT Conditional Cash transfer
CFA Cash for Asset
CT-OVC Cash Transfer for Orphans and Vulnerable Children
DID Difference in Difference
EMOP Emergency Operations Programs
FFA Food for Asset
FSOM Kenya Food Security and Outcome Monitoring
GDP Gross Domestic Product
GFD General Food Distribution
GoK Government of Kenya
HHs Households
KFSSG Kenya Food Security Steering Group
KIHBS Kenya Integrated Household Budget Survey
MODNKOAL Ministry of Development of Northern Kenya and Other Arid Lands
NDMA National Drought Management Authority
OPCT Older Persons Cash Transfer
OVC Orphan and Vulnerable Children
x
PSM Propensity Score Matching
RDD Regression Discontinuity Design
SDGs Sustainable Development Goals
UNICEF United Nations International Children’s Fund
xi
OPERATIONAL DEFINITION OF TERMS
Conditional cash transfers: is cash payment to poor families or individuals after satisfying
certain behavioral conditions also referred to as conditionality’s like working on community
assets.
Household: a person or a group of individuals residing in the same compound, liable to the same
household head, and share a common source of food (and/or income).
Household final consumption expenditure: market value of all goods and services
(incorporating durable products) purchased by households.
Consumption based coping strategies: is the strategies adopted by households to cope with
lack of food and/or money to buy food.
Consumption based coping strategy index (CSI): is a tool that measures what households do
when they cannot access food. It is constructed from a list of behaviours (consumption based
coping strategies). The CSI is a combination of the frequency of each strategy and their severity
for households who reports food consumption problems. A higher CSI reveals a worse household
consumption and vice versa.
xii ABSTRACT
- 1 -
CHAPTER ONE
INTRODUCTION 1.1Background
1.1.1 Conditional Cash Transfer Programs Globally
International development community and developing countries have stepped up their efforts to
boost and redirect resources so that they can attain certain development objectives of reducing
poverty and promoting human capital investments. Among these efforts, the conditional cash
transfers (CCTs) schemes have been the majorly used approach to achieve these objectives.
Capitalizing in human capital of poor household is generally perceived as a vital strategy in
alleviating poverty principally in the long term. There is also a need for CCTs to safeguard
households outside poverty and its effects throughout the period of economic growth (Maluccio,
2007; United Nations, 2012; World Bank, 1997).
Conditional cash transfer schemes have developed to become an adopted social policy across the
world. Despite the fact that only few of these programs existed in late 1990s, there has been a
stagy escalation in the coverage and number of CCT schemes in 2000s (World Bank, 2009).
Even though the designs of certain program may differ with country, the majority of CCT
programs exhibit common features of ensuring beneficiary households are fulfilling specific
behavioural conditions. CCT uses an integrated approach to poverty reduction where there is a
balancing between short term target of social support, and long term goal of human capital
formation. The notion behind CCT schemes is to give poor households cash payments
conditional to participate on socially needed behaviors like working on community assets. The
combination of conditionality’s and cash permits CCT schemes to enhance household
- 2 -
promotes more healthier, educated and productive future generations. The end result of this is
insulating the society and economy at large against the intergenerational transmission of poverty
(Arnold, Conway and Greenslade, 2011; World Bank, 2009).
Mexico’s progresa program was the first CCT program to be initiated in 1997 whereby
approximately 300,000 households benefited from it. It was later expanded to cover up to around
five (5) million households in 2001, a period during which the program was renamed as
Oportunidades. Evaluation of progresa program found that the program had produced significant
improvements in school enrolments, drops in illness and malnutrition among children’s; and
poverty reductions (Fiszbein et al., 2009; Marshall and Hill, 2015; Rawlings and Rubio, 2003).
With the proof that CCT programs are very effective in helping poor families, many countries in
Latin America have embraced them as a key instrument of their social policy. Most of studies on
the impact of CCT schemes have been conducted in developed countries whereas less developed
nations have only registered a handful of such researches in addition to minimal use of such
program among these low income nations. Much of the existing literature on impact evaluations
of CCTs programs are in favor of these programs. Benefits have been reported ranging from
increased school attendance to increased savings and investments among others (Bassett, 2008;
Soares, Osorio, Soares, Medeiros and Zepeda, 2007).
The use of CCT to support vulnerable households in developing nations especially in Africa has
been extensive. Banerjee et al. (2015) study covered India, Ghana, Ethiopia, Honduras, Pakistan,
and Peru. The study showed support programs improve livelihoods of poor households. These
programs combines productive assets transfer with consumption support, training and coaching
- 3 -
In Uganda for example, a government initiated program was designed to help the unemployed
and/or the poor become self-employed artisan, rise their income and thus encourage social
stability. Young adults who had been affected by conflict from Northern Uganda were invited to
form groups and make submission of grant proposals towards vocational training and business
start-up. The program was shown to help the participants increase their business assets by 57
percent, hours of work by 17 percent and earnings by 38 percent. Many of beneficiaries also
managed to formalize their business and hire labor (Blattman, Fiala and Martinez, 2013).
Baird, Chirwa, McIntosh and Özler (2010) also revealed that CCT program focusing on school girls in Malawi led to a fall in sexual activity and its onset among the beneficiaries relative to non-beneficiaries.
1.1.2 Conditional Cash Transfer Program in Kenya
As a result of the then prevailing poverty and existing evidence that CCT programs had helped
poor families, the Government of Kenya initiated the CCT program that combined human capital
investments with access to social safety net (Republic of Kenya, 2012). Cash Transfer for
Orphans and Vulnerable Children (CT-OVC) was the first CCT scheme to be instigated in
Kenya. CT-OVC began in 2004 on a pre-pilot phase and first covered 500 orphan and
vulnerable children (OVC) households in three districts of Nairobi, Garissa and Kwale before
expanding countrywide. Each household was receiving Ksh.500 per month. The program then
expanded to support 246,000 households in all the 47 counties in the financial year of 2015/2016
(Republic of Kenya, 2017). The objective of this program was to give frequent cash transfer
payments to families living with OVC so that it can promote human capital development and
- 4 -
on consumption, school enrollment, and health outcomes. The study also found that households
were using program transfers mainly for health and food related spending (Ikiara, 2009). By the
end of 2012, Hunger Safety Net Program (HSNP) and Older Persons Cash Transfer (OPCT)
were the two other main cash transfer programs in Kenya which were being implemented jointly
by the Government of Kenya (GoK) and a number of development partners (Republic of Kenya,
2012).
In Kenya, social protection expenditures rose from Ksh.33.4billion to Ksh.57billion between
2005 and 2010. In particular, spending on safety nets escalated from Ksh.11.9billion to
Ksh.20.5billion; with much of this spending engaged to social cash transfer programs from 2009
onward (Republic of Kenya, 2012). The GoK also established the social protection fund in order
to simplify cash transfers and credit accessibility in a bid to ensure poor and vulnerable
individuals in the society attain a meaningful and better quality of life. The funds allocated for
social protection of older persons rose by 57.7 percent that is from Ksh.5,051.5 million in
2014/2015 to Ksh.7,966.3 million in 2015/2016. The direct cash disbursed also rose by 49.8
percent to Ksh.7, 334.5 million in 2015/2016 as a result of an increase in the targeted
beneficiaries. In addition, the funds allocated for OVC also increased by 63.6 percent from
Ksh.5,957.6 million in 2014/15 to Ksh. 9,746.3 million in 2015/2016 (Republic of Kenya, 2016).
In Kenya, consumption is the most immediate element associated to individuals (households)
welfare and is also the largest element of Gross Domestic Product (GDP) (Crossley, Low and
O’Dea, 2013). Household final private consumption expenditure contributes about 70 percent of
the overall GDP increase in Kenya, with food and beverage contributing about half of this
- 5 -
in Kenya (Republic of Kenya, 2010). Consumption expenditures indicates the goods and services
a household can command based on its current income. This includes whether a household can
access credit markets and/or household savings when its current income is low (or even negative)
perhaps as a result of harvest failure and/or seasonal variation. Inadequate food consumption can
lead to serious implications for health, mental ability of children, and often results to social
problems like crime among others (Republic of Kenya, 2011a). Actual consumption is therefore
connected to the wellbeing of a person’s in the sense of consuming enough to meet current basic
needs. The consumption decisions and spending habits of households can also help us to predict
how consumers react to changes in income and give a clear picture of actual living standards.
Therefore, consumption is a crucial element of the overall human wellbeing that if well catered
for, consumption is itself an important indicator of the milestone reached on the path towards
complete poverty alleviation as development priority (Kumar, 1989; Swindale and Vachaspati,
2005).
1.1.3 Conditional Cash Transfer Program in Kitui County
Since 2001, Kitui County has been under food assistance operations. Between 2004 and 2009,
Emergency Operations Programs (EMOP) funded by United Nations World Food Program
(WFP) was introduced in Kitui County. This program involved a combination of General Food
Distribution (GFD), Food for Work, Emergency School Feeding Program (ESFP) and
Supplementary Feeding Programs (SFP). In 2009, a consultancy was launched by WFP and it
recommended among other issues the restructuring of the EMOP’s. Also as a result of the
lessons learned from the recurrent and prolonged drought in Kenya’s arid and semi-arid (ASAL)
districts in August 2009, it led to the restructuring and implementation of a long term recovery
- 6 -
complementary components namely: GFD, Food for Assets (FFA) and SFP. The main objectives
of PRRO was to enable communities to access water at reduced distance, improve diversification
of food sources, improve pasture and crop production, reduce environment degradation, improve
access to markets and other sources of food and enable households to become food secure.
The first PRRO ran from August 2009 to April 2012, with the FFA component of PRRO being
mainstreamed in the Kenya Government Drought Management and Recovery Structures housed
under the Arid Land Resource Management Program 11(ALRMP11)/Ministry of Development
of Northern Kenya and Other Arid Lands (MODNKOAL) and its successor the National
Drought Management Authority (NDMA). This development formed a shift in the mode of
operation. The Cash For Asset (CFA) program was then launched as a pilot to test a different
approach for delivering assistance in the FFA program. CFA became operational from May 2012
to April 2015, with the next phase running from May 2015 to April 2018. CFA program assists
beneficiaries to develop assets that live beyond the food distribution period. Some of these
structures include water pans, earth pans and farm ponds created to harvest water for both human
and livestock use. This project also promotes technologies in soil and water conservation
structures such as zai pits, terraces and retention ditches that are constructed in farms and water
catchment areas.
Seasonal food needs assessment is usually done after every rain season by Kenya Food Security
Steering Group (KFSSG) jointly with the County Steering Group (CSG); this gives
understanding on food security situation in Kitui County. Information gathered from this
assessment is then disintegrated into different levels of food insecurity for better intervention
- 7 -
transfers and supplementary feeding to the vulnerable households and beneficiaries. KFSSG
usually determines the areas across the country that will be covered and the food aid beneficiary
numbers per locality within the targeted Sub Counties. The CFA program is then implemented
by Cooperating Partners (CP) in collaboration with relevant GoK in-line technical departments
and other development partners. In Kitui County, ActionAid International-Kenya (AAIK) and
CARITAS-Kitui are the implementing agencies. The targeted communities form the biggest
contributors in the project as they do the actual selection, prioritization and implementation of
activities. Election and training of Community Relief Committee (RC) is usually conducted by
CP’s together with GoK officers. The criterion for selection of beneficiary households is usually
determined by the community with guidelines from the Community Targeting and Distribution
manual (United Nations World Food Program and Republic of Kenya, 2010). Registration of
beneficiaries is then carried out by elected RCs on basis of entire household units. All
dependents’ names and ages among other details are included in the register.
This study therefore intended to measure the impact of CCT scheme on household consumption
in Kitui County. Kitui County is among the poor counties in Kenya with about 63.5 percent of its
population living below poverty line. The national poverty level stands at 45.9 percent. It is also
worthwhile noting that the County’s populace is still in total reliance on nature for its survival
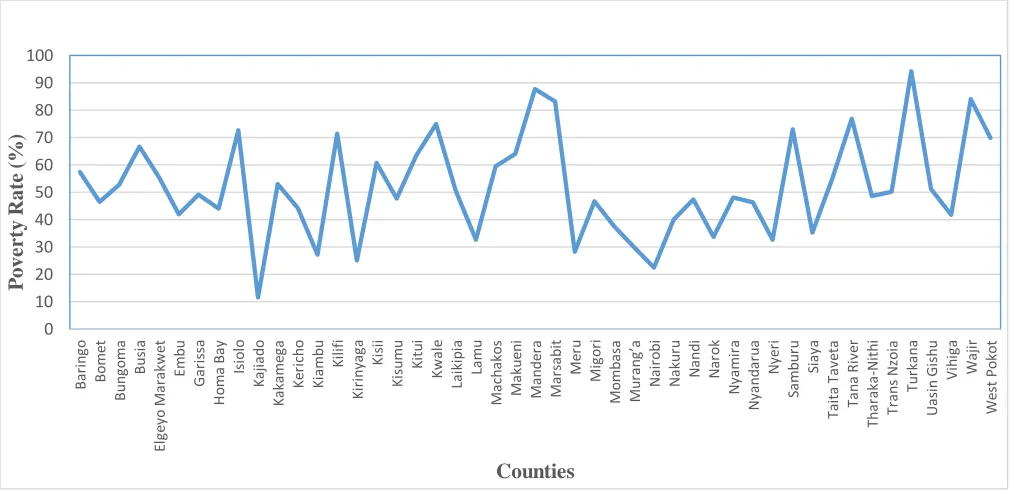
(Republic of Kenya, 2009; Republic of Kenya, 2014). Figure 1.1 and Table A1 appended show
- 8 -
Figure 1.1: Poverty Rates among Kenya’s Counties based on KIHBS 2009 data.
Source: Kenya County Fact Sheet, 2011
From Figure 1.1 and Table A1, it can be depicted clearly that Kitui County is more vulnerable to
poverty than most of the counties in Kenya. According to the Republic of Kenya (2011b), this
County is ranked as 13th poorest county in the entire Kenyan nation. The high poverty rate in the
County is largely attributed to drought and water scarcity experienced in the region yet the
county heavily depends on nature (Republic of Kenya, 2014). Due to highly devastating poverty
in Kitui County among other Arid and Semi-Arid lands (ASAL), myriad initiatives by several
organizations both governmental and non-governmental have been instituted to arrest the
situation. A good example is the Cash for Asset (CFA); a joint GoK and WFP conditional cash
transfer scheme designed to reach food insecure households in ASAL region in Kenya. The CFA
recipients normally work on community assets so as to build their resilience against drought. The
program targets about 171,100 poorest households in Kitui County and aims at meeting
immediate food needs through increased production and diversification of food sources hence
- 9 -
increase household consumption expenditure and protect households from adverse coping
mechanisms. According to CFA Monthly Narrative Reports, approximately Ksh.67 million is
being spent every month on over 27,000 beneficiary households in Kitui County. Although the
program has been implemented for quite some time, its impact is yet to be assessed.
1.2Statement of the Problem
Consumption is the largest element of gross domestic product and a very immediate element
associated to the welfare of individuals and households. Article 43(3) of the Kenya’s
constitution, it obliges the state to give suitable social security to individuals (households) who
are not able to support themselves and their dependents (Republic of Kenya, 2010). The GoK has
therefore devised policies tailored at capacity enhancement and creation of opportunities for poor
and vulnerable individuals in order to help them to sustain and improve their welfare, livelihoods
and lives. This objective is attained especially through enabling income earners and their
dependents to secure a reasonable income level by means of decent work. In addition, such
policies also ensure that individuals access affordable social assistance, social security and health
care services (Republic of Kenya, 2011c). Kitui County is among counties in Kenya falling
under ASAL regions in the country benefits from CFA among other intervention program being
implemented. This program was started in Kitui County in the year 2012. According to CFA
Monthly Narrative Reports, approximately Ksh.67 million is being spent on monthly basis to
over 27,000 beneficiary households in Kitui County.
Despite these and other multiple interventions skewed towards income improvement and
promotion of consumption (an essential element of the overall human well-being) in Kitui
- 10 -
about 63.5 percent of Kitui populace is still living below poverty line whereas the national level
is 45.9 percent (Republic of Kenya, 2009; Republic of Kenya, 2014). The dilemma is whether
the efforts of CFA have been successful or not in bearing significant fruits in the fight against
poverty and general welfare of the targeted households within Kitui County. Given the itching
poverty levels in Kitui County where the CCT program has been operational despite the
overemphasis on the benefits of the CCT program and yet most studies conducted have been in
foreign country, hardly any study has been conducted in Kitui County pertaining the subject
under investigation. Persistent championing for unexamined program may be unhealthy in the
eyes of economists to both implementers and beneficiaries. With that intuition, this study was
commissioned to perform an evaluation of the impact of CCT scheme on consumption among
program beneficiaries in Kitui County, an area that has received little attention from previous
researchers yet it is of great economic concern given the objectives it is instituted to achieve.
1.3 Objectives of the Study
The general objective of this study was to measure the impact of conditional cash transfer
program on household consumption in Kitui County.
Specific objectives were:
i. To determine the impact of conditional cash transfer on consumption expenditure of
program beneficiaries.
ii. To establish the impact of conditional cash transfer on consumption based coping
- 11 - 1.4 Working Hypothesis
Ho1: Conditional cash transfer has no effect on consumption expenditure of program
beneficiaries.
Ha1: Conditional cash transfer has effect on consumption expenditure of program beneficiaries
Ho2: Conditional cash transfer has no effect on consumption based coping strategies of program
beneficiaries.
Ha2: Conditional cash transfer has effect on consumption based coping strategies of program
beneficiaries
1.5 Significance of the Study
This research paper aimed at assessing the impact of CCT program on consumption of program
beneficiaries. Other than extending on existing literature in the study area, the findings of this
study may also contribute towards better research and development strategies and policies on
safety nets not only in Kitui County but also in other regions where conditional cash transfer
(CCT) and/or related programs are operational. These findings will also be useful in the
development of social protection policies centered towards provision of money to vulnerable or
poor households with the aim of enabling them to move out of poverty.
1.6Scope of the Study
The study was conducted to establish the impact of CCT on consumption by a household in Kitui
County benefiting from the program. The paper focused on Cash for Asset beneficiary
households in 113 final distribution points (Villages) in Kitui County for the year 2013 to 2014.
- 12 -
above the national average as well as it is a constituent region of the ASAL which are benefiting
from the CFA program.
CHAPTER TWO
LITERATURE REVIEW 2.1 Introduction
Theoretical and empirical literature related to proposed study is presented in this chapter.
2.2 Theoretical Literature
The discussion under this section is centered on the theory of the consumer. The section
discusses theories of consumption and thus utility.
2.2.1 The Modern Model of Consumption
This model traces its origin from the seminal contribution of Modigliani and Brumberg (1954).
The resulting model had a number of features such as: utility is times separable i.e. the utility
yielded by consumption in the present is independent of consumption levels in other periods be it
in the future or past time. Utility in the future is geometrically discounted such that utility one
period in future is worth β units of utility today, while utility two periods from now is worth
and so forth where β lies between 0 and 1. Additionally, this utility function must meet certain
criteria like diminishing marginal utility, diminishing absolute risk aversion etc. the model must
also incorporate a rigorous mathematical expression on how capital income, non-capital income
- 13 -
The consumer aims at maximizing his expected discounted utility for the periods t,..,T where t and T are current and final periods of life respectively. This can be expressed as:
(2.1)
where over the implies uncertainties in the values it takes at the time when expectations are
made. Equation (21) is solved subject to:
(2.2)
(2.3)
(2.4)
(2.5)
Where is the wealth at the beginning of next period and is equivalent to resources not spent
in period t accumulated at a gross interest rate which is potentially uncertain; is
noncapital/labor income earned in period t+1 which is equivalent to (permanent labor
income) multiplied (mean-one transitory shock); permanent labor income
between periods grows by a factor G which also has the potential of being subjected to shocks
; plus gives the cash-on-hand in period t+1.
It was discovered in 1960s and 1970s that in the presence of uncertainties about labor income
levels in future i.e. if the variances of ϵ and N are greater than zero, it proves impossible (under
reasonable assumptions of a utilty function, for example constant relative risk aversion
- 14 -
parameters of the model. It should further be noted that this approach to consumption is
modelled under the framework of permanent income hypotheses. Given that this study focused
on CCTs which are not necessarily permanent and the lack of explicitness in the solution for
consumption, this model was invalidated for this study
2.2.2 The Certainty Equivalent/Perfect Foresight Model
This model was developed to remedy the implicitness of the uncertainty model. There are two
cases for this model where the solution for the model can be done analytically. The first case is
the perfect foresight where uncertainty is ignored. The second case is the certainty equivalent
version where it is assumed that the utility function for consumers is quadratic in nature implying
that increase in consumption increases utility but beyond a certain level, utility starts to decline
as consumption goes up (a violation of the non-satiation property of a well behaved utility
function). The two cases are argued to give the same solution (Carroll, 2001). Thus only the perfect foresight is summarized here. In this model, optimal consumption and total wealth are directly proportional. Total wealth is found by summing market wealth with human wealth . Consumption can be expressed as:
(2.6)
Where, , the real financial capital is whereas is majorly current as well as future labor
income after discounting. also captures transfer payments. is the constant of
proportionality which depends on interest rate, time preference rate among other factors.
- 15 -
Both of the aforementioned theories i.e. modern converge to the view that consumption is a function of income. More so, there is explicit indication that consumption is not an end on its own but a means by which consumer derive utility. This leads to the general theory of the consumer which this study drew heavily from both directly and indirectly.
2.2.3 Theory of the Consumer
The development of classical economic thinking’s in the eighteenth century in England marked
the initiation of an explicit thought upon consumption (Lancaster, 1975; Nelson and Consoli,
2010). Adam Smith proclaimed consumption as a solitary end and a reason behind production.
The orthodox consumer theory defined consumption as the use of goods and services to fulfill
immediate needs. This theory assumes utility resides in the goods and services themselves.
In the consumer theory, a consumer is assumed to be rational and that, he pursues to maximize
his level of satisfaction (in this case utility) given his budget constraint (i.e. income). A utility
function is therefore believed to be a representation of several consumption bundles that gives a
consumer equal level of utility (Satisfaction).
The consumer theory also assumes that the commodity prices and individuals income do not
change for the duration under consideration (for example one month) when examining
consumer’s behavior while making a choice. Furthermore, a consumer selects consumption
bundle for the month in a single decision. Basing on rationality assumption, consumer is capable
of ranking consumption bundles according to favorites (preferences) and chose the one with the
- 16 -
In General, the basic assumption is that a consumer has useful investigative features that make it
possible to rank consumption bundles and hence able to express preferences or indifference
when two or more consumption bundles are at his disposal (completeness property). In addition
to the completeness property, non-satiation property is another property of a rational consumer.
Non-satiation property implies that more is preferred to less since the commodities consumed
and modeled here are goods and not bad. It is also useful noting that as either price(s) or income
change, a consumer will re-define his optimal choice. The implication of this is that prices can be
used to assess welfare benefits of the policy proposals which would bring about changes in
consumption (Perloff, 2013; Varian, 2010).
Consumer preference properties and their relevance are questionable because consumers
normally lack complete knowledge of goods and services. A good example is the completeness
property which implies that, “the consumer has absolute and perfect information of the goods as
well as foresight into the future as it affects his consumption plans” (Varian, 2010). Consumers
are also assumed to be in a position to match all goods available in the market currently and in
the future. The justification of these assumptions is unconvincing and perhaps impossible. Other
than the questionable consumer preference properties, the other thinking that is of great concern
is the reason as to why utility stays stable along an indifference curve. With the assumption of
substitutability of goods; it is argued that, when a consumer due to changed circumstances opts
to alter his choices so that he consumes different consumption bundles that lie on the same
indifferent curve, utility attained is equal in either case.
The consumer theory it does not also explain what is meant by the term “preference”, how these
- 17 -
individuals (households). Detailed knowledge of the consumer’s preferences is therefore needed
in order to forecast the choice of a bundle in a given situation. Thus to assess the impact of CCT
on the wellbeing of economic agents, it is assumed that economic agents (individuals or
households) have well defined preference.
The concept of consumer surplus is one way used in approximating consumer welfare (impact).
The meaning of consumer surplus is given in two statements by Hicks, one derived from
Marshall and the other his own. In Marshallian’s own terminology, consumer surplus is defined
as additional price which is being prepared to be paid by the consumer rather than going without
a thing (good and/or services), over which the consumer essentially does pay. In Hick’s
expression, consumer surplus is regarded as ways of expressing in the form of money income,
the benefits accrued to consumer due to a fall in price. In another way, consumer surplus is
compensating variation in income whose loss offset a price fall, leaving the consumer worse off
than before. (Henderson, 1941). This is regarded as the willingness to pay concept.
To facilitate a clear comprehension of the willingness to pay concept, it is worthwhile reviewing
some key concepts. These concepts are: indirect utility function (ID), Marshallian or ordinary
demand function (OD), expenditure function (EX) and finally compensating or Hicksian demand
function (CD).
Indirect utility function provides the maximum utility, attained when prices are and
income is . It is obtained by substituting the ordinary demand functions (OD) into a direct
utility function. This indirect utility function, can be expressed as:
- 18 -
The Marshallian demand function expresses the amount that will be demanded of any good when
prices are and income is equal to . This demand function can be given as:
. (2.8)
The ordinary demand function can be recovered from the indirect utility function. The tool that
simplifies this duality transition is known as the Roy’s identity (Darrough and Southey, 1977).
This Roy’s identity can be expressed as:
(2.9)
The expenditure function [ which is drawn by substituting the compensated demand
functions into expenditure equation gives the minimum expenditure incurred to obtain a given
utility level when prices are . This expenditure function can be expressed as:
(2.10)
Hicksian or compensated demand function derivation is based on the compensation concept.
This implies that following any price change, the consumer amends his income so that his utility
level is unaltered and thus moves along the same indifference curve. Ideally according to
Fuchs-Seliger (1990), it is possible to recover compensated demand function from an expenditure
function using the Shepherd’s lemma technique such that:
- 19 -
From equation (2.7) to equation (2.11), are units of good with corresponding prices
where Consumer’s income is represented by while is consumer’s expenditure.
and represent consumer’s direct and indirect utilities respectively.
As a result that utility remains constant along an indifference curve, uncompensated demand
curve cannot be used to measure welfare change. Instead, equivalent variation and compensating
variation are used to measure welfare change (Perloff, 2013). Equivalent variation (EV) is
quantity of money spent to an individual (household) with base prices and income that triggers
the same fulfillments as that produced by a price and income. EV can be compactly written as:
(2.12)
EV is also considered to be the sum of money the consumer would take in lieu of the price
change. EV evaluates the variance in achieving initial utility level, at initial and subsequent
prices.
Compensating variation (CV) measures planner’s net revenue on which the planner must
compensate the consumer for a price change as soon as it happens, leading the consumer back to
initial utility, ;
(2.13)
In equations (2.12) and (2.13), and represent initial and final price after a change
respectively. Analogously, and are respective income levels needed to attain the same
utility level before and after a price change. is indirect utility while is consumer’s
- 20 -
Compensating variation (CV) assesses disparity in achieving initial utility level at initial and
successive prices (Henderson, 1941). It is a negative sum on which the consumer will be willing to take from planner to permit a price change to occur. CV uses after change prices since it takes
place after changes in price and income.
In summary, government programs can amend the consumers’ budget constraint and thereby
affect consumer welfare. For example imposition of quota can lessen the number of units a
consumer buys. On the other hand, subsidies can trigger a rotation or parallel shift of budget
constraint. Note also that, welfare programs like conditional cash transfers may produce kinks in
consumer’s budget constraint hence causing an increase in the current income which is
influential on consumption (Dornbusch, Fischer and Startz, 1994). A rise in income due to
conditional cash transfer leads to a parallel shifts of the budget constraint which might increase
consumption of both normal goods and services.
2.3 Empirical Literature
This part gives a review of the studies which are related to the proposed study.
Attanasio and Mesnard (2006) assessed the short term impact of Colombian CCT program,
Familias en Acciꞌon on consumption and its components. This program was administered by
Colombian government and it targeted poorest households in chosen areas of rural Colombia.
The program aimed at nurturing human capital accumulation. The execution of this program
began in 2002 and by 2003 the program was fully operational in all targeted 627 communities.
This program offered diverse endowments conditional on certain types of behavior. For instance
recipient households received monthly nutritional worth about 15US$ if their children aged 0 to
- 21 -
received disbursement of about 5.5US$ for every child registered and attending on a regular
basis primary school. Mothers also received 11US$ for every child in secondary school. This
study relied on a sample of 11,500 households who lived in 122 towns (whereby 57 of these
towns were benefiting from this program while 65 were not). Data collection from these
respondents was done twice, that is in 2002 before treatment and in 2003 when the program had
run in a year. A combination of both difference in difference approach (DID) and method of
controlling observable difference at town level and individual was used in evaluating the
program participation effect on consumption. This was done by examining consumption prior (in
2002) and post (in 2003) program implementation. The findings of this study showed that, the
program had effectively increased total consumption and its components both in rural and urban
areas. Evaluation also depicted program contribution towards enriching quality of food taken,
that is households increased their consumption of food rich in proteins and cereals. Program
effects on consumption of adult goods (like alcohol and tobacco) were insignificant. The study
also found that, running Ordinary Least Squared (OLS) and Logit Regression on the survey
sample without correcting for selectivity bias led to overestimating the impact of conditional
cash transfer program on the households. This study like other related ones targeted poor
households and beneficiary households receive cash in condition of satisfying certain behavoural
conditions (i.e. when mothers took part in the program health component). Thus, there was
compelling need for a similar but area specific study to be conducted in Kitui County.
Maluccio (2007) examined the effects of CCT program, Red De Proteccio’n Social (RPS) in
Nicaragua on consumption, productive investments and labour allocation. RPS targeted poor
households in rural Nicaragua and was designed to supplement income in a household for three
- 22 -
rates, increase healthcare and reduce malnutrition for children below five years. Conditionality of
RPS was checking for households to confirm if their children were attending schools and visiting
protective health care givers. Households lost their eligibility if they failed to fulfill these
commitments. This study relied on data collected from 1764 randomly selected households (42
per locality in 42 localities) which comprised both program beneficiaries and non-beneficiaries.
These households were interviewed both before program implementation (in 2000) and in three
consecutive years after its implementation (i.e. in 2001, 2002 and 2003). The results from the
double difference estimation showed evidence of small increases in investments in economically
productive activities and negative effects on labor supply among beneficiary households. This
study like other related ones targeted poor households and beneficiary households receive cash in
condition of satisfying certain behavoural conditions (i.e. if beneficiary children were attending
schools and visiting protective health care givers). Thus, there was compelling need for a similar
but area specific study to be conducted in Kitui County.
Angelucci and Attanasio (2009) estimated the effect of urban component of Mexican CCT
program, Oportunidades on consumption. This program started in rural Mexico in 1998 but later
in the year 2003 it was expanded to urban areas. A selection criterion was based on a
predetermined poverty threshold. Data collection was done from 7320 households in 2002 before
program implementation and 6830 households after implementation for the years 2003 and 2004.
Lack of randomization in participation across urban areas and among participants necessitated
the use of DID method and instrumental variable (IV) estimators. Since there was low
participation rate, the researchers also estimated the average intention to treat (AIT). The study
found expected transfer was not adequate to persuade several qualified households to take part.
- 23 -
involvement in the program was as a result of low information regarding the presence of the
program among other features. Regarding the effects of the program, the study findings showed
that, treated households both in rural and urban areas consumed large proportion of grants. This
is because most likely associated to the fact that most participants were likely to be poor ones
with low saving and investment rates. This study was conducted in urban areas of Mexico and
generalization of its findings to Kitui County is most likely to be unreliable and/or misleading.
Angelucci, Attanasio and Maro (2011) estimated the effect of Mexican CCT program,
Oportunidades. The researchers used data collected in 2004, on similar households observed in
2002 and 2003. Propensity score matching method results using probit specification revealed a
significant impact of this program on consumption of durables and non-durable goods (especially
food). The program also increased savings and a fall in number and value of loans. A fall of
in-kind transfers was also noticed. Like other related ones, this study provide knowledge to
literature on handling missing data. This study was conducted in a developed country and thus a
need to conduct a study in the developing nations.
The Kenya CT-OVC Evaluation Team (2012) assessed the impact of Kenya’s CT-OVC on
human capital using randomized longitudinal design. The study used household baseline survey
done in 2007 and follow up conducted in 2009 in the six districts (That is Kwale, Kisumu, Suba,
Migori, Nairobi and Homa Bay). Four of these locations were eligible and two were control
locations. 2234 households were sampled of which two-thirds of these households were from
locations benefiting from the intervention. Kenya’s CT-OVC is the GoK program which was
reaching approximately 130,000 households and more than 260,000 OVC. GoK with technical
- 24 -
program in 2004. The objective of CT-OVC program was to give frequent cash transfer
disbursements to OVC households so as to promote retention and nurturing of children thus
promoting human capital development. Poor households and those containing OVC were
eligible. These households received a monthly flat rate transfer of Ksh.1, 500. Program
suitability lists compiled by Ministry of Gender, Children and Social Development in six
selected districts formed an evaluation sample. Households were surveyed in treatment and
control areas prior to their knowledge that they were program participants. Using DID approach,
the study found no program effects on primary age children; aged 6-12 years but there was a
statistically significant positive impact at secondary level; aged 13-17 years. This study was
centered on areas with low poverty rates than Kitui County hence need to evaluate related
program in a county that seems to have been trapped in poverty.
Cruz and Ziegelhofer (2014) investigated the impact of CCT program (Bolsa Familia) in Brazil on private household expenditure decisions in nutrition, health and education which was seen as
major contributor towards human capital development among children. Bolsa Familia started in
October 2003 and targeted poor households with conditions that they had to attend school or
health clinics. To examine household’s investment behaviors, the researcher relied on the
Brazilian household expenditure survey conducted between 2008 and 2009 by the Brazilian
Institute of Geography and Statistics. Samples of 190,159 households were surveyed using
questionnaires. In order to identify program causal effect, the researcher applied Regression
Discontinuity Design (RDD) method utilizing income eligibility threshold and number of
children as exogenous variables. The study found out that disproportionally to sum of cash
- 25 -
increase was more than what could have been anticipated if a corresponding Engel’s curve was
considered. This study was however conducted in Brazil but there is need for area specific one in
Kenya and possibly county specific.
Tembo, Freeland, Chimai and Schuring (2014) determined the impact of Zambia’s oldest social
cash transfer scheme on household welfare. This scheme was started in 2003. The aim of this
scheme was to reduce poverty among poorest households who had inadequate or no labour
capability. This study used data from Zambia’s oldest scheme, Kalome and the beneficiary
households were followed for a year. A combination of propensity score matching approach
(PSM) with fully efficient odds weighted regression results showed a positive effect of the
program on per capita consumption expenditure and discovered threshold effects with social cash
transfer impacting food expenditure among poorer beneficiary households and non-food
expenditure among wealthier beneficiaries. Like other relate ones, This study contribute to
literature on the potential method of handling missing data. Moreover, similar to most studies,
this study was conducted in a different country but there is need for country and region specific
study.
Using the Household Income and Expenditure Survey data, Begum, Alam, Haqu and Akter, (2015) conducted a study to estimate the productive impacts of cash transfer (allowance for the widowed, old age allowance, impoverished and abandoned women) and CCT programs (stipend for primary and secondary students, and a combination of Cash for work, food for works, vulnerable group development and 100 days employment scheme) in Bangladesh. The
endogenous variable were: changes in labor allocation; activities that generate income;
- 26 -
capital and coping mechanisms. The estimation was done using PSM with the results showing
that different outcomes are produced by different programs. The average treatment on treated
results showed positive and significant for activities generating income (farm), allocation of
labor (farm self-employment) as well as investment (agricultural inputs). Credit demand (coping
mechanism) was noted to decrease among the CCT beneficiaries. This research was conducted in
Bangladesh but there was need for replication of the same in Kitui County since both studies
handle missing data.
2.4 Overview of the Literature
The paper reviewed three theories (that is, modern theory of consumption, perfect foresight
theory of consumption and theory of the consumer), which assumed consumer as utility
maximizing agent. The modern theory is founded on the permanent income hypothesis where
windfalls do not alter consumption. In this model, explicit solution for consumption is
immeasurable. Since conditional cash transfer cannot be termed to be permanent income and
incalculability of the consumption refuted the use of this model in this study.
Perfect foresight model assumes the uncertainties and thus consumption is modeled under the
assumption that expectation are made with under the conditions of certainty. This model has a
quadratic utility function which implies that beyond a certain level of consumption, utility
diminishes as consumption goes up. This is a violation of the non-satiation assumption. This
model however, incorporates the effect of transfer payments and windfalls in the consumption
- 27 -
The researcher herein argued that consumption is not an end on its own but a means to the end;
with the end being utility maximization. This led to the third theory which draws much from the
two; this model is the theory of the consumer. In the consumer’s theory, a consumer is assumed
to pursue utility maximization objective. The utility function is well behaved i.e. it shows
non-satiation and completeness properties among others. In this pursuit however, a consumer faces
the constraint in the means (majorly income) by which consumption is financed. Thus the
theoretical model in this study was formulated in the framework of the theory of the consumer.
The chapter also reviewed several empirical studies related to conditional cash transfers and its
effects. These studies include Angelucci et al. (2011), Attanasio and Mesnard (2006), Cruz and
Ziegelhofer (2014), and Tembo et al. (2014) among others. Generally, it was revealed by these
studies that CCT programs help to increase consumption and alleviate poverty in addition to
general welfare improvement of the beneficiaries. Nevertheless, most of these studies were
conducted outside Kenya and hardly any within Kitui County. This study therefore sought to
particularly close the area specific research gap as well as reinforce on the beauty and superiority
of PSM over OLS and other methods that are likely to suffer selection bias when treatment in not
purely random.
This research paper also aimed at contributing to the growing literature on the estimation of the
impacts of CCT schemes in developing countries by providing evidence based on survey data at
household level. This paper also made another contribution through the application of Propensity
Score Matching (PSM) method in evaluating the impact of CCT program by combining variables
of consumption expenditure and consumption based coping mechanisms, for which experimental
- 28 -
CHAPTER THREE
RESEARCH METHODOLOGY 3.1 Introduction
This chapter presents research design, theoretical framework and model estimation. Chapter
three also discusses data types and sources as well as data collection and analysis.
3.2 Research Design
This study adopted a non-experimental research design relying on both qualitative and
quantitative cross sectional data for triangulation purposes. To facilitate achievement of the
research objectives outlined in chapter one, data was collected on consumption expenditure;
consumption based coping strategies, eating occasions, household size and treatment status.
Additional data used was on sex, age and marital status of household head. In similarity with
Begum et al. (2015) and Tembo et al. (2014) discussed in chapter two, since selection into the
- 29 -
period, impact evaluation of the objectives specified in chapter one relied on treatment impact
evaluation model using propensity score matching method.
3.3 Theoretical Framework
This study relied on the consumption theory. Under this theory, households are assumed to be
rational and thus modeled as utility maximizing agents. In the context of this study like in the
general economic sense, utility is used to imply the level of satisfaction derived by the
households from consuming goods and services. This modeling relies on both preference made
by a consumer and his possibility set. In line with conventional consumption theory, consumer is
assumed to possess steady preference system illustrated through utility function. Varian (1996)
developed consumer behavior theory through derivation of demand functions using preference
model (i.e. utility maximizing behavior of consumer facing economic constraints). According to
Varian (1996) in consumer behavior theory, given a set of feasible alternatives a rational
consumer usually picks the most preferred bundle. That is the utility maximization theory
adopted in this study. The consumer behavior is regularly presented in preferences and
possibilities terms. Therefore preference is the reason behind existence of demand functions
(Varian 1996).
An assumption of consumer preference on consumption bundles as to their desirability is made.
Such a consumer has to make decision about possible consumption bundle within the
consumption set, X. To allow preference system to order consumption bundles x in X, it is
assumed that such household has a set of axioms, that is preference is represented by continuous
utility function. The preceding discussion leads to the general assumption that, households are
- 30 -
The resulting general utility function can be specified as;
(3.1)
The maximization model requires that households should consume the bundle defined in
equation (3.1). Subject to the consumer’s budget constraint, any other possible bundle with
different values of other than those in equation (3.1) will not meet optimality condition as
they will yield lower utility comparative to those in the utility function defined in equation (3.1).
Budget constraint (specifying total expenditure, to be spent given prices, of
commodities indexed by where ) limits household consumption. Hence a standard
utility maximization: Subject to where xX (3.2)
Household consumption utility function is then obtained from standard constrained utility
function through capturing non-economic constraints like household demographic data
(Friedman and Sakovics, 2013). It is empirically impractical to capture all variables in this
modeling. Thus on behalf of household demographic factors, this study like other related ones
limited its scope on household head sex, age and marital status in addition to household size.
3.3.1 Identification of the Impact
To calculate the program treatment effect, this study followed Rosenbaum and Rubin (1983)
potential outcome framework for causal inference. In this framework, propensity score, on the
basis of all observed variables that jointly affect participation, and outcome of interest, is
first calculated. The prime goal here is to match households that receive conditional cash transfer
(treated) with households who have the same observable covariates, but do not receive the
- 31 -
key concern is therefore on how to locate individuals (households) who are similar in all
observable features so that matching between treated and non-treated individuals with a single
measure can be facilitated. Propensity score matching method (PSM) allows the discussed
matching problem to be reduced to a single measurement called propensity score, .
Propensity score, is the probability that a full sample unit obtains treatment given a set of
observed covariates. The propensity score, computation is then, given as:
(3.3)
Where are observed pretreatment covariates of individuals and is a treatment indicator;
for a treated individual and zero otherwise. Equation (3.3) forms the theoretical model
upon which the model that was used to estimate propensity was build.
Matching is aimed at finding a closest comparison group from a sample of non-CFA participants
to be compared with that from the program participants. The closest comparison group is
attained by comparing propensity scores between treated and control groups calculated basing on
pre-treatment observable covariates that are independent of program participation (Cameron and
Trivedi, 2005; Khandker, Koolwal and Samad, 2010). Propensity score, produces suitable
matches when estimating the impact of CCT program if and only if all information relevant to
participation and outcomes of interest is observable. Therefore it is possible to compare
individual units using propensity scores, alone rather than matching on all covariate values.
Propensity Score Matching approach (PSM) is advantageous over ordinary least squares (OLS)
since PSM reduces the number of measurements to match participants and comparison units.
However, consistent OLS estimates of average treatment effect are calculated under conditional
- 32 -
least squares regression of treatment, outcome and other observed variables, which are not
influenced by participation using inverse of non-parametric estimate of propensity score, . This
method produces fully efficient estimator. Hence treatment effect is estimated by:
(3.4)
With weights 1 for program participants and for nonparticipants to account
for hidden disparities among treatment and comparison units that affect resulting outcomes and
program selection. Here is outcome of individual, and is an error term.
It should be emphatically noted that equation (3.4) is the theoretical model forming the basis for
empirical model used to estimate the impact of the program. Notice also that equation (3.4) could
be used to estimate the impact of the program by use of OLS or PSM method with the
assumption that the treatment was purely random. Unfortunately, the case before this study was
non-random selection and hence the burden was randomizing the selection. This was made
possible by matching using propensity scores. Equation (3.5) through to (3.13) show how the
selection was randomized by eliminating selection bias until equation (3.4) is replicated by
equation (3.20) after simplification starting from equation (3.18).
The treatment impact, on individual , is then calculated as the difference between outcome of
interest for treated individual, i and possible outcome for such individual without treatment
. This can be mathematically expressed as: (3.5)
Where 0 and 1 corresponds to non-treated and treatment respectively.
To evaluate program impact throughout population, average treatment effect (ATE) is calculated:
- 33 -
Most often, average treatment effect on treated (ATT) is calculated:
(3.7)
Where for the treated individual.
Since it is mathematically justified to argue that, the value of the difference between the means is
equal to the mean of the differences, equation no. (3.7) is expressed as:
(3.8)
In equation (3.8), the term is unobservable since it relies on counterfactual
outcome. Counterfactual outcome means trying to look at the outcome of treated (untreated)
individuals in their untreated (treated) status. To solve this problem, a suitable counterfactual
from the control group is constructed to be used in the place of . The construction
of this counterfactual is eased through matching using propensity scores, .
To construct a counterfactual for the treated group, consider equation (3.9) below where all the
terms are observable. This is given as: (3.9)
Now modifying equation (3.9) by adding and subtracting to give;
(3.10)
(3.11)
(3.12)
The term is the selection bias. SB measures difference between observed outcome for control
group and counterfactual for the treated group. Efficient estimation of ATT requires that SB=0 in
equation (3.12). In purely random cases, it is acceptable to argue: