© 2015, IJCSMC All Rights Reserved 356
Available Online atwww.ijcsmc.com
International Journal of Computer Science and Mobile Computing
A Monthly Journal of Computer Science and Information Technology
ISSN 2320–088X
IJCSMC, Vol. 4, Issue. 8, August 2015, pg.356 – 363
RESEARCH ARTICLE
Green Telecommunications: Data Optimization and
Aggregation in the Wireless Network Energy-Based
Balanced Routing Protocol (EneBaRP)
Abhinandan Singh Khajuria
1, Dr. Rohit Bajaj
2¹
M.Tech Scholar, CSE, Chandigarh Engineering College, Landran, Mohali (India)²
Associate Professor, Chandigarh Engineering College, Landran, Mohali (India)1 [email protected]; 2 [email protected]
Abstract— Data Optimization and Aggregation in the Wireless Network receive a great deal of attention due to their great potential in increasing the efficiency of wireless BTS. This paper presents the simulation and analysis of networks with base stations which are usually consisted of several nodes in the communication clusters. The power consumption of these nodes can be reduced by optimizing the packet size, data aggregation and optimized data forwarding techniques. This research will lower the energy consumption of the entire network by using an effective data optimization algorithm on the source nodes. The proposal also includes the data aggregation in the manner to reduce the power consumption on the intermediate nodes between the BTS and the destination server. Work is based on controlling the energy efficiency of the wireless BTS by using a combination of data aggregation, transmission and overhead data exchange techniques. The proposed energy efficient wireless BTS will be simulated with a group of wireless nodes, where a number of experiments with the various data transmission, aggregation and other related techniques would be tested in order to create an energy efficient wireless BTS.
Keywords— BTS- Base transceiver station, GHG- Green House Gases, NS2- Network Simulator-2, ALBA-Automated Load Balancing Algorithm, EneBaRP, WAN- Wide Area Network.
IINTRODUCTION
Climate change today is much more important and global challenge. Rise in the temperature in terms of (GHG) Green House Gases which affects the ozone layer. Due to the release of carbon dioxide CO2 which is the most responsible gas out of the
© 2015, IJCSMC All Rights Reserved 357
Fig. 1 The factor of energy consumption in the telecommunication industry.
Wireless Sensor Network has become a foremost field of investigation in communication field. There are various extensions of WSN. Due to its vast applications, it is inherited with several challenges. The challenges lies in improvement of energy efficiency, reliability, network lifetime etc. Sensors can sense, store, compute, send out and collect information of interests from an environment in that they are located estimated to minute size of sensors, a huge size battery supply that cannot be embedded into them, thus sensors require mechanism for an energy utilization to enhance the life time of sensors in wireless sensor networks. Here technology is related to enhance the ability of wireless network to maximum efficiency and determining the fact that can be achieved further for more reliable network system. These technologies are related and determining the routing protocols and shaping the traffic of network that can result into better and effective wireless network.
IIDATA TRAFFIC SHAPING AND AGGREGATION IN THE WIRELESS NETWORK TECHNIQUE
In this simulation using NS-2, firstly analyse that how the wireless BTSes works in the open environment and then introduce the proposed technique that ensures the least energy consumption in wireless BTS environment using the new metric calculation model. The new metric calculation method and route selection scheme for data forwarding is completely based on the energy level prediction. The networks with base stations are usually consisted of several nodes in the communication clusters.
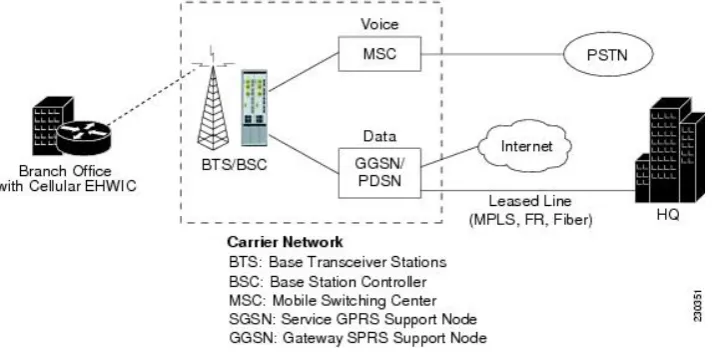
Fig.2 Base Transceiver Station (BTS) and Base Station Controller (BSC)
Complete simulation has been done on Network Simulator (NS-2).. The power consumption of these nodes can be reduced by optimizing using following techniques:
© 2015, IJCSMC All Rights Reserved 358
• Data aggregation: Maximize the number of source nodes accounted for at the sink within the event’s deadline. More sources of data typically imply a better estimate of the desired function.
Algorithm 2
Simple Steps of Metric calculation and data forwarding algorithm
Step 1: All the nodes are arranged in the particular topology according to the energy-based balanced routing Protocol (EneBaRP). Topology is an arrangement where each node is directly or indirectly with one another, allowing for most transmission.
Step 2: The path energy is sourced and computed using a energy threshold algorithm.
Step 3: The path is given a colour P(c) on the basis of the energy threshold (Et) computation for each available path (Pi) towards the destination D. Representing the priority of the path in comparison with other available nodes in the cluster. Below equation calculate the Path Energy denoted by T
P
E
.
T
P
E=min
Where P is the path between two nodes at T transmission.
Step 4: During the data transmission from the sender node, all of the paths are evaluated and the best path is selected according to the colour.
Step 5: If the colour of two paths remains same, the next-hop energy is evaluated and compared in order to make the path selection decision.
Step 6: In case the energy of the two paths would be similar, the final path selection decision will be made on the basis of lowest node ID.
Algorithm 2
The mathematical approach for the algorithm
Energy Consumption equation:
❶
TR
❷
TR
❸
TR
❹
Here 1,2,3,4 are nodes in which T is transmit data and R is receiving data. Node 1 is the source and node 4 is the destination node then, R= (4-1) and S= (4-1). Therefore if there are n numbers of node the R= (n-1) and T= (n-1). With this we can calculate the energy consumption denoted by Ec.
The path energy is sourced and computed using a energy threshold algorithm using the following equation
.
Where ET is energy threshold of a path and Ei represents the Energy of a particular node in the transmission path. I represent the number of iterations till the number N.
The path is given a colour P(c) on the basis of the energy threshold (Et) computation for each available path (Pi) towards the destination D.
If the colour of two paths remains same, the next-hop energy is evaluated and compared in order to make the path selection decision.
In case the energy of the two paths would be similar, the final path selection decision will be made on the basis of lowest node ID.
III SIMULATION AND RESULT
© 2015, IJCSMC All Rights Reserved 359
WIRELESS BTSs to make WIRELESS BTSs run for longer. Routing process consumes the battery power to a great extent. Sensing process is the first part of scanning and does not require to extent its efficiency unless more efficient sensors are made. On the other hand routing protocols has a great possibility of improvement.
As routing is very challenging task in WIRELESS BTS due to contemporary communication feature of this network, the routing protocols plays a very important role in WIRELESS BTS. These protocols are required for sending data between sensor nodes and BS. Communication protocol is an important part of any network and has a strong impact on the performance of network. Also a protocol affect the factors such as energy dissipation, cost of system, latency and also sometimes security of the network. If we choose any unsuitable communication protocol which can cause unbalanced energy division among nodes that will result in reduction of network lifetime. Cost involve in setting-up the communication process among sensor nodes will also increase if any wrong communication protocol is chosen.
The efficiency and effectiveness of proposed algorithm have been assessed through an extensive set of simulations over realistic deployment scenarios. Our main aims are i) showing the effectiveness of the mechanism of data delivery to the sink, ii) testing the protocol performance with respect to energy consumption and overhead, iii) identifying trade-offs between energy efficiency and latency, and iv) demonstrating the proposed adaptive load balancing algorithm and its variations are scalable with respect to network traffic and node density. We performed the experiment of EneBaRP, whose results are described in detail in the rest of this section. More precisely, we have tested EneBaRP performance in a general multi-hop setting and demonstrate its effectiveness for efficient data delivery.
Fig.3 Sensor nodes scattered in a sensor field
Extensive ns2-based simulation results demonstrate the effectiveness of EneBaRP with respect to the relevant metrics of interest, which include packet delivery ratio, end-to-end packet latency, energy consumption, and overhead. EneBaRP works well at medium-high traffic loads (where many comparable solutions suffer severe performance degradation), imposes little additional overhead, and has very good energy performance. At the same time, the Rainbow mechanism deals effectively with dead ends, always providing routes around connectivity holes.
Fig.4 Representation of a network in which a node goes down due out of battery and a different path is chosen with a Single-path algorithm
© 2015, IJCSMC All Rights Reserved 360
There are three major possible communication paths between the node Y and Z. Every node has been assumed to have a transmission radius of 250 meters. It means that these nodes can’t transmit with the nodes which are at the distance more than 250 meters. The paths has been assigned the colours for the effective application of routing protocol based on Rainbow mechanism to mitigate the problem of node failures, path failure or communication holes.
A graph is plotted and node within the range of 250 meters with the deployment number of nodes. There is deployment of nodes from requisite topologies and further ready for transmission.
Fig.5 Deployment of Nodes to form requisite topology
Among the rest of the nodes red nodes have the highest energy. Despite of considering rest of the nodes transmission first reaches to destination through the nodes which have the highest energy level.
© 2015, IJCSMC All Rights Reserved 361
Now when nodes considered the highest energy is further selected for the best path in the
basis of path energy threshold.
Fig.7 Dotted path shows the best path on the basis of path energy threshold
Here energy consumption graph shows how energy path can reduce the consumption of nodes with the best path selection.
© 2015, IJCSMC All Rights Reserved 362
Fig.9 Packet Delivery Ratio
© 2015, IJCSMC All Rights Reserved 363
IV CONCLUSION
The proposed work is implemented in the NS-2 simulator using a standard topology. The proposed work is entirely based upon the design of the data aggregation and traffic shaping algorithms. The combination of latter two techniques would be used to reduce the power consumption at the source and intermediate nodes. The performance of the proposed model will be evaluated on the basis of various network performance and energy based parameters. By calculating the energy threshold over different nodes of network with efficient path reduces the overall load over the network resulting in lowering the temperature that reduces carbon emission. The proposed work will be also evaluated in the terms of carbon footprints and release of the carbon amount in the environment. This result into efficient networking that reduces the amount carbon released provides better environment.
R
EFERENCES[1] S. M. Metev and V. P. Veiko, Laser Assisted Microtechnology, 2nd ed., R. M. Osgood, Jr., Ed. Berlin, Germany: Springer-Verlag, 1998.
[2] J. Breckling, Ed., The Analysis of Directional Time Series: Applications to Wind Speed and Direction, ser. Lecture Notes in Statistics. Berlin, Germany: Springer, 1989, vol. 61.
[3] S. Zhang, C. Zhu, J. K. O. Sin, and P. K. T. Mok, “A novel ultrathin elevated channel low-temperature poly-Si TFT,”
IEEE Electron Device Lett., vol. 20, pp. 569–571, Nov. 1999.
[4] M. Wegmuller, J. P. von der Weid, P. Oberson, and N. Gisin, “High resolution fiber distributed measurements with coherent OFDR,” in Proc. ECOC’00, 2000, paper 11.3.4, p. 109.
[5] R. E. Sorace, V. S. Reinhardt, and S. A. Vaughn, “High-speed digital-to-RF converter,” U.S. Patent 5 668 842, Sept. 16, 1997.
[6] (2002) The IEEE website. [Online]. Available: http://www.ieee.org/
[7] M. Shell. (2002) IEEEtran homepage on CTAN. [Online]. Available: http://www.ctan.org/tex-archive/macros/latex/contrib/supported/IEEEtran/
[8] FLEXChip Signal Processor (MC68175/D), Motorola, 1996.
[9] “PDCA12-70 data sheet,” Opto Speed SA, Mezzovico, Switzerland.
[10] A. Karnik, “Performance of TCP congestion control with rate feedback: TCP/ABR and rate adaptive TCP/IP,” M. Eng. thesis, Indian Institute of Science, Bangalore, India, Jan. 1999.
[11] J. Padhye, V. Firoiu, and D. Towsley, “A stochastic model of TCP Reno congestion avoidance and control,” Univ. of Massachusetts, Amherst, MA, CMPSCI Tech. Rep. 99-02, 1999.