ABSTRACT
GUO, XIAOLU. Removing Arsenic From Water Using Surface-Functionalized Fabrics. (Under the direction of Dr. Stephen Michielsen).
Arsenic is a widespread environmental contaminant in soil and groundwater. It poses risks to human health throughout the world. An engineered system that can accomplish arsenic removal and water conveyance is lacked, which would help mitigate the substantial release of arsenic from irrigation water to rice production fields and human exposure [1]. In this research work, a surface-functionalized fabric was prepared. This fabric-based
technology may be utilized within contaminated flowing-water streams for arsenic removal. The fabrics are cotton based and modified with poly(acrylic acid), chitosan and copper. Poly(acrylic acid) grafts were attached by immersing cotton fabrics in aqueous solutions followed by heat treatment in a curing oven. When the fabrics with poly(acrylic acid) were washed and air dried, chitosan was grafted with same method. Copper was attached by immersing fabrics in aqueous solution overnight after chitosan was attached. Kinetics experiments were carried out by using 73As and a gamma ray counter. The carboxylic acid content on the surface was measured and the average amount attached was found to be approximately2.7 µmol accessible –COOH groups per 1 gram fabric. Also, the amino group
of attached chitosan was measured and the average amount was found to be approximately
10.8 µmol per gram fabric. Adsorption test results showed when the ratio of copper to
Removing Arsenic From Water Using Surface-Functionalized Fabrics
by XIAOLU GUO
A thesis submitted to the Graduate Faculty of North Carolina State University
in partial fulfillment of the requirements for the degree of
Master Science
Textile Chemistry
Raleigh, North Carolina 2017
APPROVED BY:
_______________________________ _______________________________
Dr. Stephen Michielsen Dr. Samuel Hudson Chair of Advisory Committee
_______________________________ _______________________________
DEDICATION
BIOGRAPHY
ACKNOWLEDGMENTS
There are many people that I would like to express my sincere gratitude for assisting me in my two years at NC State. First, I would like to thank you my thesis advisor Dr. Stephen Michielsen. The door to Dr. Michielsen was always open whenever I ran into a trouble spot or had a question about my research or writing. I have gained an immense amount of knowledge being a part of his group. Thanks for your guidance and wisdom professionally and in life, and for just having faith in me.
I would also like to thank you my committee members. Dr. Sam M. Hudson, I am grateful to his valuable time in answering my questions about chitosan and his selfless in giving me the chitosan. Dr. David B. Buchwalter, thanks for sharing your research facility and insights on the adsorption test, without your support I would not be able to finish that. Dr. Dean L. Hesterberg, I appreciate that you gave me such a useful course, it was so helpful both to my research and thesis.
I would also like to express my appreciation to the TECS department. I am grateful to Jeff Krauss for his help and valuable suggestions. To my lab-mates, many thanks to Wenbo Liu, who helped me a lot in the beginning of my research and shape my confidence on my research. Also to Nguyen Vu, without your help, the measuring of concentration would not be so successful. To others, it was wonderful to work with you all.
I would also like to appreciate my friends here and in China. Thank you to each of you for helping me with the multitude field requests I had and encouraging me. My
Finally, I must express my very profound gratitude to my parents and to my
TABLE OF CONTENTS
LIST OF FIGURES ... ix
LIST OF TABLES ... xi
LIST OF SCHEMES ... xii
CHAPTER 1 – INTRODUCTION ... 1
CHAPTER 2 – LITERATURE REVIEW ... 4
2.1 Arsenic Problem ... 4
2.2 Remediation Techniques ... 8
2.2.1 Adsorption ... 9
2.2.2 Competitive Adsorption ... 16
2.2.3 Ion Exchange ... 17
2.2.4 Nanotechnology ... 18
2.3 Surface Modification ... 19
2.3.1 Poly(acrylic acid) Graft Surface Modification ... 19
2.3.2 Chitosan Graft Surface Modification ... 21
2.3.3 Copper Graft Surface Modification ... 23
2.4 Analytical Methods ... 26
2.4.1 PAA Content Measurement ... 26
2.4.2 Chitosan Content Measurement ... 28
2.4.4 Arsenic Adsorption Test ... 33
2.4.5 Iron-Chitosan Beads Preparation ... 34
CHAPTER 3 – METHODS ... 36
3.1 Standards and Reagents ... 36
3.2 Fabric Treatment ... 37
3.2.1 Pad-Dry-Cure Method ... 37
3.2.2 Copper Treatment ... 39
3.2.3 Iron Treatment ... 40
3.3 Quantitative Analysis ... 40
3.3.1 Quantitative Analysis of the Amount of –COOH on Cotton-PAA fabrics ... 40
3.3.2 Quantitative Analysis of the Amount of -NH2 on Cotton-PAA-Chitosan Fabrics 43 3.4 Arsenic Adsorption Test ... 44
CHAPTER 4 – RESULTS AND DISCUSSIONS ... 46
4.1 Pad-Dry-Cure Process ... 46
4.1.1 Poly(acylic acid) Graft Surface Modification ... 46
4.1.2 Chitosan Graft Surface Modification ... 48
4.1.3 PAA-S-SSA Graft Surface Modification ... 49
4.2 Quantitative Analysis ... 49
4.2.1 Quantitative Analysis of the Amount of –COOH on Cotton-PAA Fabrics ... 50
CHAPTER 5 – CONLCUSION ... 64
CHAPTER 6 – FUTURE WORK ... 65
LIST OF FIGURES
Figure 1. The Eh-pH diagram for arsenic at 25 ℃ and 101.3 kPa [8]. ... 5
Figure 2. Dissociation of arsenious and arsenic (V) acids [8]. ... 6 Figure 3. Structures of cellulose, chitin and chitosan [4]. ... 12 Figure 4. Two types of chitosan-copper complexes based on the different conditions [2]. ... 13 Figure 5. Proposed binding structure for copper on chitosan as well as the selective binding
structures for A) phosphate on the Type I chitosan-copper complex and B) arsenate on the Type II chitosan-copper complex [2]. ... 14 Figure 6. The process of pad-dry-cure method [25]. ... 20 Figure 7. Structures of the original chitosan monomer and the effect of introducing Cu(II)
ions. The effect of R (copper loading) and pH during synthesis on the formation of the type of chitosan-copper complex. When R> 0.25 and pH> 5.5, the type I and Type II complexes coexist [2]. ... 25 Figure 8.Schematic diagram for the quantitative analysis of –COOH groups using Toludine
Blue O [24]. ... 27 Figure 9. Schematic diagram: Apparatus for preparing iron-chitosan beads [46]. ... 35 Figure 10. Schematic diagram for the quantitative analysis of –COOH groups using
Figure 13.Arsenic adsorption on to the fabric at varying pH levels. Bis-tris-propane was used as a buffer for the pH 8.7 – 8.9 sample. The As concentrations are converted directly from CPM readings of the radio-labeled arsenic in solution [47]. ... 57 Figure 14.The concentration of As in solution as a function of time after the fabrics were
soaked in the solutions [48]. ... 58 Figure 15. The concentration of As in solution as a function of time after the fabrics were
soaked in the solutions [48]. ... 59 Figure 16.Adsorption test results of new prepared five samples and one blank sample. ... 61 Figure 17.Control fabric test and duplicate adsorption test of PAA-CH-Co-Fe and Co-Fe in
LIST OF TABLES
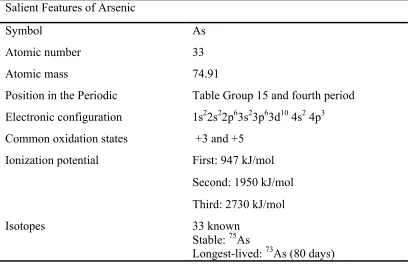
Table 1. Salient Features of arsenic. ... 4
Table 2. Data of TBO content on cotton-PAA fabric surface. ... 52
Table 3. Data of TBO content on cotton fabric surface. ... 52
Table 4. Data of Acid Orange 7 content on cotton-PAA-chitosan fabric surface ... 55
Table 5. Data of Acid Orange 7 content on cotton-PAA fabric surface ... 55
Table 6. Data of Acid Orange 7 content on two different cotton-PAA-chitosan fabrics surface, the only difference is the concentration of acetic acid used to dissolve chitosan. ... 56
LIST OF SCHEMES
Schemes 1. Structure of PAA. ... 20
Schemes 2. Schematic diagram of adding PAA on cotton fabric [24]. ... 21
Schemes 3. Schematic diagram of adding chitosan on cotton-PAA surface. ... 38
Schemes 4. Cross section of poly(acrylic acid) on cotton fiber. ... 46
CHAPTER 1 – INTRODUCTION
Water quality is one of the biggest global issues in the world. Though water quality varies in different countries and regions, one of the most common contaminant problems is excess of metal oxyanions, including arsenic, lead, chromium. Arsenic, atomic number 33, is ubiquitous and ranks 20th in natural abundance, 14th in seawater, and 12th in the human body [1]. However, it is toxic when a certain concentration is exceeded. A recent study found that more than 20 million people in over 70 countries are probably affected by arsenic
poisoning in drinking water [1]. For aquatic wildlife, chronic exposure to low concentrations (10-100 ppb) of arsenic can lead to mutagenesis and various cancers [2].
There are several remediation techniques that have commonly employed, including adsorption, ion exchange, chemical precipitation/flocculation, membrane filtration, and electrochemical treatment. Each of these techniques has its environmental and economic benefits and costs in terms of performance, operations and maintenance. Also, they exhibit certain disadvantages.
Based on this challenge, Ramana et al. reported the use of copper(II) ions on an available polymeric support (such as chitosan) to select for arsenic from background ions. Chitosan, an organic waste product of the shellfish industry, is widely used in engineering adsorbents due to its favorable environmental profile and unique molecular characteristics.
There are two major forms of chitosan-copper complexes based on different ratios of copper to chitosan and the pH of the solutions. Only Type I complex exists below a defined threshold: pH=5.5 and R=0.25 (mole ratio of Cu(II) to chitosan). Above these conditions, the Type II complex also forms. Particularly, the Type I complex favors phosphate chelation while the Type II complex favors arsenate chelation due to the electrostatic considerations [2].
Based on the above results, the traditional textile pad-dry-cure method was utilized to attach poly(acrylic acid) and chitosan onto cotton fabrics and then the fabrics were soaked into the copper solution to prepare these two kinds of complexes.
Pad-dry-cure method is easy to carry out and large scale production is also possible. What’s more, the materials used are cheap. Therefore, this absorbent at least has the
advantage of low expense. Though a lot of papers mentioned techniques containing chitosan or copper or chitosan-copper, few papers come down to copper-chitosan in fabrics, let alone a selective surface-functionalized fabric for arsenic adsorption.
2. Test how much amount of carboxyl group from poly(acrylic acid) has been added to fabrics and also test how many amino groups from chitosan have been grafted onto the fabrics.
3. Determine how much arsenic the fabrics can adsorb over time and the maximum adsorbed amount after 48 hours.
CHAPTER 2 – LITERATURE REVIEW
2.1 Arsenic Problem
Arsenic (atomic number 33) is ubiquitous and ranks 20th in natural abundance. It is the 14th most common element in the seawater, and 12th in the human body [1]. Arsenic is a metalloid, which means, it has both metal and nonmetal characteristics. It was first isolated in 1250 A.D. by Albertus Magnus [1], since then this element has been a continuous center of controversy.
Table 1. Salient Features of arsenic. Salient Features of Arsenic Symbol As
Atomic number 33
Atomic mass 74.91
Position in the Periodic Table Group 15 and fourth period Electronic configuration 1s22s22p63s23p63d10 4s2 4p3
Common oxidation states +3 and +5
Ionization potential First: 947 kJ/mol
Second: 1950 kJ/mol Third: 2730 kJ/mol
Isotopes 33 known
Stable: 75As
Longest-lived: 73As (80 days)
Arsenic exists in the −3, 0, +3 and +5 oxidation states [3]. These states are highly
[4]. At environmentally relevant redox conditions, arsenic predominately exists as either arsenite (AsO2-, +3) or arsenate (AsO43-, +5). As(III) is primarily present in anoxic environments while As (V) is found in toxic soils [5]. At pH 5-7, it exits as an anion (HAsO42−, H2AsO4 −) [2, 6]. Under most pH conditions, the arsenite is fully protonated and therefore it is uncharged, which makes arsenite more difficult to remove while it is also more toxic and more mobile [7].
Figure 2. Dissociation of arsenious and arsenic (V) acids [8].
The original arsenic found in water came from the soil. At some places, arsenic is considered to come from volcanic eruption and at others may from pyrite oxidation. Arsenic can be mobilized by a lot of activities, including natural reactions and manmade activities. Most environmental arsenic problems are caused by natural mobilization such as weathering reactions, and biological activities [9]. Meanwhile, microorganisms have crucial role in these transformations [10]. However, manmade activities such as mining activities, combustion of fossil fuels, using of arsenic pesticides, herbicides and crop desiccants create additional impacts.
Arsenic present in the soil dissolves and goes into groundwater, consequently it permeates into the drinking water and all other usable water as well. Also, it is found in both sea water and river water [10].
including sugar phosphates of intermediary metabolism and phosphate backbone of DNA and RNA. What’s more, high energy phosphate ester bond of ATP is indispensable in energy cycling. Some enzymes that form phosphate esters can catalyze the formation of arsenate esters. Taking ATP for example, arsenates can replace some of the phosphates to form new bonds. Even one or two replacement is dangerous for body. However, the arsenates bonds hydrolyze very rapidly and cannot be used to provide energy [12]. For aquatic wildlife, chronic exposure to low concentrations (10-100 ppb) of arsenic can lead to mutagenesis and various cancers [2].
A recent study found that more than 20 million people in over 70 countries are probably affected by arsenic poisoning in drinking water. Studies concluded that the
observed health effects were dependent on the dose and duration of exposure [11]. Long-term drinking of this water causes lung, bladder, skin and kidney cancers. Even worse, it will have developmental effects such cardiovascular disease, neurotoxicity and diabetes [1]. The United State is included in these affected countries while eastern Asian countries are the worst affected places [10].
Arsenic is a natural component of the earth’s crust and is widely distributed
throughout the environment in the air, water and land. Its inorganic form is extremely toxic. The sources of arsenic exposure include drinking contaminated water, using contaminated water in food preparation and irrigation of food crops, industrial processes, eating
tobacco can also be exposed to the natural inorganic arsenic content because tobacco plants essentially take up arsenic naturally present in the soil.
However, the symptoms and signs caused by long-term elevated exposure to
inorganic arsenic vary from individuals, population groups and geographical locations. Thus, it is hard to have a universal definition of the disease caused by arsenic. The above
information comes from the website of Word Health Organization(WHO). Arsenic is one of WHO’s 10 chemicals of major public health concern. In WHO’s “Guidelines for drinking-water quality”, it has already published a guideline value for chemicals. Current
recommended limit for arsenic in drinking water is 10 µg/L. The United States
Environmental Protection Agency (USEPA) and the European Union also set their maximum contaminated levels to 10 µg/L. However, many other countries are still using the standard level of arsenic of 50 µg/L due to the limited testing facilities and the high cost of treatment.
2.2 Remediation Techniques
One remediation method of arsenic toxicity is that arsenite (III) can be easily oxidized to less toxic arsenate(V) state. Arsenite is thermodynamically unstable in aerobic
environment and usually can be oxidized to arsenate state [10].
The commonly employed remediation techniques include adsorption, ion exchange, chemical precipitation/flocculation, membrane filtration, and electrochemical treatment. Each of these techniques has environmental and economic benefits and costs in terms of
is quite important that these arsenic remediation techniques can be designed for
sustainability, which includes environmental considerations and ease of use and maintenance.
2.2.1 Adsorption
The column adsorption process is easy to carry out and is usually used as a front line of defense, thus it has become one of the most promising method being used in arsenic removal [4, 14].
Some materials, including biological materials, mineral oxides, activated carbons and polymer resins, have been shown to possess selective adsorption ability, which has generated increasing excitement [4].
Activated carbons is a crude form of graphite, due to its mesopores and micropores, they have surface areas up to 2000 m2/g. In 1930, activated carbon was reported for water treatment in the United States. Compared with organic compounds, the adsorption of metal ions on carbon is more complex because of the influence of ionic charges. The adsorption capacity will be affected by activated carbon properties, adsorbate chemical properties, temperature, pH, ionic strength and so on. Despite activated carbons’ prolific use in water treatment, it is still very expensive [4].
Desorption also can be achieved with 1 M of KOH, the desorption ratio can reach 71-96% [4].
TiO2-impregnated Chitosan Bead: [15, 16] One simple water treatment material is chitosan which can be modified into beads and films. Chitosan is a byproduct of shellfish processing industry and it offers a lot advantages such as being inexpensive, plentiful, non-toxic, renewable and biodegradable. Though chitosan has the ability to absorb a lot of cationic metals, it has little adsorption ability for arsenic. TiO2, absolutely different with chitosan, only absorb arsenic and has the ability to oxidize As(III) to As(V) in the presence of UV light. However, the use of TiO2 nano-powder is limited due to the requirement to remove TiO2 from finish water. A new absorbent, TiO2-impregnated chitosan beads is based on the above statements aiming to overcome the disadvantages.
This novel sorbent has been shown to be competitive with current arsenic removal technologies, the capacity due to the TiO2 mostly. And the UV light can enhance the adsorption ability, which may be due to the surface area increasing after exposure to UV light. However, the performance of this new sorbent is easily affected by pH [15]. As for the regeneration, TiO2-impregnated chitosan beads can be regenerated easily with weak NaOH,
and it can be reused without losing effectiveness for at least three cycles in batch experiments. In their test, they found phosphate is a direct competitor for arsenic absorption
[16].
arsenite to arsenate, which is much easier to remove. The metal oxides are in nano-powder forms which gives them a higher surface area for adsorption and oxidation capability. However, the small particle size also requires energy-intensive post-treatment filtration to recover them to be reused. TiO2-impregnated chitosan beads are reported can solve this problem. The nano-TiO2 is embedded into the chitosan matrix and through this way, absorbent in the solution can simply be self-separated by density.
In order to improve this technology to remove other metals for example, Yamani el al. incorporate nano-Al2O3 as an additional active component. This combination turns out to be more useful in absorption. TiO2 is able to oxidize arsenite while nano-Al2O3 gives the system higher affinity and absorbability for arsenate. Yamani el al. used a mathematical model pseudo-second order kinetics to validate the mechanism of oxidation and the complexation with Al2O3.
To study the interaction of As(III) and As(V) with amorphous oxide surfaces, Sabine Goldberg et al. used in situ Raman and Fourier transform infrared (FTIR) spectroscopic methods, combining with sorption techniques, electrophoretic mobility measurements, and surface complexation modeling. A function of solution pH, solution ionic strength, and redox state was made to investigate arsenic adsorption. They found the position of the As-O
and outer- sphere surface complexes on amorphous Fe oxide and outer sphere surface complexes on amorphous Al oxide [18].
Bio-sorbent is a kind of arsenic sorbent that is produced by algae, fungi and bacteria or others. The mechanisms of cell surface sorption are based on physicochemical interactions between metal and functional groups of the cell wall. They are independent of cell
metabolism. The functional groups mainly come from polysaccharide, lipids and proteins [4]. Chitin and chitosan: Chitin and chitosan are both excellent natural adsorbents with high selectivity. Chitin is a long, unbranched polysaccharide derivative of cellulose, where the C2 hydroxyl group has been replaced by acetyl amino group –NHCOCH3. The chemical structures of chitin and chitosan are shown below in Figure 3.
Cellulose
Chitin
Chitosan
The reasons that they have high selectivity were: chitosan has high hydrophilicity due to the large amount of hydroxyl and amino groups; primary amino groups give chitosan high reactivity; the chitosan chains are flexible which provide chitosan and metal with suitable configurations to form efficient complexation.
Copper Complex: [2] When copper is introduced into chitosan matrix, it makes the – NH2 on the chitosan backbone available to form bonds with copper. Chitosan and copper can form bonds in two ways.
Figure 4. Two types of chitosan-copper complexes based on the different conditions [2].
In arsenic absorption test, phosphate is shown to inhibit the use of adsorption
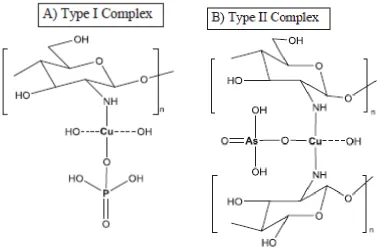
technologies even at a low concentration. Yamani, et al. found that chitosan-copper complex has a selective adsorption for As in the presence of SO42- under certain conditions as shown in the Figure 5. These two types of complexes have different affinities for arsenate and phosphate. More specific, Type I favors phosphate chelation while Type II complex favors arsenate chelation, which has been attributed to electrostatic considerations.
Figure 5. Proposed binding structure for copper on chitosan as well as the selective binding structures for A) phosphate on the Type I chitosan-copper complex and B) arsenate on the
Type II chitosan-copper complex [2].
Chitosan-iron oxide composite: [19] Iron(oxyhydr)oxides can be used to absorb As over a wide range of pH. When the size is small, it is quite useful. However, such material is difficult to separate from treated water. It can be overcome by hybrid iron(oxyhydr)oxides to polymer. One polymer often being used is chitosan. This chitosan goethite
bio-nanocomposite (chitosan-iron oxide composite) is shown to be effective at removing both As(III) and As(V) from water by forming inner-sphere complexes between arsenic species and goethite nanoparticles. Via X-ray fluorescence, they found both As(III) and As(V) can penetrate the entire chitosan goethite bio-nanocomposites material, which indicates that this material has high As removal capacity.
2.2.2 Competitive Adsorption
In multicomponent systems containing arsenic, the arsenic adsorption would become complicated due to the solution-surface interactions. The phase equilibrium of solid-liquid system has different capacities in a single ion solution and a mixed ions solution. The
multicomponent systems have been proved to be quite complicated and always be shown as a function of ionic radii, electronegativity, pH, and the availability of the active sites. In
adsorption studies, deionized water with a single ion in was always carried out. But these single ion systems were only promising for laboratory scale study, in practical applications, the competitive role of background ions such as phosphate and sulfate are a major obstacle to the effective adsorption ability of adsorbents. Research has shown up to a 90% decrease on arsenic adsorption would take place when there are phosphate and sulfate in the solution [13].
by the adsorption of calcium.
Anions such as NO3 −
, SO4 2−, Cl− , Br−
did not influence the adsorption of arsenite
significantly while Cl−
may affect arsenate removal. HCO3−
causes higher suppression of
arsenic sorption than that by Cl−
. The attainment of equilibrium may be delayed by some anions.
In binary or multicomponent systems, the optimum times may be longer than that for single component.
Other dissolved substances in the water have also been announced to influence mobility of arsenate and arsenic. Organic matter will affect adsorption by delaying equilibrium time and lowering the extent of sorption [9].
Clearly, the situations would become even more complicated with several ions on. And multicomponent sorption models should be investigated and used in this intricate system [15].
2.2.3 Ion Exchange
relative order of affinity of these basic anion exchangers for some familiar ions in drinking water is sulfate > arsenate > nitrate > chloride > bicarbonate. Which means it is also sensitive to the concentration of competing ions such as sulfate and nitrate [10, 21].
2.2.4 Nanotechnology
Nanotechnology is employed for remediation of arsenic recently. The nanosized polymer beads combined with iron oxide inside act as filter bed for the removal of arsenic from groundwater. Nanosized zero-valent iron and carbon nanotubes containing nano carbon beads were investigated more recently. The revolutionary nanotechnologies in biomedical industries helps open a brand new path for remediation, prevention and therapy to the toxicologists. The nanotechnology is an effective method relative to the conventional site-remediation technology. The large surface area of nanoparticle iron can remove much more arsenic from groundwater.
However, the use of nanosized zero-valent iron might be a potential threat to us. The study on the effect of the accumulation of nanoparticles on our health is still insufficient. What’s more, when the surface mobility of nanosized zero-valent iron is increased, the nanomaterials migrating possibility is also increased, which may cause a negative influence on the arsenic remediation process if the nanomaterials migrating beyond the aiming contaminated areas. And when nanoparticles are inhaled, it may have a bad effect on the lungs.
from outside for an appreciable flow of water. What’s more, the nanoparticles that absorb the pollutant may not be easily disposable. Before the nanoparticles can be widely used in water treatment, the disposal problem must be properly handled. Since the filtration by absorption or adsorption depends on the pH of water, it is impossible to use only one type of filtration technique for all types of water [10].
2.3 Surface Modification
2.3.1 Poly(acrylic acid) Graft Surface Modification
Cotton is one of the most important and widely used textile materials. Though
chitosan can be added directly onto cotton fabrics without any chemical binders, this chitosan should be in the state of nanoparticles because cellulose doesn’t have functional groups that amino groups from chitosan can attach to. For the nanoparticles, the smaller the size is, the more effective it can be [22].
Instead of making nanoparticles, a more convenient method usually being used is cotton surface modification. By grafting functional group, such as –CHO or carboxymethyl groups, then cotton fabrics can interact with chitosan [23].
In this thesis, poly(acrylic acid) was used as a functional agent, which was based on previous works done by Dr. Michielsen and his students. The structure of poly(acrylic acid) is shown in Scheme 1. An important advantage of using polymers such as poly(acrylic acid)
to modify surfaces of others is the need for fewer graft sites. A small amount of grafted polymer chains can cover the entire polymer film surface using few graft sites [24]. In our
Schemes 1. Structure of PAA.
PAA adding procedure was achieved by a traditional textile method called pad-dry-cure, as shown in the Figure 6.
Figure 6. The process of pad-dry-cure method [25].
Schemes 2. Schematic diagram of adding PAA on cotton fabric [24].
2.3.2 Chitosan Graft Surface Modification
Chitosan, derived from insect and shellfish exoskeletons, can be easily accessed with little cost. Because of its stability and great life-cycle it is widely used [7].
One way to coat chitosan on cotton fabric is sol-gel coating technique, which allows coating on nanometer scale. More specifically, the cleaned cotton fabrics were dipped in the solution several times and air dried. Then, the cotton fabrics were dried and finally cured at a higher temperature in a preheated curing oven. Through the above methods, a thin layer of chitosan was added on the fabric surface. XRD analysis showed this technique will not disrupt the cotton structure [26].
Layer-by-layer assembly: [27] Chitosan can be added on cotton fabric via layer-by-layer assembly. More specifically, cotton fabric was first dipped into the chitosan solution for 5 min, then rinsed with deionized water for about 1 min and air dried. Then dipped the
polyphosphate was obtained. Then the fabrics were alternately immersed into chitosan and anion ammonium polyphosphate solutions until enough layers were achieved. The process was similar except the dipping time can be shortened to 1 min, washing time to 30 s.
Sodium periodate: [28] This paper prepared chitosan coated cotton fiber by using sodium periodate to oxidize the cotton cellulose. Ethylene glycol was added into the solution to terminate the reaction. Chitosan was dissolved in 0.4% (v/v) HCl solution and then the oxidized cellulose was added into this chitosan solution. The final product was filtered and washed, dried.
Chitosan-Cotton composite material preparation: [29] In this paper, chitosan was directly added onto cotton fabrics by pad-dry-cure process. Chitosan was dissolved in 1% (v/v) aqueous acetic acid solution first. Then cotton fabric samples were immersed directly into the solution. The fabrics were squeezed to a wet pick up of 100%. Then the fabrics were dried at 90 °C for 5 min and cured. After the fabrics returned to room temperature, they were rinsed with distilled water for several times removing the non-reacted chitosan and washed using non-ionic wetting agent, rinsed with hot and cold water. Finally, the fabrics were put into oven for 24 h.
2.3.3 Copper Graft Surface Modification
Adsorption is widely used in remediation. However, significant research shows that the adsorption of arsenate can decrease up to 90% due to the competition with phosphate and sulfate. It is because of the similar structures of arsenic and phosphate as mentioned before. When the arsenate and phosphate or sulfate are in the same order of magnitude, phosphate and sulfate do not interfere with arsenate adsorption dramatically, but these ions are usually ten or hundred times higher in concentration than arsenate reality. Due to the trace level arsenate is required, even low levels of phosphate and sulfate can cause very bad effect to the adsorption.
In view of this challenge, few studies have offered methods to overcome this impediment. Among these, Ramana et al. report that Cu(II) is useful in analytical chromatography for selecting arsenate from background sulfate. By extending these principles, it has the potential to use Cu(II) ions to enhance the selectivity of adsorbents. Because Cu(II) is an electron acceptor and can integrate with oxyanions.
amine (-NH2) and alcohol (-CH2OH) on backbone of chitosan depending on the system conditions.
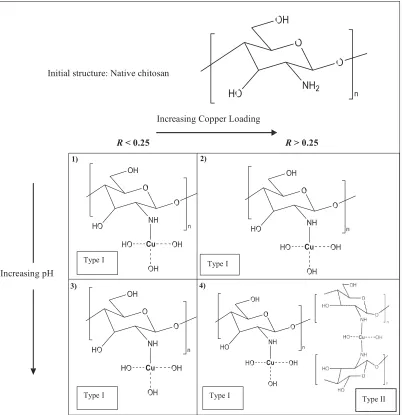
Figure 7. Structures of the original chitosan monomer and the effect of introducing Cu(II) ions. The effect of R (copper loading) and pH during synthesis on the formation of the type of chitosan-copper complex. When R> 0.25 and pH> 5.5, the type I and Type II complexes
coexist [2]. Initial structure: Native chitosan
Increasing Copper Loading
R < 0.25 R > 0.25
Heavy metal contamination is one of the severest concerns around the world. Cu, widely used in electrical industry, even though is important to human body, it can cause harmful and even fatal effect when the amount of copper exceeds a certain level.
2.4 Analytical Methods
2.4.1 PAA Content Measurement
2.4.2 Chitosan Content Measurement
Chitosan modified cellulose cotton fibers has the antimicrobial properties. To investigate the mechanism and improvement, it is important to analyze how much chitosan has been added on cotton. There were three different ways introduced in Strnad’s paper. Firstly, the amount of chitosan can be revealed by the amounts of amino groups in the fabric. It can be achieved by using Acid Orange 7 dye. The concentration of Acid Orange 7 reacted with chitosan can be determined by on-line optical absorbance. This procedure gave a 100% stoichiometric reaction in dye anionic sites and amino groups as they mentioned [32].
Second way is polyelectrolyte titration. Based on the anionic polyelectrolyte react with cationic groups on the fiber, cationic polyelectrolyte was titrated into the fiber solution.
A Mütek particle charge was used as a detector to detect the end-point. A blank sample was also measured in the same way.
Third method is XPS. Each sample was measured from at least three different locations. By analyzing surface elemental concentrations and calculating O/C ratios, Strnad et al. got the amount of chitosan added on the fabrics roughly.
The first and second methods agreed with each other very well, meanwhile,
combining the third XPS method, Strnad et al. got a better understanding of the spread and formation of chitosan on cotton fabrics.
solution was measured after 2 h using a spectrophotometer at wavelength of dye’s maximum absorbance wavelength. The difference of final and initial concentrations directly related to the amount of chitosan on the fabrics.
Concentration measurement and calibration: [33] To measure the concentration of the sample, a calibration curve of dye was first prepared using five different concentrations. The absorbance of these five solutions were measured by a Varian Cary 1EUV/VIS
spectrophotometer in a range from 400 to 700 nm. Then the maximum absorbance was plotted against several dye concentrations, from the plot and the constant kdye for each dye, the concentration of dye can be calculated as follows: Dye Concentration (mmol/L) = Maximum Absorbance/kdye
Color measurement: [30]. By measuring the reflectance of chitosan treated and untreated fabrics using a Hunter Lab Color Quest II spectrophotometer, Oktem got the color strength over the wavelength range 390-700 nm. The relative color strength (K/S) values were then established based on the following Kubelka-Munk equation:
𝐾
𝑆 = [(1 − 𝑅)+/2𝑅]
Where K and S are the absorption and scattering coefficients. The fabrics were pretreated with a reactive dyestuff for exhaustion.
Quantitative analysis of the amount of NMA-HTTC on fabrics: [34]
fabrics were soaked into 80 ml aqueous dye solution (0.5 g/l) at 50°C for 24 h. Then the fabrics were washed thoroughly using tap water and dried at 60°C for 2 h.
Then samples were cut into small swatch (around 0.025 g) and soaked into 10 ml of 25% aq. pyridine. They were sealed in a closed vial and placed in a shaker incubator and kept at 60 °C, stirring at 150 rpm for 3 h. Varian Cary 3 UV-VIS spectrophotometer was used to measure the absorbance of the extracted dye solution at wavelength at 490 nm. Then the absorbance was converted into the concentration by using the Beer-Lambert Law.
C.I. Acid Orange 7 is an anionic dye which makes an ionic interaction with quaternary ammonium salt groups on the measured fabrics.
Acid Orange 7 method condition: [34] Lim et al. did several experiments to measure the best condition for Acid Orange 7 treating with chitosan fabrics. Lim et al. used 0.5 mol/L hydrochloric acid and 0.2 mol/L sodium hydroxide to control the pH. When in acidic
conditions (pH 3.0), the reaction between dye and chitosan were easier due to the electrostatic interaction forces.
Determination of the amount of HBP-NH2 grafted onto cotton fabric: [36] An amino-terminated hyper-branched polymer (HBP-NH2) was added to cotton fabrics. The amount of HBP-NH2 related the final function directly, therefore it was important to measure how much HBP-NH2 was added. Zhang et al. used K/S values to evaluate the amount added. The HBP-NH2 grafted cotton fabrics were dyed with C.I. Acid Blue 225 firstly. When the fabrics were already dried, they used Ultrascan XE
relationships between K/S value and the amount of the HBP-NH2 were used to calculate the HBP-NH2 amount added to the cotton fabrics.
2.4.3 Copper Content Measurement
The use of chemiluminescene and ligand competition with EDTA to measure copper concentration in seawater: [37] Copper is toxic when it exceeds a certain level though it is a required nutrient. In order to assess the copper toxicity, first thing is to measure the
concentration of copper. Huntsman’s paper introduced chemiluminescence method. The chemiluminescence method is based on the light-emitting reaction of copper(II)-1,10-phenanthroline chelates with H2O2 at alkaline condition. The method in this paper was modified from flow injection technique which was introduced by Yamada et al. Through the investigation, Sunda et al. found the chemiluminescence reaction shown to be sensitive and highly selective for copper. This reaction was not influenced by other trace metals, such as aluminum, nickel, manganese(II), cobalt(II), and zinc at molar ratios of these metals to copper of 10000:1. Lead may have little interference at Pb:Cu ratios above 1000. But these ratios would be extremely unlikely in seawater. Their batch chemiluminescence method can be used to determine both concentrations of labile and total dissolved copper in coastal seawater directly.
the concentration of copper in measured samples can be obtained. The applications of ICP-AES including determination of metals in wine, arsenic in food and trace elements analysis in soil.
Using electrochemical method to measure copper concentration: [40] Cyclic
voltammetry is a useful method to measure the concentration of electroactive species. Copper is included. However, it can only be used when the concentration is low (< 50 mM), the traditional macroelectrodes may have problems when measuring high concentrations.
Because the large faradic currents will produce large resistive drops then seriously distort the voltamograms and affect the measured currents. The advent of ultramicroelectrodes with micrometer dimension electrodes, which has much smaller currents flow, it may be possible to measure higher concentrations.
Using flame atomic absorption spectroscopy to measure the copper concentration: [41] Flame atomic absorption spectroscopy(FAAS) is another way to measure the copper concentration. Firstly, the flame was used to atomizer atoms. Then the atoms are irradiated by optical radiation. The radiation then passes through a monochromator in order to separate the element-specific radiation. Finally, the detector will tell the concentration of copper or other elements quantitatively.
2.4.4 Arsenic Adsorption Test
Farrell et al. used suspended iron wires in anaerobic arsenate solutions to determine arsenate removal rates. The removal rates can be performed as a function of arsenate solution concentration. According to Tafel’s analysis, corrosion rates were able to be determined as a function of elapsed time [4].
Inductively coupled plasma mass spectrometry to measure arsenic concentration: [43, 44] Inductively coupled plasma mass spectrometry (ICP-MS) is one of the mass spectrometry that can detect metals and several non-metals at low concentrations. And it is one of the good chemical analysis techniques used for element determination. It is sensitive and precise. By comparing the initial and ending concentration of arsenic, the arsenic absorption amount can be calculated. Inductively coupled plasma mass spectrometry is achieved by ionizing the sample with inductively coupled plasma first and a mass spectrometer is used then to separate and quantify the ions.
Innov-X Model XT-440 Field Portable X-Ray Fluorescence analyzer to measure arsenic content: [45] X-Ray Fluorescence(XRF) is a machine equipped with high resolution silicon PIN diode detector and Compton normalization software. Standard reference
materials should be used to factory calibrate XRF aiming to analyze arsenic. This instrument has the advantages of cost effectiveness and ability to deal with large number of samples.
windows characteristic of the target isotope. Inside this shielded detector there is a scintillation crystal that surrounds the radioactive sample. Radioactive samples will emit gamma rays that interact with crystal. Then the gamma rays will be absorbed and light is produced. Depending on the half-life and concentration of the sample, measurement times may differ. The time for 73As is 3 min.
2.4.5 Iron-Chitosan Beads Preparation
To solve the copper iron leaching problem, iron nitrate is a good replacement to try. Iron-chitosan beads can be prepared by the following steps. About 10 g of chitosan was
added to 0.5 L of 0.01 M Fe(NO3)39H2O solution under continuous stirring for 2 h at 60 °C temperature to form a viscous gel. Figure 8. shows the schematic diagram of apparatus for preparing iron-chitosan beads. The bead was formed by drop wise addition of chitosan gel with required viscosity into a 0.5 M concentrated NaOH precipitation bath. Maintaining this concentration of NaOH was critical in forming the beads and in subsequent washing of the beads. The purpose of adding an acidic chitosan mixture to the NaOH solution is to assist rapid neutralization of the acid so that the spherical shape could be retained. If the
concentration of NaOH in the solution was lower than 0.5 M, the beads tend to disintegrate and would not retain the spherical shape. The beads were then separated from NaOH
Figure 9. Schematic diagram: Apparatus for preparing iron-chitosan beads [46].
1) Heater 2) Chitosan solution 3) Stirrer
CHAPTER 3 – METHODS
3.1 Standards and Reagents
The fabric used is optical brightened plain-woven percale sheeting cotton fabric (product code 439 XW from Test Fabrics, Inc.), whose basis weigh is 120 g/m2. The measured thread count is 135 epi (ends per inch) and 65 ppi(picks per inch). Poly(acrylic acid) was purchased from Aldrich Chemical Co. whose viscosity average molecular weight is around 450,000. Chitosan used was 83% deacetylated chitosan with average molecular weight around 200 kDa (medium molecular weight) and medium molecular weight chitosan purchased from Aldrich Chemical Co. Copper(II) nitrate trihydrate and Fe(NO3)39H2O were purchased from Aldrich Chemical Co. Toluidine Blue O was also purchased from Aldrich Chemical Co. Acid orange 7 was obtained from Standard Colors, Inc. All other reagents and solvents were purchased from Aldrich Chemical Co. and were used without further
purification.
PAA-S-SSA, poly(acrylic acid-co-styrene-co-styrene sulfonic acid). This copolymer was prepared byHalil Ibrahim Akyildiz in the weight percentages of65%, 10%, 25% [47].
Textile padder machine and curing were purchased from Mathis U.S.A Inc. The oven is Mechanical Convection Oven DKN 810 bought from Yamato. Spectrophotometer used is GENESYS 10S UV-Vis (Thermo Electron Corporation). The shaking bath was purchased from Precision Scientific. 1480 Automatic Gamma Counter was purchased from
3.2 Fabric Treatment
3.2.1 Pad-Dry-Cure Method
To prepare the cotton with poly(acrylic acid) grafted on it, aqueous poly(acrylic acid) solution was first prepared by weighting out 2.5 g PAA and added it into 500 mL deionized
water which was heated to around 50 °C. The suspension was stirred on a magnetic stirrer for
about 2 hours until PAA was fully dissolved. Several 15 cm * 15 cm pieces of cotton fabric were soaked into the solution for 15 min. The fabrics were nipped out and padded with a laboratory padder single operation at 1bar pressure and speed 1m/min once. The samples
were dried in oven at 50 °C for 3 minutes and then cured in a laboratory curing oven for 2
minutes at 170 °C.
The treated fabrics were washed with deionized water several times in order to remove unfixed poly(acrylic acid). Then samples were hung up and air-dried at room temperature.
laboratory curing oven for 2 min at 170 °C. The treated fabrics were soaked in aqueous 0.5%
(w/v) detergent solution for 15 min, the detergent solution was also prepared using deionized water. This step aimed to remove the ungrafted chitosan on the fabrics and excess acetic acid. The fabrics were washed using deionized water then and hung up, dried at room temperature. Scheme 3 roughly shows the state after adding PAA and chitosan on cotton surface. The amino group from chitosan reacted with carboxyl groups in the PAA; additional unreacted amino groups still remain in the chitosan chain.
Schemes 3. Schematic diagram of adding chitosan on cotton-PAA surface.
To reduce the sensitivity of copper grafted cotton fabric to acid groups from organic matter in water, another acid layer was added after copper was attached. The poly(acrylic acid)-co-styrene-co-(styrene sulfonic acid) was chose to be this layer because it is the one that existent in lab and it is a stronger acid than poly(acylic acid) as well. The process was similar as above: aqueous 0.5% (w/v) PAA-S-SSA solution was first prepared by adding 2.5
magnetic stirrer for about 2 hours until it was fully dissolved. Several 15 cm * 15 cm pieces of cotton fabric with PAA, chitosan and Cu(II) on were soaked into the solution for 15 min, then the fabrics were squeezed out and padded with a laboratory padder single operation at
1bar pressure and speed 1m/min once. The samples were dried in oven at 50 °C for 3 minutes
and then cured in a laboratory curing oven for 2 minutes at 170 °C.
Fabrics with only PAA-S-SSA on were also prepared. First a 0.5% (w/v) PAA-S-SSA solution was prepared and several 15 cm * 15 cm pieces of cotton fabric were soaked into the solution for 15 min and padded with at 1bar pressure and speed 1 m/min once. The samples
were dried in oven at 50 °C for 3 minutes and then cured in a laboratory curing oven for 2
minutes at 170 °C.
3.2.2 Copper Treatment
The concentration of copper nitrite solution was controlled according to Yamini et al.’s paper. Above a certain pH and ratio (mole ratio of copper nitrate to chitosan), the complex between chitosan with copper can be selective for arsenic adsorption. Two
3.2.3 Iron Treatment
The concentration of iron nitrate solution was controlled similar with copper nitrate solution. Per 200 mg Fe(NO3)39H2O was added to 100 mL deionized water. Using 3 M sodium hydroxide (NaOH) to increase pH between 6-8. Then the fabrics were soaked in the solution overnight at room temperature and the pH of solution was checked the following day. Next the fabrics were washed using deionized water till no color appeared in the deionized water. The final fabrics were hung up and dried at room temperature.
3.3 Quantitative Analysis
3.3.1 Quantitative Analysis of the Amount of –COOH on Cotton-PAA fabrics
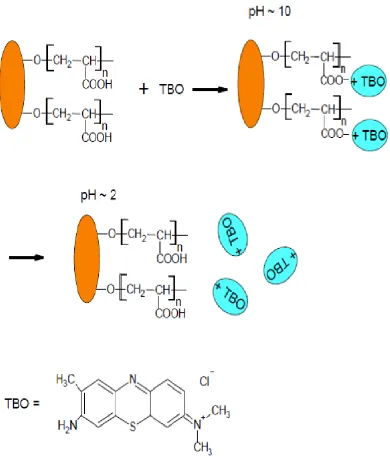
The amount of poly(acrylic acid) grafted onto the cotton surface was determined colorimetrically using Toluidine Blue O (TBO), which was based on the number of carboxyl groups grafted onto the cotton fabric. One carboxylic group can react with one TBO
Figure 10. Schematic diagram for the quantitative analysis of –COOH groups using Toludine Blue O [24].
A 30 µM stock solution of TBO was prepared by dissolving 0.0090 g of the dye in 1000 mL deionized water. The solution was adjusted to pH=10 using 1 M NaOH solution.
standard curve. 15 µM(C2) was prepared by taking 50 mL C1 and diluting to 100 mL using
pH=10 NaOH solution. 7.5 µM (C3) was prepared by taking 25 mL C1 and diluting to 100
mL using pH=10 NaOH solution. 3.75 µM (C4) was prepared by taking 12.5 mL C1 and diluting to 100 mL using pH=10 NaOH solution. Each concentration was measured 4 times using cuvettes at 633 nm in GENESYS 10S UV-Vis spectrophotometer. The average of the four measurements was then used to prepare the standard curve of the absorbance versus dye concentration. The blank was pH=10 NaOH.
In order to measure the amount of poly(acrylic acid) grafted onto the surface of cotton fabric, 0.1 g samples of the PAA grafted fabric were immersed in 40 ml (excess) of the 30
µM(C1) TBO solution and left for treatment for 6 hours at 37 °C under constant agitation(30
Rpm) in the shaking bath, which allowed for the formation of ionic complexes between the carboxylic groups of the grafted poly(acrylic acid) chains and cationic dye. After 6 hours, the samples were removed and washed thoroughly with excess pH=10 NaOH solution to remove unattached cationic dye molecules from the samples. The washed samples were then placed
in 40 mL of 50% (w/v) acetic acid solution for 30 min at 37 °C with constant agitation (30 rpm) in the shaking bath. This step allowed for the dye molecules on the fabric surface to diffuse into the solution (TBO will go into the acid solution when pH is around 2 [24]). The TBO is released into the acetic acid solution and colored the solution blue. Then each blue solution was measured 4 times at 633 nm in GENESYS 10S UV-Vis spectrophotometer. 50% (w/v) acetic acid was used as the blank.
3.3.2 Quantitative Analysis of the Amount of -NH2 on Cotton-PAA-Chitosan Fabrics
A 2.855 mM stock solution of Acid Orange 7 (AO7) was prepared by dissolving 0.5022 g of the dye in 500 mL pH=3 HCl solution. This 2.855 mM solution was labeled as
C1. Serial dilutions were prepared based on C1 to get the standard curve. The 142.75 µM (C2) solution was prepared by taking 5 mL C1 and diluting to 100 mL using pH=3 HCl
solution. A 71.375 µM (C3) solution was prepared by taking 2.5 mL C1 and diluting to 100
mL using pH=3 HCl solution. Likewise, a 36.6875 µM (C4) solution was prepared by taking
25 mL C2 and diluting to 100 mL using pH=3 HCl solution and finally, a 17.844 µM
solution (C5) was prepared by taking 12.5 mL C2 and diluting to 100 mL using pH=3 HCl solution. C2-C5 were measured 4 times using cuvettes at 633 nm in GENESYS 10S UV-Vis spectrophotometer. The average of the four measurements was then used to prepare the standard curve of the absorbance versus dye concentration. The blank was pH=3 HCl.
In order to measure the amount of chitosan grafted onto the surface of cotton-PAA fabric, C6 solution(similar concentration of TBO) was prepared by diluting C2 five times, 0.1
g samples of the grafted fabric were immersed in 50 ml (excess) of the 28.55 µM (C6) Acid
Orange 7 solution and left for treatment for 24 hours at 50 °C under constant agitation (30
The same procedure was carried out for the control samples on which no chitosan was attached.
3.4 Arsenic Adsorption Test
Gamma counter was used to test the arsenic removal ability of samples. Arsenic containing solution is prepared firstly. Bulk solution was prepared by adding both radioactive (73As) and nonradioactive arsenic into artificial seawater(ASW). The radioactive arsenic was in a trace concentration which can be neglected compared to nonradioactive arsenic.
However, radioactive arsenic was necessary in order to have a high enough concentration for the gamma counter to measure the amount of arsenic. The concentrations of radioactive As
was controlled to 500 cpm per 1mL and nonradioactive As was controlled to 50 µg/L. These
two As were mixed well by using a magnetic stirrer.
The pH was adjusted to 7 by 0.1 M, 1 M sodium hydroxide and 0.1 M, 1 M nitric acid and checked again the following day. Adjusted to 7 again if the pH changed until the pH change in two days was within ± 0.2. To avoid the buffer causing any unexpected influence to the results, no buffer was added into the solution.
A 1000 µL aliquot of this solution was sucked up and squeezed into a liquid
scintillation vial, which was placed in the gamma counter to measure the initial concentration of arsenic. It took the gamma counter 3 min to measure the radioactivity per liquid
scintillation vial. Separating the solution into small beakers where every beaker contained 160 ml solution and a stirrer. Then the 0.1 g fabric samples were added into the solutions.
CHAPTER 4 – RESULTS AND DISCUSSIONS
4.1 Pad-Dry-Cure Process
4.1.1 Poly(acylic acid) Graft Surface Modification
Poly(acrylic acid) acts as a useful bridge between cotton fabrics and chitosan. The concentration of poly(acrylic acid) should be used is a concern. Too low would influence the amount of chitosan could be attached while too high would affect the penetration speed in the adsorption test. At the beginning, two different concentrations were prepared, 1% (w/v) and 0.5% (w/v). The cotton with 1% PAA feels stiffer than the 0.5% one.
The maximum amount of PAA that can be attached onto the cotton surface can be calculated as follows.
Schemes 4. Cross section of poly(acrylic acid) on cotton fiber.
Assumptions:
1. The cross section of cotton is a circle.
Schemes 5. Assumptive cross section and side view of poly(acrylic acid) on cotton fiber.
Area ratio of PAA to Cotton:
𝐴011 𝐴234435 =
𝜋(𝑅 + 𝑡)+− 𝜋𝑅+
𝜋𝑅+ =
𝜋 8 𝜇𝑚 + 8×10?@ 𝜇𝑚 +− 𝜋 8 𝜇𝑚 +
𝜋 8 𝜇𝑚 + = 2.0×10?@
Volume ratio of PAA to Cotton:
𝑉011 𝑉234435 =
𝐴011×𝐿
𝐴234435×𝐿 = 2.0×10?@
Mass ratio of PAA to Cotton:
DEFF
DGHIIHJ =
KEFF×LEFF
KGHIIHJ×LGHIIHJ = 2.0×10
?@×M.MNO
M.NN = 1.5×10 ?@
Mole of -COOH on 1 gram cotton fabric:
𝑁 = DRD
FF=
M.N×MOST U
V+.OW U/X3Y = 2.1×10
Where:
Density of PAA: 1.150 g/cm3 (at 25 °C)
Density of cotton: 1.55 g/cm3 (around 1.54-1.56 g/cm3) Cotton fiber diameter: 16 µm [48]
Thickness of PAA layer: 8 nm [49] MSPAA: 72.06 g/mol
Based on quantitative analysis (4.2.1), when cotton fabric was soaked into 0.5% (w/v)
PAA solution, it can take up 2.7 µmol/(gram fabric). Therefore, the coverage of PAA on
cotton fabric was around 13%.
4.1.2 Chitosan Graft Surface Modification
According to Yamini et al., chitosan-copper gel should be prepared firstly, followed by controlling the pH in a certain range, soaking PAA-cotton fabrics in that solution
fabrics, the fabrics were soaked in the chitosan solution followed by pad-dry-cure process. Finally, the cotton-PAA-chitosan fabrics were soaked in copper nitrate solution.
4.1.3 PAA-S-SSA Graft Surface Modification
After the cotton-PAA-chitosan-copper fabrics were soaked in for about two minutes, the 0.5% (w/v) PAA-S-SSA solution turned blue. In 15 minutes, the fabrics were almost totally bleached, indicating that Cu(II) was detached from the fabrics and new bonds were formed between Cu(II) and PAA-S-SSA in solution. It also suggests that acid groups from organic matter in water may also interfere the chitosan-Cu(II) bonds.
Thus, the PAA-S-SSA grafting procedure was carried out before Cu(II) was added, which turned out to be cotton-PAA-chitosan-(PAA-S-SSA)-Cu(II) fabric. PAA-S-SSA contains the styrene sulfonic acid which is stronger than carboxylic groups or phenolic acid from organic matter in water. Therefore, it may reduce the sensitivity of copper grafted cotton fabric to organic matters.
Above experiment showed that Cu(II) can be detached from fabric into the PAA-S-SSA solution. It suggests that Cu(II) prefer to form bonds with PAA-S-PAA-S-SSA. So chitosan is not much needed in cotton-PAA-chitosan-(SSA)-Cu(II) fabric. What’s more, PAA-S-SSA already contains PAA which can bond to cotton fabrics. Therefore, cotton-(PAA-S-SSA)-Cu(II) fabric was prepared.
4.2.1 Quantitative Analysis of the Amount of –COOH on Cotton-PAA Fabrics
To get the accurate result of how many carboxyl groups have been added, excess of
the 30 µM (C1) TBO solution should be added to ensure each carboxyl group reacts with
TBO molecule. Weighed three 0.1 g cotton-PAA fabrics and adding 20 mL, 30 mL, 40 mL respectively. The bottles with 20 mL, 30 mL in turned out to be no color after 6 hours while the 40 mL one still has some blue after 6 hours. So 40 mL could be used as an excess
amount, then each testing fabric was immersed in 40 mL of 30 µM (C1) TBO solution.
TBO combines with carboxyl groups under the alkaline condition. This complex will detach from the surface under acidic condition. After 6 hours, took the fabrics out and washed. These samples were then placed in 50% (w/v) acetic acid solution for 30 min. However, if adding too much acetic acid solution, the color would be too light which may increase the error, if the volume is too low, the TBO concentration would be too high which may exceed the range that spectrophotometer can measure. After trying 30 mL, 40 mL and 50 mL, 40 mL is the best choice.
Figure 11. Toluidine blue O standard curve to determine poly(acrylic acid) content.
Using the method introduced above, amounts of carboxyl groups on the cotton-PAA surface were measured. The results are shown in the Table1. The same procedure was carried out for cotton fabric, the results are shown in the Table 2.
y = 0.0379x - 0.0072 R² = 0.9964
0 0.2 0.4 0.6 0.8 1 1.2
0 5 10 15 20 25 30
A
bs
or
ba
nc
e
Table 2. Data of TBO content on cotton-PAA fabric surface.
Cotton+PAA Absorbance TBO Content
(µmol/g)
1 1.382 15.4
2 1.442 16.3
3 1.391 14.8
4 1.463 15.0
Average 15.4
Standard Deviation 0.7
Margin of Error 0.3
Variance 0.341
So the TBO amount attached on the cotton-PAA fabric was found to lie in the 95% confidence interval of 15.4±0.3 µmol per gram of fabric.
Table 3. Data of TBO content on cotton fabric surface.
Cotton Absorbance Content
(µmol/g fabric)
1 1.123 12.8
2 1.210 12.6
3 1.157 12.7
4 1.189 12.9
Average 12.7
Standard Deviation 0.1
Margin of Error 0.1
The TBO amount attached on the cotton fabric was found to lie in the 95%
confidence interval of 12.7±0.1 µmol per gram of fabric.
The content of carboxylic acids from PAA attached to fabric surface versus TBO is supposed to be 1:1. Therefore the content of –COOH in grafted-PAA is approximately ~ 2.7
µmol/(gram fabric). Based on the theoretical value from 4.1.1, the coverage was around 13%.
4.2.2 Quantitative Analysis of the Amount of -NH2 on Cotton-PAA-chitosan Fabrics
The volume of 28.55 µM (C6) Acid Orange 7 solution is also important. Through several tries 50 mL per 0.1g fabric is an appropriate volume of solution.
Figure 12. Acid Orange 7 standard curve to determine chitosan content
[Acid Orange 7] = [Absorbance-0.0178] * 56.180
The cotton-PAA-chitosan fabrics were soaked in the Acid Orange 7 solution for 24 hours and then removed. Using the spectrophotometer to measure the absorbance of the solutions, then the absorbance was transferred into concentration by using the Acid Orange 7 standard curve. From the volume of Acid Orange 7 solution added, the concentration of the dye in solution can be calculated. From conservation of mass, the total amount added
minuses the amount in the solution gives the amount on the fabrics. The total volume was 50
ml and total amount was 1.460 µmol. The results are shown in Table 4.
y = 0.0178x + 0.0178 R² = 0.99946
0 0.5 1 1.5 2 2.5 3
0 20 40 60 80 100 120 140
A bs or ba nc e
Table 4. Data of Acid Orange 7 content on cotton-PAA-chitosan fabric surface
Fabric Absorbance AO7 content
(µmol/g)
1 0.088 12.8
2 0.120 11.0
3 0.164 9.8
4 0.111 11.2
Average 11.2
Standard Deviation 1.2
Margin of Error 0.6
Variance 1.47
So the AO7 amount attached on the cotton-PAA-chitosan fabric was found to lie in
the 95% confidence interval of 11.2±0.6 µmol per gram of fabric.
The cotton-PAA fabrics were also tested in the same way as a blank. And the results are shown in Table 5.
Table 5. Data of Acid Orange 7 content on cotton-PAA fabric surface
Fabric Absorbance AO7 content
(µmol/g)
1 0.513 0.64
2 0.525 0.35
3 0.530 0.23
4 0.529 0.25
Average 0.37
Standard Deviation 0.2
Margin of Error 0.09
The AO7 amount attached on the cotton-PAA fabric was found to lie in the 95%
confidence interval of 0.37±0.09 µmol per gram of fabric.
The actual Acid Orange 7 content related to content of chitosan equals to the content of cotton-PAA-chitosan fabric minus the content of cotton-PAA fabric. Actual AO7 content is approximately ~10.8 µmol/(gram fabric).
To verify if the concentration of acetic acid to dissolve chitosan will cause any difference. The amounts of -NH2 groups in two different fabrics were measured, where one chitosan was dissolved in 5% acetic acid and another is 10%.
Table 6. Data of Acid Orange 7 content on two different cotton-PAA-chitosan fabrics surface, the only difference is the concentration of acetic acid used to dissolve chitosan.
Fabric Absorbance AO7 content
(µmol/g)
5% AA 0.170 10.9
10% AA 0.101 10.5
Average 10.7
Standard Deviation 0.3
Variance 0.04
From the data shown above, the concentration to dissolve the chitosan nearly has no influence on the amount of chitosan which can be grafted on the cotton-PAA fabrics.
pH as a factor influences the adsorption test, it is important to decide the suitable pH value for adsorption test. Arsenic adsorption with varying pH was tested by Jonathan Sawyer [47]. As shown in Figure 10. From his results, pH=6.2-6.6 maybe the best pH for adsorption test. Considering the real river water, pH 7 was used in the test. pH was adjusted by using sodium hydroxide and nitric acid.
Figure 13.Arsenic adsorption on to the fabric at varying pH levels. Bis-tris-propane was used as a buffer for the pH 8.7 – 8.9 sample. The As concentrations are converted directly from
CPM readings of the radio-labeled arsenic in solution [47].
was 50 µg/L. Tests were carried out in 160 mL 50 µg/L solution. The fabric weights have
been standardized to 100 mg.
Figure 14.The concentration of As in solution as a function of time after the fabrics were soaked in the solutions [48].
Figure 15. The concentration of As in solution as a function of time after the fabrics were soaked in the solutions [48].
As concentration is reduced in proportion to the amount of ratio(R) used to functionalize the fabric surface. R is the mole ratio of copper to chitosan. The acetic acid used to dissolve chitosan doesn’t influence the amount of chitosan on the fabrics, which have been discussed in 4.2.2. 2% acetic lines and 4% acetic lines in Figure 16 have some
differences in final As concentrations, those may due to the unwashed agents that cause some changes to the solution or due to the error of gamma counter.
solution and 1% (w/v) chitosan dissolved in 4% (w/v) acetic acid were used to prepare the fabrics. And this fabric was used for the adsorption tests in Fig 15 and Fig 16.
Table 7. Digestion method EPA-30506, samples were measured via ICP-MA in EATS lab [47].
Fabric Digestion mg/g Fabric Cu release µg/g Fabric
Cu containing Fabric
8.80 ± 0.72 -261.06 ± 61.82
To solve this hazard problem, one possible way is substituting copper(II) with other non-toxic metal ions.
Fe(III) is an ion can be tried, it is also very abundant in nature, there is no toxicity concerns for Fe(III). PAA-S-SSA is also tried in Fe(III)-fabric preparation. PAA-S-SSA is a copolymer of acrylic acid, styrene and styrene sulfonic acid.
Five new samples were prepared, PAA concentrations were all 0.5%, chitosan was of a concentration of 1% and was dissolved in 4% acetic acid. Cu(II) concentration is 400 mg Cu(NO3)2•3H2O/100 ml DI water. Fe(III) concentration is 200 mg Fe(NO3)3/100 mg DI water.
1. Cotton with PAA, chitosan and Cu(II),
4. Cotton with PAA, chitosan, PAA-S-SSA and Fe(III), 5. Cotton with only PAA-S-SSA and Fe(III).
Also, two control samples: cotton-PAA-chitosan and cotton-(PAA-S-SSA) were prepared.
The adsorption tests were carried out in 80 mL, 50 µg/L solution. The fabrics weights
have been all standardized to 50 mg. Results are showed in Figure 17. CH stands for chitosan, Co stands for copolymer of acrylic acid, styrene, and styrene sulfonic acid, Cu stands for Cu(II) and Fe stands for Fe(III). For example: PAA-CH-Cu means cotton fabric with PAA, Chitosan, Cu(II) on.
Figure 16.Adsorption test results of new prepared five samples and one blank sample. 0 10 20 30 40 50 60
0 500 1000 1500 2000 2500 3000
Duplicate adsorption test of PAA-CH-Co-Fe and Co-Fe and another blank sample were carried out in 160 mL, 50 µg/L solution. The fabrics weights have been all standardized
to 100 mg. The duplicate test was performed to find if the size matters in adsorption test. The result is added below in Figure 18.
Figure 17.Control fabric test and duplicate adsorption test of PAA-CH-Co-Fe and Co-Fe in Fig 16
Based on the above results, the cotton fabrics modified with PAA-S-SSA and Fe(III) can remove 90% of arsenic in 15 hours and remove more than 95% of arsenic in 48 hours.
The fabrics without Cu(II) or Fe(III) on have no sites for arsenic to attach with therefore they were unable to remove arsenic. Arsenic removal ability of two batches of
0 10 20 30 40 50 60
0 500 1000 1500 2000 2500 3000
CHAPTER 5 – CONLCUSION
From the research carried out and reported in this thesis, it is able to attach
poly(acrylic acid), chitosan and poly(acrylic acid-co-styrene-co-styrene sulfonic acid) onto cotton fabrics via the pad-dry-cure process. The amounts of carboxylic groups and ammonia groups can be determined colorimetrically by using a basic dye and acidic dye respectively. Cotton fabrics surface modifies with PAA or PAA, chitosan or PAA-S-SSA were not able to remove arsenic on adsorption test unless Cu(II) was attached to the fabrics, this kind of fabric has an ability to remove more than 90% of arsenic from water within 48 hours. But these results were difficult to duplicate.
In addition, fabrics with Cu(II) exhibited leaching problem, that is, copper ions left the fabrics and migrated into water when the fabrics were soaked in water for a long time (e.g. 48 h).
![Figure 1. The Eh-pH diagram for arsenic at 25 ℃ and 101.3 kPa [8].](https://thumb-us.123doks.com/thumbv2/123dok_us/1675992.1211101/20.612.142.500.250.557/figure-eh-ph-diagram-arsenic-kpa.webp)
![Figure 2. Dissociation of arsenious and arsenic (V) acids [8].](https://thumb-us.123doks.com/thumbv2/123dok_us/1675992.1211101/21.612.97.537.73.189/figure-dissociation-arsenious-arsenic-v-acids.webp)
![Figure 3. Structures of cellulose, chitin and chitosan [4].](https://thumb-us.123doks.com/thumbv2/123dok_us/1675992.1211101/27.612.93.486.360.611/figure-structures-of-cellulose-chitin-and-chitosan.webp)
![Figure 4. Two types of chitosan-copper complexes based on the different conditions [2]](https://thumb-us.123doks.com/thumbv2/123dok_us/1675992.1211101/28.612.139.491.303.515/figure-types-chitosan-copper-complexes-based-different-conditions.webp)
![Figure 6. The process of pad-dry-cure method [25].](https://thumb-us.123doks.com/thumbv2/123dok_us/1675992.1211101/35.612.139.566.381.538/figure-process-pad-dry-cure-method.webp)
![Figure 9. Schematic diagram: Apparatus for preparing iron-chitosan beads [46].](https://thumb-us.123doks.com/thumbv2/123dok_us/1675992.1211101/50.612.119.511.69.377/figure-schematic-diagram-apparatus-preparing-iron-chitosan-beads.webp)