ISSN(Online): 2319-8753
ISSN (Print): 2347-6710
I
nternational
J
ournal of
I
nnovative
R
esearch in
S
cience,
E
ngineering and
T
echnology
(An ISO 3297: 2007 Certified Organization)
Vol. 4, Issue 8, August 2015
Computer Aided Diagnosis of Color Fundus
Images using 2D Discrete Wavelet Transform
and Neuro Fuzzy System
B. Ari Kuncoro
1, Filo Limantara
2, Harjoni Hutabarat
3Master of Information Technology Student, Department of Computer Science, Bina Nusantara University, Jakarta,
Indonesia1 2 3
ABSTRACT:One of the common vision threatening complications of diabetes is Diabetic Macular Edema (DME).It occurs when blood vessels in the patient's retina begin to leak into the macula region of eye. The leakages cause the macula to swell and thicken, developing gradually into blindness. To prevent diabetic patients from this, early detection of DME must be done. One of the screening methods is to carefully analyze the input fundus images. If the analyzing is performed manually it would be time consuming and inaccurate. Therefore various types of DME computer aided diagnosis have been developed. In this study, an attempt to devise such a computer aided diagnosis using 2D Discrete Wavelet Transform (DWT) based features and Adaptive Neuro-Fuzzy Inference System (ANFIS) is reported. The computational results showthat ANFIS could give 92% overall accuracy which is 9% and 2% better than feed forward neural networks with 2 and 3 hidden layers respectively.
KEYWORDS:Discrete wavelet transform, Neuro-Fuzzy, Diabetic Macular Edema, retina, Hard exudates, fundus
I. INTRODUCTION
Diabetes in recent years has become a prevalent disease in the world[1]and it causes many complications. One of the complications of diabetes is Diabetic Retinopathy (DR). It is a common diabetic retinal disease due to the blood vessels in the retina changes from its original shape. At earlier stage, the DR patient may not notice any changes in his vision. However, in the long standing DR, it may worsen and cause vision loss[2]. According to [3] and [4], DR is a common cause of blindness among adults aged 20-74 years and its prevalence keeps rising. However, it can be prevented by proper initial treatment and consulting the ophthalmologist at an early stage. If a person has diabetes for long period, the chances of developing DR are higher.
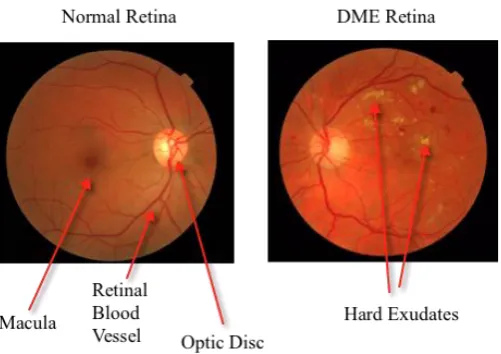
Another complication of diabetes is DME. DME comes under DR category. It occurs when blood vessels in the retina begin to leak into the macula area, a very small area at the center part of the retina that responsible for the pinpoint vision, allowing to view objects (see Fig 1, normal retina). DME mostly occurs in long standing diabetic patients and can be screened by the existence of Hard Exudates (HE) in fundus images.
ISSN(Online): 2319-8753
ISSN (Print): 2347-6710
I
nternational
J
ournal of
I
nnovative
R
esearch in
S
cience,
E
ngineering and
T
echnology
(An ISO 3297: 2007 Certified Organization)
Vol. 4, Issue 8, August 2015
Fig. 1. Normal Retina vs DME Retina Image
II. RELATEDWORK
Many researchers have used various datasets to build DME CAD systems of color fundus images. Various image pre -processing techniques and classifiers were also used. Vasanthi and Banu[1] have proposed Adaptive Neuro-Fuzzy Inference System (ANFIS) and Extreme Learning Machine (ELM) to classify whether the fundus images are in normal, mild, moderate, or severe stage of DME. The features of area and Gray-Level Co-Occurrence Matrix components(contrast, correlation, homogeneity, and energy) were used. Green channel separation from RGB (red, green, blue), filtering, image enhancement, and morphological operation were performed as pre -processing steps. The result of performances were evaluated in terms of the parameters such as sensitivity, specificity and accuracy whose values are 100%, 90% and 96.49% for ANFIS classifier and 94.28%, 100% and 96.49% for ELM classifier respectively. Unfortunately, there is no clear statement about the used dataset.
Another technique done by Angurajsiva et al [6]is much similar with the technique done by Vasanthi et al [1] in term of used features and classification method. However, they used different pre-processing steps. Angurajsiva et al performed preprocessing with RGB to gray conversion, image enhancement, and morphological operation. Upon pre -processing, optic disc removal and image segmentation were performed before extracting features.
The design strategies for classification of abnormalities in retinal images were proposed by Waghmare et al. [7]. They proposed RGB to gray, because gray scale image gives better visualization compared to the other, intensity equalization, and histogram equalization for pre-processing step. For classifier, they proposed ANFIS.
ISSN(Online): 2319-8753
ISSN (Print): 2347-6710
I
nternational
J
ournal of
I
nnovative
R
esearch in
S
cience,
E
ngineering and
T
echnology
(An ISO 3297: 2007 Certified Organization)
Vol. 4, Issue 8, August 2015
III.METHODOLOGY
In this study, MESSIDOR [5]was used as the dataset. In that dataset, there are 1200 eye fundus color numerical images of the posterior pole. They were acquired using a color video 3CCD camera on a Topcon TRC NW6 non -mydriaticretinograph with a 45-degree field of view. The images were captured using 8 bits per color plane at 1440×960, 2240×1488 or 2304×1536 pixels. Among 1200 images, 800 images were acquired with pupil dilation (one drop of Tropicamide at 0.5%) and 400 without dilation.
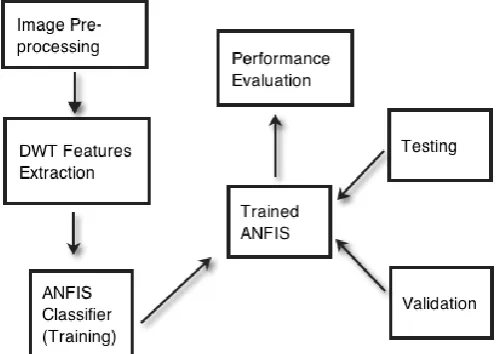
The dataset has labels of DME stages. Among 1200 data, 226 data are DME with category 1 (moderate) and 2 (severe), while the rest is category 0 (normal). In order to balance the classification system, 452 images, containing 226 normal and 226 DME were used. From 452 data, 70% were used for data training, 15% were used for data validation, and the rest 15% for data testing, divided by using interleaved indices. Figure 2 illustrates the whole steps of DME CAD system from pre-processing, feature extractions, and ANFIS classification. Each subsections below describes them in detail.
Fig. 2.Flowchart of the proposed Method
A. Pre-Processing
Figure 3 illustrates the pre-processing images for both normal and abnormal retina. First, the original images were uniformly resized into 1280×1920 pixels, because they have three various sizes. Upon resizing, they were cropped on the circular fundus, and thenthey were resized again into 1024×1024 pixels. Second, green channel was separated from RGB. This was needed to provide clear distinction between normal and abnormal images [1]. Third, image enhancement step was done with histogram equalization. The histogram equalization is very important to enhance the contrast of images, in order to suit the subsequent use.
B. Feature Extraction
ISSN(Online): 2319-8753
ISSN (Print): 2347-6710
I
nternational
J
ournal of
I
nnovative
R
esearch in
S
cience,
E
ngineering and
T
echnology
(An ISO 3297: 2007 Certified Organization)
Vol. 4, Issue 8, August 2015
Fig. 3. Pre-processing Steps on Fundus Images (a) Normal Retina, (b) Abnormal Retina with DME
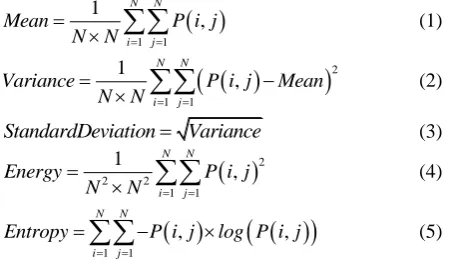
Assumed that each sub-band is represented by P matrix with N×N size, then we extracted the parameters of mean, variance, standard deviation, energy [10], and entropy with the following formulas, where i = j = 1, 2, 3, ... , N.
1 1 1 , N N i jMean P i j N N
(1)
21 1
1
,
N N
i j
Variance P i j Mean N N
(2)StandardDeviation Variance (3)
22 2 1 1 1 , N N i j
Energy P i j N N
(4)
1 1
, ,
N N
i j
Entropy P i j log P i j
(5)Because there are five features in each sub-bands, we have 20 feature candidates in total. The next step is selecting the features. First, the correlated features, which are standard deviation and variance, were eliminated. The feature of variance was eliminated. Then 2, 3, and 4 features over remaining features in each sub-bands were chosen. However the accuracy results were not met the expectation. After performing several combination experiments, it was found that selecting features based on uniform parameters of each sub-bands resulting high accuracy in range of 86.3% and 92%. Table I represents the selected features and accuracy after ANFIS classification. Note that features number 1-5 represents LL, number 6-10 represents LH, number 11-15 represents HL, and number 16-20 represents HH. As the highest accuracy among those combinations of features was 92%, the selected features are attribute 3, 8, 13, and 18, or standard deviation of LL, LH, HL, and HH respectively.
TABLE1.COMBINATION FEATURES AND ACCURACY
No Used Features Accuracy Description
1 1, 6, 11, 16 86.3% Mean
2 3, 8, 13, 18 92% Standard Deviation
3 4, 9, 14, 19 88.7% Energy
ISSN(Online): 2319-8753
ISSN (Print): 2347-6710
I
nternational
J
ournal of
I
nnovative
R
esearch in
S
cience,
E
ngineering and
T
echnology
(An ISO 3297: 2007 Certified Organization)
Vol. 4, Issue 8, August 2015
C. ANFIS Classifier
ANFIS needs data training to build fuzzy inference system (FIS). As stated, 70% of 452 data was selected as data training. Using data training with 4 inputs and 1 output, ANFIS constructs a FIS whose membership function parameters are tuned (adjusted) using Fuzzy C-Means (FCM) Clustering and Sugeno structure type. Figure 4 depicts structure of ANFIS, represents 4 input, two rules, and 1 output. The result of this step was FIS that would be validated and tested using data validation (15% of total data) and data test (15% of total data).
Fig. 4. Structure of ANFIS using Sugeno
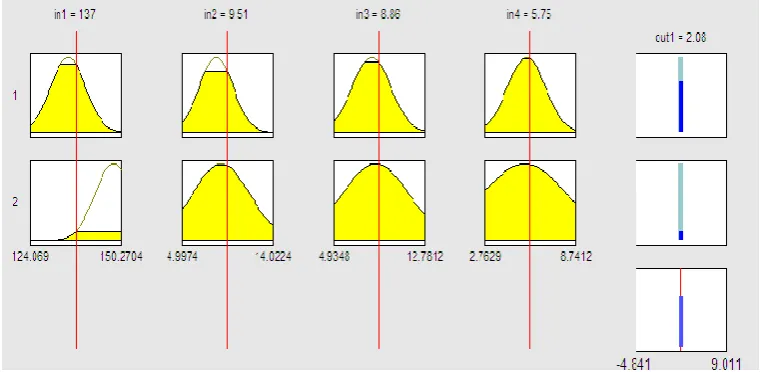
The membership functions were built using Gaussian as illustrated in Fig 5. The used two rules are stated as follow. Rule 1: If (In1 is In1cluster1) and (In2 is In2cluster1) and (In3 is In3cluster1) and (In4 is In4cluster1) then
(out1 is out1cluster1)
Rule 2: If (In1 is In1cluster2) and (In2 is In2cluster2) and (In3 is In3cluster2) and (In4 is In4cluster2) then (out1 is out1cluster2)
ISSN(Online): 2319-8753
ISSN (Print): 2347-6710
I
nternational
J
ournal of
I
nnovative
R
esearch in
S
cience,
E
ngineering and
T
echnology
(An ISO 3297: 2007 Certified Organization)
Vol. 4, Issue 8, August 2015
D. Artificial Neural Network (ANN) Classifier
In order to compare the performance of ANFIS, we used the ANFIS parent's method called Artificial Neural Network (ANN) with feed forward network type. Using similar strategies in term of data training, data testing, and data validation, we classified the retina into normal or abnormal. We used cross validation or confusion matrix to measure the performance. Since ANFIS combines the ANN and Fuzzy Logic, we hypothesized that ANN performance was less accurate than ANFIS performance. In this work we used 2 and 3 hidden layers, as well as scaled conjugate gradient backpropagation for training function.
IV.RESULTS AND DISCUSSION
ANFIS and ANN classifiers were finally trained, validated, and tested to classify color fundus images as normal or DME. To measure the result, were evaluated in term of accuracy, sensitivity, and specificity % as follow.
Accuracy= TP+TN
TP+FN+TN+FP´100 (1)
Sensitivity= TP
TP+FN´100 (2)
100 TN
Specificity
TN FP
(3)
Where,
True Positive (TP) means the normal retinal image is detected as normal. True Negative (TN) means the abnormal retinal image is detected as abnormal. False Positive (FP) means the abnormal image is detected as normal.
False Negative (FN) means the normal retinal image is detected as abnormal.
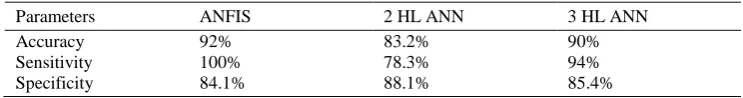
Table II represents the performance of ANFIS, 2 hidden-layers ANN, and 3 hidden-layers ANN. The accuracy, sensitivity, and specificity for 2 hidden-layers ANN classifier are 83.2%, 78.3%, and 88.1% respectively. While the accuracy, sensitivity, and specificity for 3 hidden-layers ANN classifiers are 90%, 94%, and 85.4%. In term of specificity, ANN with 2 hidden layers is the best among others. However, in term of sensitivity and overall accuracy, ANFIS is the best classifier.
TABLEII.PERFORMANCE MEASUREMENT RESULT OF ANFIS,2HIDDEN LAYERS ANN, AND 3HIDDEN LAYERS ANN
Parameters ANFIS 2 HL ANN 3 HL ANN
Accuracy 92% 83.2% 90%
Sensitivity 100% 78.3% 94%
Specificity 84.1% 88.1% 85.4%
ISSN(Online): 2319-8753
ISSN (Print): 2347-6710
I
nternational
J
ournal of
I
nnovative
R
esearch in
S
cience,
E
ngineering and
T
echnology
(An ISO 3297: 2007 Certified Organization)
Vol. 4, Issue 8, August 2015
Fig. 6. ANFIS Performance with Confusion Matrix
V. CONCLUSION
In this paper we propose DME CAD of color fundus images using 2D DWT and ANFIS. By using MESSIDOR dataset, we have successfully trained the system to classify whether the fundus image is normal or abnormal with overall 92% accuracy. The results show that our proposed method is 9% and 2% better than 2-hidden layers ANN and 3-hidden layers respectively.
FUTURE WORKS
We recommend continuing this work in order to classify DME severity into moderate and severe. Detection and cropping of macula area can be considered to improve the accuracy.
ACKNOWLEDGMENT
ISSN(Online): 2319-8753
ISSN (Print): 2347-6710
I
nternational
J
ournal of
I
nnovative
R
esearch in
S
cience,
E
ngineering and
T
echnology
(An ISO 3297: 2007 Certified Organization)
Vol. 4, Issue 8, August 2015
REFERENCES
[1] S. Vasanthi and R. S. D. W. Banu, “Automatic Segmentation and Classification of Hard Exudates to Detect Macular Edema in Fundus Images,” J. Theor. Appl. Inf. Technol., vol. 66, no. 3, pp. 684–690, 2014.
[2] NEI, “Facts About Diabetic Eye Disease.” 2012.
[3] D. C. Debuc, “Novel Methods and Diagnostic Tools in Diabetic Retinopathy,” Retinal Physician, vol. 12, no. March 2015. pp. 22–27, 2015. [4] D. S. Fong, “Diabetic Retinopathy,” Diabetes Care, vol. 26, pp. 99–102, Jan. 2003.
[5] E. Decencière, X. Zhang, G. Cazuguel, B. Lay, B. Cochener, C. Trone, P. Gain, R. Ordonez, P. Massin, A. Erginay, B. Charton, and J.-C. Klein, “Feedback on a publicly distributed database: the Messidor database,” Image Anal. Stereol., vol. 33, no. 3, pp. 231–234, Aug. 2014. [6] J. Angurajsiva and S. Vasanthi, “Abnormality Classification of Diabetic Macular EDEMA in Retinal Images,” Int. J. Innov. Res. Sci. Eng.
Technol., vol. 3, no. 1, pp. 517–522, 2014.
[7] M. P. Waghmare, S. D. Chede, and P. S. M. Sakhare, “Design Strategies for Classification of Abnormalities in Retinal Images Using ANFIS,”
Int. J. Appl. or Innov. Eng. Manag., vol. 3, no. 3, pp. 388–393, 2014.
[8] M. Ramya and S. Vijayprasath, “An Effective Analysis of Macular edema Severity for Diabetic Retinopathy,” IJIRSET, vol. 3, no. 3, pp. 739– 746, 2014.
[9] TheMathWorks, “Wavelet Families,” Matlab Documentation. p. 1, 2015.
[10] R. Radha and B. Lakshman, “Retinal Image Analysis Using Morphological Process and Clustering Technique,” Signal Image Process. J., vol. 4, no. 6, pp. 55–69, 2013.
BIOGRAPHY
B. Ari Kuncoro received B. Eng. (SarjanaTeknik) in Electrical Engineering from Bandung Institute of Technology (ITB) in 2008. From 2009 to 2015, he was an intelligent networks engineer in a global telecommunication company, handled charging system of pre-paid mobile subscribers and was a software quality engineer in an Indonesian microfinance company. Currently he is a master student of Bina Nusantara University Graduate Program, Jakarta in Information Technology. His research interest includes Artificial Intelligence, Image Processing, and Data Mining.
Filo Limantara received Bachelor Degree in Information Technology from KwikKianGie Business School in 2013. He is currently a master student of Information Technology at Bina Nusantara University, Jakarta and a PHP developer at a growing online travel company. His research interest includes Artificial Intelligence and Machine Learning.