ABSTRACT
HAMLIN, KIMBERLY MAE SPANGLER. The State of Stream Restoration in the North Carolina Piedmont: An Assessment of Instream Structure Durability and Stream Bank Erosion. (Under the direction of Dr. Theodore Henry Shear).
I evaluated 583 instream structures in 19 stream restorations that were between 4 and 12
years old, focusing on damage to structure components and surrounding banks. These structures
included rock cross vanes, single arm vanes, j-hook vanes, rootwad revetments, and boulder
revetments. I also calculated Bank Erosion Hazard Indices (BEHIs) for the stream restorations
and six reference streams. A threshold value for both structure condition and BEHI score was
specified. This threshold value indicated the point where structure and bank condition may be
questioned. Rock cross vanes and rootwad revetments were the least durable, reaching the
threshold value in years 4 and 6 respectively. J-hook vanes and single arm vanes did not pass the
threshold value until years 11 and 10 respectively. Boulder revetments approached but never
reached the threshold value and were the most durable structures. The majority of BEHI scores
in stream restorations and references were above the threshold value. No relationships were
found between structure condition, structure density, or number of structures per stream and
BEHI scores. This suggests erosion is the result of large scale disturbances within the watershed
to which both restorations and references are reacting similarly. Limiting the number of instream
structures will reduce costs associated with stream restoration. Instream structure design should
be critically examined to improve or remove structures that are not contributing to restoration
success. Collecting pre-restoration erosion data and reference stream bank data annually will also
be useful in determining success by providing tangible evidence of improvement during the
The State of Stream Restoration in the North Carolina Piedmont: An Assessment of Instream Structure Durability and Stream Bank Erosion
by
Kimberly Mae Spangler Hamlin
A thesis submitted to the Graduate Faculty of North Carolina State University
in partial fulfillment of the requirements for the degree of
Master of Science
Natural Resources
Raleigh, North Carolina
2011
APPROVED BY:
_______________________________ ______________________________
Dr. P. R. Puckett Dr. R. E. Emanuel
________________________________ Dr. T. H. Shear
ii DEDICATION
For Mom and Dad. “Soon” has finally come.
iii BIOGRAPHY
Kim was fortunate enough to grow up in a West Virginia family who enjoyed touring the
most beautiful state in the nation with their two children in tow. As a youngster, Kim felt
happiest when sitting in front of a fire eating s’mores or perching herself on a boulder to bait her
fishing hook and admire the mountain laurel. It took her some time to realize how much it all
meant to her; approximately 20 years.
Kim began college in marine science and switched to biological sciences after her
freshman year. More unsure than unguided, she made her way through the curriculum in hopes
of entering veterinary school upon graduating from North Carolina State University. This was not in the cards, thankfully, and she went on to obtain an associate’s degree in environmental
technology from Wake Technical Community College. She remembered all those days spent
fishing and running around the forest. Her epiphany inspired her to research environmental
graduate programs, and her short list was eventually narrowed down to the natural science master’s program with a technical option in ecological restoration at North Carolina State
University.
Never one to focus on one thing at a time, Kim also completed a 50 mile race, married
her law school student fiancé, and purchased a home. Although she does not regret these events,
she does not recommend them to those wishing to finish their degree on time.
The future is always uncertain, but as Kim is forced into the real world she knows the
strong support of her family and friends will guide her through life as it did through school. To
iv ACKNOWLEDGMENTS
There are many who deserve more than mere acknowledgments. My parents were
instrumental in making secondary education possible. My grandmother taught me when life gets
tough, just get tougher. My brother kindly allowed me to squat in his home in exchange for
cleaning services and good company. He also introduced me to the wonderful world of good
beer, and to that I am grateful.
Thanks to my husband, Blake, who attended law school and worked full time so we could
eat food with nutritional value. I know you feel you could have done more, but your love and
support was all I needed, and you went above and beyond to prove both.
And of course thanks go to my family and friends who offered words of advice and
encouragement along the way. I hope to one day return the favor.
Logistically this would not have been possible without the guidance of my committee
members: Dr. Theodore Shear, Dr. Ryan Emanuel, and Dr. Paige Puckett. Your direction forced
me to always ask, “Is this important news?”
Hours in the field were luckily spent with entertaining folks: Drew Blake, the faithful
assistant; Megan Malone, my predecessor into the world of stream restoration thesis work; Fang
Yuan who never complained once about getting stuck in blackberry bushes; and Yari Johnson
who provided hours of great stories (and also educational advice). This was supplemented by
considerable input from my lab crew Pat Chess, Jose Jimenez, Amanda Johnson, Kim Shumate,
v TABLE OF CONTENTS
LIST OF TABLES...vi
LIST OF FIGURES……...vii
INTRODUCTION...1
Natural Channel Design……...2
Types of Structures...3
Modes of Failure...4
Purpose of Study...4
METHODS...5
Site Selection...5
Assessment of Instream Structure Durability...5
Rock Cross Vanes...5
Vanes and Boulders...6
Rootwad Revetments...6
Bank Erosion Hazard Index (BEHI)...6
Data Analyses...7
RESULTS...8
Structure Durability...8
Bank Erosion...10
Structure and Bank Erosion Relationships...11
DISCUSSION...14
Implications for Restoration...17
Conclusion...17
REFERENCES...19
APPENDICES...21
Appendix A. Evaluated Stream Restorations and References...22
vi LIST OF TABLES
Table 1 Structure Type Half-lives...10
Table A1 Stream Restorations Evaluated for Instream Structure Durability and Bank
Erosion...22
vii LIST OF FIGURES
Figure 1 Average Condition Scores of Instream Structures in Each Age Class...9
Figure 2 Weighted BEHI Scores for Restorations and References...11
Figure 3 Comparison of Average Structure Condition Scores and Weighted BEHI Scores...12
Figure 4 Comparison of Total Number of Structures and Weighted BEHI Scores...12
Figure 5 Comparison of Structure Density and Weighted BEHI Scores...13
Figure B1 Rock Cross Vane Damage...24
Figure B2 Single Arm Vane Damage...25
Figure B3 J-hook Vane Damage...26
Figure B4 Rootwad Revetment Damage...27
Figure B5 Bank Erosion in a Stream Restoration...28
1 INTRODUCTION
My goal was to determine the durability of instream structures in North Carolina
Piedmont stream restorations that were four to twelve years old. I was interested in the effect of
age on incidences of instream structure failure. In addition to structure assessments, I evaluated
bank erosion potential to detect relationships between instream structure installation and stream
bank stability.
Stream restoration strives to improve water quality through reducing erosion. The
associated expense has raised questions to the sustainability of the practice; especially in North
Carolina. A recent study found the median stream restoration project cost in North Carolina was
$596,518 compared with $18,800 nationwide (Sudduth, et al., 2007). The higher cost is due to an
increasing number of stream restorations in the southeast involving stream channel
reconfigurations and incorporating engineered instream structures (Sudduth, et al., 2007).
Structures are installed to stabilize restored stream channels and protect stream banks
(Brown, 2000); however, some exhibit decreased structural integrity over time. High velocity
flows cause damage and erosion near their placement (Ehlers, 1957; Frissell & Nawa, 1992;
Roper, et al., 1998; Miller & Kochel, 2010). The structures are often misused or installed
incorrectly leading to expensive repairs (Frissell & Nawa, 1992). Despite this, structures have
seen little changes in their designs since inception (Thompson & Stull, 2002). Most studies focus
on regions outside of North Carolina where improving water quality and habitat for game fish
are the main drivers of stream restoration. The expense of installation and repair has necessitated
a study to determine durability of these structures and effects on surrounding banks in North
2 Natural Channel Design
Natural channel design, developed by David Rosgen (1994), is one method of stream
restoration practiced in the United States. This method uses characteristics of natural stream
morphology and data on relatively undisturbed reference streams to design the dimensions of the
stream to be restored (Rosgen, 1994). Large deviations from the designed stream conditions after
restoration indicate instability (Rosgen, 1996). Stabilization is important in reducing sediment
from washing into the stream as flood waters move through the channel. A majority of the
stream restoration projects in North Carolina are designed using this technique, and most of them
rely on instream structures to stabilize the restored or newly created channel (Miller & Kochel,
2010).
Critics of natural channel design argue natural lateral migration of the stream channel is
reduced, partly due to bank hardening as a consequence of the rigid structures installed (Lave,
2009). This prevents the channel from naturally adjusting to changes in the frequency and
duration of floods and could lead to damages to instream structures. One study found 60% of
instream structures in southwest Oregon and Washington were damaged and 18% had failed
after two to ten year magnitude floods (Frissell & Nawa, 1992). They assessed 161 fish habitat
structures in 15 restorations that were 2 to 8 years post construction to determine habitat creation
success. Miller and Kochel (2010) found that stream channels in North Carolina restored using
natural channel design were prone to instability at instream structure locations due to erosion and
deposition. They found approximately 20% of structures were damaged, impaired, or had failed
in 26 restored streams in the state (Miller & Kochel, 2010). They studied restorations one to six
years after construction located mainly in the western mountains with a few located in the central
3 Types of Structures
Grade control structures, such as cross vanes, weirs, and drops, are installed when there
are lateral constraints on channels with steep slopes. The restored or created channel must gently
drop in elevation to meet the existing channel at the terminus of the restoration. This is common
practice in urban areas with infrastructure or landowner concerns near the stream edge
(Bernhardt & Palmer, 2007). Grade control decreases flow velocity and reduces the erodible
forces on the banks resulting in less sediment washed downstream. One popular grade control
structure is the rock cross vane. It consists of a cross-channel sill boulder and two arms made
from groups of boulders tied into the banks on both sides of the sill. The vane is backfilled to
prohibit water movement through the structure. When water flows over the sill it creates a scour
pool on the downstream side which provides aquatic habitat and keeps water flowing in the
center of the channel.
Vanes and deflectors concentrate flow away from the banks to reduce erosional forces
(Rosgen, 1996). Two types are single arm vanes and j-hook vanes. Single arm vanes are groups
of boulders tied into the bank on the upstream side of the structure that direct water away from
the bank on the downstream side. J-hook vanes are similar in design to single arm vanes but have
several boulders that curve out into the channel upstream of the arm to create a “J” shape. Water
flowing around the spaces in these boulders scours the bed and creates habitat.
Bank protection is also provided by rootwad and boulder revetments (Rosgen, 1996).
Rootwads are root balls attached to large tree trunks that are pushed into the banks until only the
4 boulder revetments are hard engineered structures and consist of one or more boulders placed
near banks.
Modes of Failure
Grade control and flow manipulation structures share similar challenges to their structural
integrity. Arm vanes, cross vanes, and j-hook vanes can experience arm washout, boulder
washout, and erosion around the vane. Failure is often caused by piping, where water passes
through rather than over the structure (Brown, 2000). Side cutting occurs when water is directed
at the banks when it is not passing over the structure (Brown, 2000). Undercutting, boulder
movement, flow directed at banks, and exposed banks compromise the structures by damaging
components or by depositing sediment behind the structures that can affect durability (Miller &
Kochel, 2010).
Rootwad revetments can experience side cutting (Sylte & Fischenich, 2000) as well as
rapid decay of the root ball (Maryland Department of Environment, 2000). Rootwad and boulder
revetment failures include washout of part or all of the structure, erosion nearby caused by
undercutting and piping, and direct contact of stream flow with banks.A majority of these
instream structures involve complicated designs and installations leading to potential problems.
Purpose of the Study
Examining restorations between four to twelve years old will give insight to the
durability of instream structures and stream bank stability in the Piedmont of North Carolina.
Previous studies focused on overall instream structure durability or on stream restorations in
different regions of the United States with the goal of improving fish habitat. Evaluating stream
bank stability will be important in assessing similarities between stream restorations and
5 METHODS
Site Selection
Sites were selected from publicly available stream restoration project monitoring reports
on the NC Ecosystem Enhancement Program website. Nineteen restoration sites were chosen in
the North Carolina Piedmont that were between four and twelve years old. The reports often
included reference streams, and six were evaluated for erosion potential. Stream restoration sites
are in Table A1 and reference streams are in Table A2 (Appendix A).
Assessment of Instream Structure Durability
Durability was determined by examining modes of failure of individual rock cross vanes,
single arm vanes, j-hook vanes, rootwad revetments, and boulders. Each structure was assigned a
score of zero to five. A score of zero indicated there was little to no damage to the structure
components or surrounding banks, and the structure was functioning as intended. A score of
three indicated concerning damage to the structure and banks which compromised structure
function but not to the extent it was ineffective. A score of five indicated severe damage to the
structure and complete failure of function resulting in severe erosion to surrounding banks. A
structure score of three or more was designated as the threshold value where structural integrity
may be questioned. Each structure was photographed and catalogued.
Rock Cross Vanes
Cross vanes were assessed using Puckett’s Rock Cross Vane Rapid Assessment Tool
(Puckett, 2007, unpublished data). This worksheet provides a rating scale to determine failure of
6 Vanes and Boulders
Rating scales were devised to identify modes of failure for single arm vanes, j-hook
vanes, and boulders by observing these structures in stream restorations. The worksheet was
modeled after Puckett’s tool since these structures have similar components to rock cross vanes.
A total of 98 single arm vanes, 101 j-hooks, and 69 boulders were assessed.
Rootwad Revetments
Rootwad revetments were assessed using a rating scale devised from observing rootwads in restored streams. These “soft” engineering structures protect banks until natural woody
vegetation is established (Rosgen, 1996). The presumption is that once the rootwads decay,
natural woody vegetation will stabilize the banks. A total of 112 rootwad revetments were
assessed.
Bank Erosion Hazard Index (BEHI)
Channel stability was measured using a modified version of David Rosgen’s Bank
Erosion Hazard Index (BEHI) worksheet (Rosgen, 1996; Rathbun, 2008). This worksheet
provides scores for characteristics of channel conditions to generate an overall score related to
erosion potential (Rosgen, 1996). Banks with high BEHI scores are quickly eroding and in
danger of causing severe damage (score of 30 or more); lower BEHI scores indicate more stable
conditions (score of 0-30). A score of 30 was designated as the threshold value for both stream
restorations and reference streams. The following is a list of BEHI criteria and units.
Bank height/bankfull depth (ratio)
Root depth/bank height (ratio)
Root density (%)
Bank angle (degrees)
7 Points are also given for type and status of bank material. Bank material type can move
the BEHI score up or down (bedrock = low erosion potential, sand = high erosion potential), and
stratified, unstable layers increase the BEHI score. Bank characteristics were evaluated at a
designated point to obtain a BEHI score. The length of stream section with similar bank
conditions was measured. Measurement ended when there seemed to be an apparent change in
bank structure or stability. The aim was to generate BEHI scores for the majority of the stream
restoration reach. Obtaining BEHI scores is common practice in the last year of monitoring of
North Carolina stream restorations.
Data Analyses
Mean structure condition scores were compared with stream restoration age. Structures
were assumed to be in perfect condition at construction (score zero at age zero). Many
monitoring documents report components as 100% functional at the time of construction. This
includes structure condition and bed and bank conditions. Asymptotic curves were fit to the data
using SigmaPlot (SigmaPlot, Version 8, Systat Software). Structure condition scores were also
used to calculate half-lives for structure types.
Weighted averages of BEHI scores were calculated for each stream. Perfect bank
conditions were assumed at age zero and a chronosequence of the scores was created using
SigmaPlot. As with structure condition scores, an asymptotic curve was fit to the data starting at
age zero. Another asymptotic curve was fit starting at age four to detect if the assumptions
8 Scatterplots of mean structure condition scores and weighted BEHI scores for stream
restoration sites were created using JMP 8 (JMP, Version 8, SAS Institute Inc.). Total number of
structures and structure densities per stream were also compared to weighted BEHI scores using
JMP 8. Since rootwad revetments have different objectives than hard engineered structures, all
analyses were calculated with rootwads included and excluded.
RESULTS
Structure Durability
Mean rock cross vane scores reached the threshold value at year four and remained
steady through year nine. Structural integrity decreased after year nine, reaching an average
score of 4.5 by year eleven (Figure 1a).
Mean single arm vane scores at year six were approximately two. Scores approached the
threshold value in years seven through nine and reached the threshold value in year ten with a
score of approximately 3 (Figure 1b).
J-hook vane mean scores in years six and nine were just above two, but by year eleven
the average score was approximately four (Figure 1c).
Rootwad revetment mean scores were similar to scores for rock cross vanes. Average
scores reached the threshold value by year six and were steady until year ten (Figure 1d). At year
eleven the average score was approximately five.
Boulders exhibited the least damage over time. From years four to twelve the average
score slowly climbed to about 2.5 (Figure 1e). Only one stream restoration was 12 years old and
9 Figure 1 – Average Condition Scores of Instream Structures in Each Age Class. Asymptotic curves were fit for average condition scores of (a) rock cross vanes, (b) single arm vanes, (c) j-hook vanes, (d) rootwad revetments, and (e) boulder revetments. The error bars represent 1 standard deviation. A score of three and above was designated as the threshold value where structural integrity was compromised.
Rock Cross Vanes Single Arm Vanes
J-hook Vanes Rootwads
10 Table 1 – Structure Type Half-lives
Structure
Half-life (years) Rock Cross Vanes 6.5 Single Arm Vanes 10.9
J-hook Vanes 15.6
Rootwads 4.9
Boulders 24.3
Table 1 shows the half-lives for each structure type. Rootwads have the shortest half-life
at 4.9 years, followed by rock cross vanes with a half-life of 6.5 years. Single arm vanes and
j-hook vanes have half-lives of 10.9 years and 15.6 years respectively. Boulders have the longest
half-life at 24.3 years.
Bank Erosion
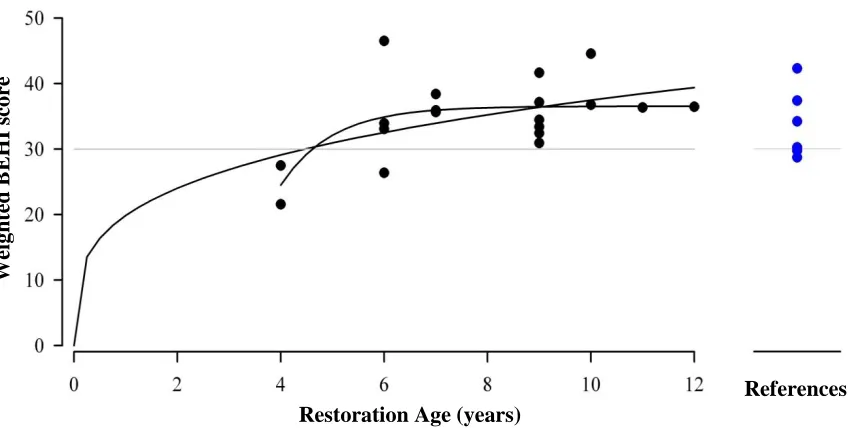
Weighted BEHI scores in stream restorations approached the threshold value at age four
in both curves (Figure 2). The BEHI scores surpassed the threshold value by age six and
remained relatively constant through age twelve (Figure 2). The average weighted BEHI score
11 Figure 2 – Weighted BEHI Scores for Stream Restorations and Reference Streams. A BEHI score of 30 or more was designated as the threshold value where bank erosion became
concerning. Asymptotic curves were fit starting at ages 0 and 4 to note if assumptions affected the output.
Structure and Bank Erosion Relationships
Structure condition was not related to average weighted BEHI scores (Figure 3 a-b).
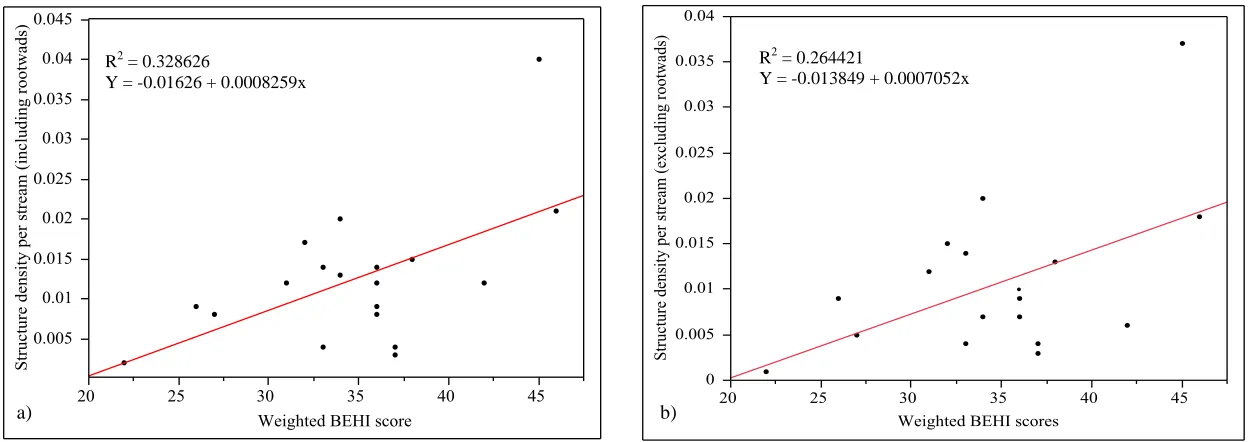
Weighted BEHI scores were also not related to the total number of structures per stream (Figure
4 a-b) and the structure density per stream (Figure 5 a-b). Excluding rootwad revetments from
the analyses had no effect.
Restoration Age (years)
Wei
gh
ted
B
E
H
I s
cor
e
12 Figure 3 – Comparison of Average Structure Condition Scores and Weighted BEHI Scores a) including rootwads and b) excluding rootwads.
Figure 4 – Comparison of Total Number of Structures and Weighted BEHI Scores a) including rootwads and b) excluding rootwads.
R2 = 0.002954
Y = 2.5631588 + 0.0065053x R2 = 0.015523
Y = 2.4822134 + 0.0118577x
R2 = 0.071198
Y = 78.651515 - 1.3787879x
R2 = 0.075425
Y = 67.944005 - 1.240448x
a)
a)
b)
13 Figure 5 – Comparison of Structure Density and Weighted BEHI Scores a) including rootwads and b) excluding rootwads.
R2 = 0.328626
Y = -0.01626 + 0.0008259x
R2 = 0.264421
Y = -0.013849 + 0.0007052x
14 DISCUSSION
Several studies have examined the durability of instream structures, but many are from
regions where creating and restoring fish habitat is the main goal of stream restoration. One
study reviewed literature and gives an example instream structure lifespan of 15-20 years (Hicks
and Reeves, 1994). The investigators wanted to determine if instream structures could potentially
promote fish habitat in New Zealand. Another study from southwest Oregon and Washington
estimated the half-life for instream structures at 10-15 years (Frissell and Nawa, 1992). A United
States Department of Agriculture report for the Klamath River tributaries projected lifespans for
instream structures similar to single arm vanes, j-hook vanes, boulders, and rootwads at 50 years
(Olsen & West, 1991). This was calculated using the age of the structure and the percentage of
the structure intact. However, instream structures in North Carolina Piedmont stream restorations
are degrading within five to eight years after installation.
Of all the hard engineered structures, rock cross vanes suffered the highest occurrences of
damage in this study. The half-life for rock cross vanes was 6.5 years. There were problems with
arm and sill failure due to insufficient backfill and improper alignment. Rock cross vanes also
experienced erosion directly downstream of the arms either due to side cutting of water or flow
expansion out of the vane. This was preventing the establishment of woody vegetation in some
cases. Miller and Kochel (2010) reported similar results with rock cross vanes experiencing the
most instances of damage among the structures they surveyed. Rock cross vanes are complex
structures involving many footer and arm boulders. Correctly sizing boulders and properly
15 through. The complicated design leads to difficult installation and repair which can become
expensive.
Single arm vanes were the third most durable structures. The scores passed the threshold
value at age ten and the half-life for single arm vanes was 10.9 years. Problems resulted from
erosion behind boulders which compromised stability. This was either due to improper alignment
of the vane or insufficient backfill which allowed water to move behind the arm and dislodge
boulders. Occasionally, the arm vanes were too steep which resulted in undercutting of the footer
boulders. Erosion occurred once the boulders were washed away from the bank. Although not as
complicated or expensive to install and repair as rock cross vanes, careful placement and sizing
of boulders is still important to the success of these vanes.
J-hook vanes were more durable than single arm vanes, and surpassed the threshold value
after nine years and had a half-life of 15.6 years. Problems and causes for j-hook vane failures
were similar to those for single arm vanes. In addition, j-hook vanes experienced problems with
scour pool development when arm boulders fell into the pool.
Rootwad revetments reached the threshold value six years after construction, but held
constant up to year ten. The half-life for rootwads was 4.9 years. Rootwads were also highly
impacted according to Miller and Kochel (2010). Most problems resulted from bank erosion
behind the root ball leading to shifting of the rootwad or footer boulders. Rootwad protection is
only needed until woody vegetation becomes established; however, when parts of the structure
fail, vegetation has a difficult time growing on the eroding bank. Other problems included the
16 The continued exposure of the moist root ball to air lead to faster decay of the root ball. This
coupled with lack of vegetation reduced the stability of the structure.
Boulder scores approached but never reached the threshold value. Similar results were
seen in coastal Oregon streams restored to improve fish habitat; all boulder structures were intact
after ten years (House, 1996). This may be due to the simplicity of these structures. Many are
placed near the bank to provide protection but do not require footers or other complicated
components. Problems with boulders resulted from bed and bank erosion around the structures.
Undersized boulders experienced movement during high velocity flows. The half-life for
boulders was 24.3 years.
The average structure condition, total number of structures, and structure density were
not related to weighted BEHI scores. This suggests erosion is the result of larger scale
disturbances. Stream conditions deteriorated regardless of instream structures as evidenced by
similar BEHI scores in reference streams. Reference streams are vulnerable to flash flooding and
urban storm runoff; reasons prompting stream restoration in the first place. Consequently, the
reference streams themselves were degraded but suitable because they shared similar
characteristics to the desired channel to be created. However, restored streams with high BEHI
scores do not appear successful in reducing the amount of sediment transported downstream. To
ensure efforts to reduce erosion are working, bank erosion should be measured before
construction begins to render more decisive conclusions on stream restoration success. Both
restoration and reference stream bank erosion should be further investigated to identify causes of
17 Implications for Restoration
Stream restoration relies heavily on reducing erosion by installing instream structures;
however, these structures are exposed to stressors that compromise their structural integrity.
Damaged structures can alter the surrounding channel by directing flow toward the bank
resulting in complete structure failure if proper repairs are not made. The long term sustainability
of a stream restoration depends on the stream’s capability of naturally stabilizing itself. Limiting
the number of structures installed in stream restorations can reduce costs associated with
installation and repair and allow for more natural migration of the stream channel. More effort
can then be directed to pre-construction data collection, monitoring, and maintenance.
Watershed scale changes that affect the degraded channel should be closely studied. The
information can be used to create a more resilient stream channel using instream structures only
when necessary. Instream structure designs should be critically examined to determine which are
successful and which need to be redesigned or abandoned. Open dialogue between contractors,
designers, and academia can further our understanding of how stream restoration is evolving.
With more research into all aspects of stream restoration we can only improve on the current
state of the practice.
Conclusion
When a degraded stream is restored the banks are stabilized using bank hardening
structures. This bank hardening is important to protect the newly formed stream channel;
however, the channel is prohibited from adjusting to flood events as it would naturally. This
18 are subjected to high velocity flows that dislodge components which cause further damage and
erosion.
Careful design and planning may help reduce the damage incurred by instream structures.
More complicated structures should be installed as closely to the design as possible. The
structure components should be sized correctly for the channel and the expected and predicted
flows. Designing streams with fewer and less complicated structures will reduce repair costs
after large flood events. Simple structures such as boulder revetments were the most durable in
this study, while the most complicated structures, rock cross vanes and rootwads, were the least
durable.
Ultimately, collecting baseline data on pre-construction bank conditions is the most
important tool for advancing the practice of stream restoration. Bank conditions should stabilize
in the newly created stream and continue to promote a healthy riparian area. Subsequent
evaluations of restored bank conditions through the monitoring period compared with
simultaneous evaluations of reference stream bank conditions allow for more concrete
determinations of success and failure. This information will also be useful in evaluating the
19 REFERENCES
Bernhardt, E. S., & M.A. Palmer. 2007. Restoring Streams in an Urbanizing World. Freshwater Biology 52(4):738-751.
Brown, K. 2000. Urban Stream Restoration Practices: An Initial Assessment. Ellicot City, MD. Center for Watershed Protection.
Ehlers, R. 1956. An Evaluation of Stream Improvement Devices Constructed Eighteen Years Ago. California Fish and Game 42:203-217.
Frissell, C. A., & R.K Nawa. 1992. Incidence and Causes of Physical Failure of Artificial Habitat Structures in Streams of Western Oregon and Washington. North American Journal of Fisheries Management 12:182-197.
Hicks, B.J., & G.H. Reeves. 1994. Restoration of Stream Habitat for Fish Using In-stream Structures. Restoration of Aquatic Habitats. Selected papers from the second day of the New Zealand Limnological Society 1993 Annual Conference. Department of Conservation.
House, R. 1996. An Evaluation of Stream Restoration Structures in a Coastal Oregon Stream, 1981-1993. North American Journal of Fisheries Management 16:272-281.
JMP, Version 8. SAS Institute Inc., Cary, NC. 1989-2007.
Lave, R. 2009. The Controversy Over Natural Channel Design: Substantive Explanations and Potential Avenues for Resolution. Journal of the American Water Resources
Association 45(6):1519-1532.
Maryland Department of the Environment. 2000. Maryland’s Waterway Construction Guidelines. Maryland Department of the Environment Water Management Administration, Baltimore, MD.
Miller, J. R., & R.C. Kochel. 2010. Assessment of Channel Dynamics, In-stream Structures and Post-project Channel Adjustments in North Carolina and its Implications to Effective Stream Restoration. Environmental Earth Science 59:1681-1692.
20 Puckett, P. R. 2007. The Rock Cross Vane: A Comprehensive Study of an In-stream Structure
(Unpublished Doctoral Dissertation). Retrieved January 2010 from North Carolina State University Theses and Dissertations Database.
Rathbun, J. 2008. Standard Operating Procedure: Assessing Bank Erosion Potential Using Rosgen’s Bank Erosion Hazard Index (BEHI). Retrieved July 15, 2010 from Michigan Department of Environmental Quality, Lansing, MI.
Roper, B.R., D. Konnoff, D. Heller, & K. Wieman. 1998. Durability of Pacific Northwest
Instream Structures Following Floods. North American Journal of Fisheries Management 18:686-693.
Rosgen, D.L. 1994. A Classification of Natural Rivers. Catena 22:166-169.
Rosgen, D.L. 1996. Applied River Morphology. Wildland Hydrology. Pagosa Springs, Colorado.
SigmaPlot, Version 8. Systat Software, Inc. San Jose, California.
Sudduth, E. B., J.L. Meyer, & E.S. Bernhardt. 2007. Stream Restoration Practices in the Southeastern United States. Restoration Ecology 15(3):573-583.
Sylte, T.L., & J.C. Fischenich. 2000. Rootwad Composites for Streambank Stabilization and Habitat Enhancement, EMRRP Technical Notes Collection (ERDC TN-EMRRP-SR-21), U.S. Army Engineer Research and Development Center. Vicksburg, MS.
Thompson, D. M., & G.M. Stull. 2002. The Development and Historic Use of Habitat Structures in Channel Restoration in the United States: The Grand Experiment in Fisheries
22 Appendix A
Table A1 – Stream Restorations Evaluated for Instream Structure Durability and Bank Erosion
Stream Location Latitude and Longitude Year Constructed Linear Feet Restored Types of Structures Installed
Abbotts Creek Wake 35° 46' 23.10"N
78° 43' 46.17"W 1999 1580
vanes, rootwads
Benbow Park Guilford 36° 3' 8.11"N
79° 46' 25.89"W 2004 1915
vanes, rootwads
Bold Run Wake 36° 1' 58.61"N
78° 35' 24.37"W 2007 1629
vanes, rootwads
Brown Bark Park Guilford 36° 5' 45.16"N
79° 51' 7.15"W 2004 2855
vanes, rootwads
Chavis Park Wake 35° 46' 7.87"N 2002 2015 vanes
78° 37' 49.21"W
Ellerbee Creek Durham 36° 1' 19.89"N
78° 56' 11.71"W 2004 6279
vanes, rootwads
Forest Hills Park Durham 35° 58' 48.84"N
78° 54' 43.68"W 2005 2900 vanes
Kentwood Park Wake 35° 46' 30.23"N
78° 41' 40.39"W 2002 1400
vanes, rootwads Oakwood
Cemetery Wake
35° 47' 10.51"N
1999 200 vanes
78° 37' 39.69"W
Richland Creek Wake 35° 48' 11.52"N 2002 415 vanes
78° 43' 31.80"W Rocky Branch
Phase I Wake
35° 47' 20.47"N
78° 41' 8.43"W 2002 3300 vanes
Rocky Branch
Phase II Wake
35° 46' 53.17"N
78° 40' 14.13"W 2005 1580
vanes, rootwads Rocky Branch
Phase III Wake
35° 47' 0.25"N
78° 40' 28.63"W 2007 1380
vanes, rootwads Smith & Austin
Creeks Wake
35° 57' 18.17"N
78° 30' 11.54"W 2002 11000
vanes, rootwads
South Fork Creek Alamance 35° 50' 41.65"N
79° 20' 57.68"W 2004 3203
vanes, rootwads
Speight Branch Wake 35° 43' 8.75"N 2001 1470 vanes
78° 45' 14.91"W
Spring Valley Park Guilford 36° 2' 14.97"N
79° 48' 45.96"W 2004 1409
vanes, rootwads Yates Mill
Tributary Wake
35° 43' 48.26"N
78° 42' 2.66"W 2000 4000
23 Table A2 – Reference Streams Evaluated for Bank Erosion
Reference Stream Location Latitude and Longitude Linear feet
UT to Lake Jeanette Guilford 36° 9' 13.18"N
79° 49' 8.40"W 571
UT to Lake Wheeler Wake 35° 42' 5.38"N
78° 42' 2.54"W 1363
UT to Mine Creek Wake 35° 51' 2.46"N
78° 39' 31.50"W unknown
Morgan Creek Durham 79°06’54.62”W 35°55’24.45”N 1268
Sal’s Branch Wake 35° 53' 20.08"N
78° 45' 14.87"W 1580
Brookhaven Park Wake 35°51’12.81”N
24 Appendix B
25
26 Figure B3 – J-hook Vane Damage. Sediment has deposited behind first arm boulder, and there
27 Figure B4 – Rootwad Revetment Damage. Severe erosion occurred below and behind the root
29 Figure B6 – Bank Erosion in a Reference Stream